Hannu Hökkä  ,
Jori Uusitalo,
Harri Lindeman,
Jari Ala-Ilomäki
,
Jori Uusitalo,
Harri Lindeman,
Jari Ala-Ilomäki
Performance of weather parameters in predicting growing season water table depth variations on drained forested peatlands – a case study from southern Finland
Hökkä H., Uusitalo J., Lindeman H., Ala-Ilomäki J. (2016). Performance of weather parameters in predicting growing season water table depth variations on drained forested peatlands – a case study from southern Finland. Silva Fennica vol. 50 no. 4 article id 1687. https://doi.org/10.14214/sf.1687
Highlights
- Four-week precipitation and evapotranspiration explain much of drained peatland water table depth variation during a growing season.
Abstract
The amount of water in peat soil is one factor affecting its bearing capacity, which is a crucial aspect in planning peatland timber harvesting operations. We studied the influence of weather variables on the variation of drained peatland growing season water conditions, here the ground water table depth (WTD). WTD was manually monitored four times in 2014 and three times in 2015 in 10–30 sample plots located in four drained peatland forests in south-western Finland. For each peatland, precipitation and evapotranspiration were calculated from the records of the nearest Finnish Meteorological Institute field stations covering periods from one day to four weeks preceding the WTD monitoring date. A mixed linear model was constructed to investigate the impact of the weather parameters on WTD. Precipitation of the previous four–week period was the most important explanatory variable. The four-week evapotranspiration amount was interacting with the Julian day showing a greater effect in late summer. Other variables influencing WTD were stand volume within the three-metre radius sample plot and distance from nearest ditch. Our results show the potential of weather parameters, specifically that of the previous four-week precipitation and evapotranspiration, for predicting drained peatland water table depth variation and subsequently, the possibility to develop a more general empirical model to assist planning of harvesting operations on drained peatlands.
Keywords
peatland;
precipitation;
bearing capacity;
evapotranspiration;
mixed linear model;
water table depth
-
Hökkä,
Natural Resources Institute Finland (Luke), Management and Production of Renewable Resources, Paavo Havaksen tie 3, FI-90014 Oulun yliopisto, Finland
E-mail
hannu.hokka@luke.fi
- Uusitalo, Natural Resources Institute Finland (Luke), Green Technology, Kaironiementie 15, FI-39700 Parkano, Finland E-mail jori.uusitalo@luke.fi
- Lindeman, Natural Resources Institute Finland (Luke), Green Technology, Kaironiementie 15, FI-39700 Parkano, Finland E-mail harri.lindeman@luke.fi
- Ala-Ilomäki, Natural Resources Institute Finland (Luke), Green Technology, Jokiniemenkuja 1, FI-01370 Vantaa, Finland E-mail jari.ala-ilomaki@luke.fi
Received 17 August 2016 Accepted 6 October 2016 Published 17 October 2016
Views 122344
Available at https://doi.org/10.14214/sf.1687 | Download PDF

1 Introduction
About 10 M ha of boreal peatlands have been drained for timber production in the Nordic and Baltic countries (Päivänen and Hånell 2012). In a majority of the drained area tree growth has responded to drainage and has resulted in harvestable growing stock on previously treeless or poorly forested peatlands. There is, however, a problem in the utilization of the timber resources in the drained sites. The generally poor bearing capacity of peat makes harvest conditions more demanding than those in the upland sites (Uusitalo and Ala-Ilomäki 2013). Due to the poor support of peat for harvesting machines, peatland harvesting has been traditionally done in seasons when the soil is frozen to prevent machines from sinking. From the point of view of uninterrupted wood procurement, year-round timber harvesting should be possible also on peatland sites instead of being limited to a short period of frozen soil (Uusitalo and Ala-Ilomäki 2013; Uusitalo et al. 2015). Furthermore, owing to the warming climate frozen soil conditions in winter months occur for shorter periods than previously. Thus, the bearing capacity of peat soils and the factors influencing the bearing capacity have been the target of several recent wood procurement studies (e.g. Nugent et al. 2003; Zeleke et al. 2007; Ala-Ilomäki et al. 2011; Uusitalo and Ala-Ilomäki 2013).
In drained peatland sites the bearing capacity is most importantly linked to tree stand volume because volume is connected to the amount of roots in the upper peat layer, which form the supporting structure in the top soil layer (Uusitalo and Ala-Ilomäki 2013). Of the several other factors affecting the peat bearing capacity, one is peat water content. According to Amarjan (1972) shear strength of peat is controlled by moisture content and decomposition rate of peat. However, the role of moisture content in the models predicting bearing capacity of peat is in many cases difficult to prove since moisture content is heavily dependent on tree stand volume (Uusitalo and Ala-Ilomäki 2013).
Because peatland water table level correlates with water content of the topmost peat layer (Heikurainen et al. 1964), water table is commonly used as an indicator of peat soil water content. It is well established that during the frost-free period in a drained boreal peatland the water table is high in spring due to the abundance of meltwater. From early summer to late summer the water table shows a lowering trend and a rise again in fall (Vompersky and Sirin 1997; Ahti and Hökkä 2006). Around the lowering trend, there is significant variability depending on the occurrence, strength, and duration of precipitation and droughts during the growing season (e.g., Jutras et al. 2006a; Amatya et al. 2006; Hökkä et al. 2013).
Concerning peatland harvesting areas, the prevailing soil water table level can be measured in the field manually, but it normally demands preparatory instrumentation to be reliable. Instead of measuring the water table depth in situ, a more suitable approach would be to predict the water table depth with a model. As an example, in the hydrologic model DRAINMOD detailed weather data in combination with information on drainage, topography, soil hydrological parameters, and vegetation parameters are used as input variables to simulate hourly or daily hydrology of a Loblolly pine (Pinus taeda L.) stand , including WTD (Amatya and Skaggs 2001; Tian et al. 2012). While detailed information on these variables may not always be available, a similar type of model based on the correlation between weather conditions and the water table depth in the soil (e.g., Mannerkoski et al. 2005) could be a useful tool in peatland forestry. In a case study by Hökkä et al. (2013) precipitation and potential evapotranspiration (cumulative and during the previous month) were found to be variables significantly explaining WTD variation during a growing season. If it turns out that variables describing weather conditions can be used as predictors of water table depth in a model, the model predictions could be utilized in finding periods when the peat soil water table is deeply below the soil surface and the machine sinking risk is minimized. Such a model would be useful also for other purposes where WTD is important to know, e.g., in peatland restoration studies (Laine et al. 2011) and in the estimation of the annual CO2 flux from peatlands, which is partly controlled by WTD (Ojanen et al. 2010).
The aim of this study was to find out if weather parameters representing periods of varying length can be used as explanatory variables in an empirical model to predict soil water conditions, here the water table depth, in a drained forested peatland. The data came from four drained peatlands and covered water table observations from two growing seasons.
2 Materials
The data for this study were collected from south-western Finland (Fig. 1). In four drained peatland study sites, two study transects were established perpendicular to the ditch across a drainage strip. Five temporary sample plots were established on each transect at distances of five metres (Fig. 1), except on transect 3 in peatland number 2, where 15 sample plots were established. In the midpoint of the sample plot, a 0.8 metre long perforated water table tube with an inner diameter of 33 mm was inserted into the peat in spring 2014 for monitoring the water table depth (WTD). The tubes were made of PVC plastic and installed with five mm holes along a 0.7 m length starting from the lower end, which was closed by a plastic sheet. Water table depth was monitored manually from the tubes altogether four times in summer 2014 and three times in summer 2015 with the accuracy of one centimetre. The manual measurements were conducted with a plastic stick having a centimetre scale and an electronic buzzer to indicate contact with water.
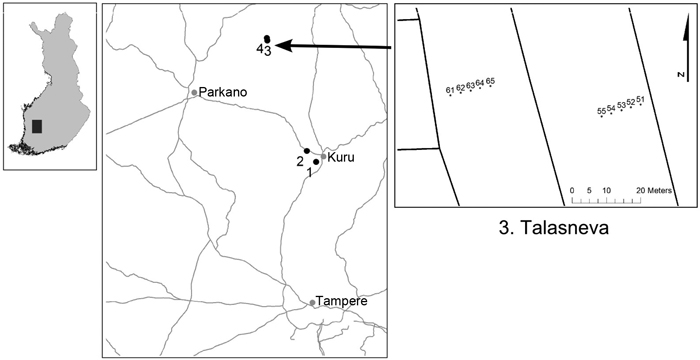
Fig. 1. Location of the studied drained peatland forests and an example of the principle for the set-up of the study transects and sample plots within transects in Talasneva.
Using the tube as the centre point, a three-meter radius circular tree sample plot was established. Locations (direction and distance) and diameters at breast height were recorded from each tree with a diameter exceeding four centimetres at breast height (1.3 m). Sample trees (altogether 156 in the whole data set) representing the diameter range were selected from the tally trees (243 in the whole data set) and measured for height to calculate stand volume, basal area and mean height of the sample plot (Table 1). The tree stands were predominantly Scots pine (Pinus sylvestris L.) and included Norway spruce (Picea abies (L.) Karst.) and pubescent birch (Betula pubescens Erhr.) at volumes of 90%, 3% and 7% of volume, respectively. Stand characteristics for each sample plot were calculated using the KPL software developed at the Finnish Forest Research Institute (Metla) (Heinonen 1994). Due to the low number of sample trees per plot, all sample trees of the same transect were utilized to calculate sample plot characteristics. Stand characteristics were used to describe the evapotranspiration (canopy interception and transpiration) potential of the tree stand in each plot.
| Table 1. Site and stand characteristics of the data (averages of each studied peatland). | ||||
| Peatland | ||||
| Characteristic | 1 | 2 | 3 | 4 |
| Site type*) | MtkgII | VatkgII | PtkgII | PtkgII |
| Latitude | 61°51.5′ | 61°53.1′ | 62°08.9′ | 62°09.3′ |
| Longitude | 23°41.9′ | 23°38.9′ | 23°24.7′ | 23°24.5′ |
| Peat thickness, m | 4.8 | 4.1 | 1.3 | 1.2 |
| Stand volume, m3 ha–1 | 258.6 | 72.3 | 168.0 | 324.8 |
| Stand basal area, m2 ha–1 | 28.5 | 12.8 | 21.8 | 38.2 |
| *) following the site type classification of Laine et al. (2012). | ||||
The study sites represented a range of drained peatland site types varying from a poor bog to productive drained pine fen, i.e., from VatkgII to MtkgII, following the classification of Laine et al. (2012) (Table 1). Ditch spacing varied from 30 to 40 metres. The shortest distance from the sample plot centre to the nearest ditch was also measured except on line 3 in peatland number 2, where the distance calculation was GIS-based. The elevation of the plot center point was determined from a digital elevation model with 0.3 metre accuracy (the National Land Survey of Finland elevation model 2 m, loaded in 1/2016). Peat thickness at the center of the sample plot was measured down to five metres with 0.1 metre accuracy.
Based on previous work of Hökkä et al. (2013), we chose precipitation and evapotranspiration as the variables of interest in this study. The local weather variables were obtained from the records of the Finnish Meteorological Institute’s meteorological field stations located nearest to each study site. Since evapotranspiration (ET) is determined in only a few measurement locations, all study sites in these data had the same ET values, measured in Jyväskylä (120 km northeast from the study sites) with the Class A pan method. Precipitation (P) slightly varied from one site to another, because the nearest meteorological station measuring precipitation was not always the same for all sites. The evapotranspiration data are from the Finnish Environment Institute’s hydrological observation’s database which is freely available.
Cumulative values were calculated for precipitation and evapotranspiration using varying time periods preceding the water table measurement date. The time periods were: one day, three days, five days, ten days, two weeks, three weeks, four weeks, and a cumulative value along all the measurement dates of each year (Table 2). In general, the growing season 2014 was dry and hot while 2015 was cool and wet.
| Table 2. Minimum, mean and maximum values (mm) of the weather variables (ET = evapotranspiration, P = precipitation) in the data (years 2014 and 2015 pooled). | |||
| Variable | min. | mean | max. |
| ET1d *) | 0.4 | 3.1 | 5.5 |
| ET3d | 2.2 | 10.3 | 18.3 |
| ET5d | 6.3 | 18.3 | 31.1 |
| ET10d | 10.4 | 35.6 | 51.5 |
| ET2w | 13.6 | 54.5 | 73.9 |
| ET3w | 23.2 | 82.6 | 115.8 |
| ET4w | 36.3 | 106.8 | 135.0 |
| P1d | 0.0 | 3.2 | 27.4 |
| P3d | 0.0 | 5.4 | 27.4 |
| P5d | 0.0 | 8.7 | 48.8 |
| P10d | 0.0 | 19.5 | 53.5 |
| P2w | 0.0 | 24.6 | 59.4 |
| P3w | 3.5 | 27.1 | 73.3 |
| P4w | 5.5 | 45.7 | 83.2 |
| *) 1d = one day, 2d = two days, …, 2w = two weeks, etc. | |||
3 Methods
To account for the hierarchical structure of the data with sample plots nested with transects and transects nested with sites, the analysis was carried out by means of linear mixed model method (McCulloch and Searle 2001). This enabled unbiased tests for the effects originating from different levels of hierarchy. Water table depth (WTD) was used as the response variable in the analysis. The following model with fixed and random parts was used to model the variability of WTD:
where
WTDkjit = water table depth in sample plot i in transect j in site k at measurement time t
b0 = model intercept
b1,n = vector of fixed coefficients for explanatory variables
X1,n = vector of potential explanatory variables (related to weather, stand, ditching)
vk = random effect of site k
fk,y = random crossed effect of year y in site k
ukj = random effect of transect j in site k
skji = random effect of plot i in transect j in site k
ekjit = random residual error
In the random part, variances related to different levels of hierarchy (study site – transect – sample plot – measurement date) were defined. Additionally, WTD may not behave in a similar manner every year in all of the studied peatlands – this was accounted for with a random crossed effect among sites and monitoring years. For the covariance structure of the successive WTD measurements, constant correlation was assumed because the length of measurement intervals was highly variable. The WTD was normally distributed so there was no need to make any transformations. In addition to weather variables, distance to ditch and stand volume or basal area with varying radius (2 and 3 m) were tested as potential explanatory variables based on findings by Haahti et al. (2012). Stand characteristics and ditch distance described the stand water use potential and site drainage conditions, respectively (c.f. Amatya and Skaggs 2001). The weather parameters covering periods of different length were tested as main effects and interactions with other explanatory variables. As a point of comparison, a null model with intercept only in the fixed part was also estimated.
Models fixed and random parameters were estimated simultaneously using the restricted maximum likelihood method (RELM) as implemented in the lmer function in the lme4 package (e.g., Doran et al. 2007) of the R software (R Core Team 2015). The model evaluation criteria were based on logical behavior of the models response with respect to the values of the explanatory variables and analysis of models residuals. The inclusion of random parameters and selection of the final model was based on the likelihood ratio test after refitting the candidate models with maximum likelihood (ML) by the anova-function in R (Baayen et al. 2008).
4 Results
In the final model two weather parameters were included. Higher P of the previous four week period was shown as significantly smaller WTD values (Table 2). The effect of four-week ET was interacting with the Julian day (DOY, the date of the measurement) showing greater effect in late summer. Also the effect of stand volume within the three metre radius was more significant in late summer (volume*DOY interaction). Increasing distance from ditch showed up as smaller WTD values. The most important explanatory variable was precipitation of a four week period.
Variables included in the models fixed part considerably reduced the variation of the null model (Table 3) at site, sample plot, and residual error level. Compared to the null model, the highest reduction in variance was at the sample plot level while the variance between transects slightly increased. The unexplained random variation of the final model among the study sites was of similar magnitude as the residual variation. Variation between transects was one-fourth of that among the sites and among the sample plots within transects one-tenth of that between the study lines. The random crossed effect of site and year was significant in both models indicating that in years 2014 and 2015 WTD behaved differently among the study sites.
| Table 3. A null model (intercept only) and the final model for drained peatland WTD during the growing season. | ||||
| Null model | Final model | |||
| Parameter | Estimate | std error | Estimate | std error |
| Fixed part | ||||
| Intercept | 27.926 | 5.597 | 37.353 | 4.879 |
| DDist | –0.790 | 0.079 | ||
| Vol*DOY*10–4 | 0.635 | 0.203 | ||
| ET4w*DOY*10–3 | 0.610 | 0.061 | ||
| P4w | –0.256 | 0.015 | ||
| Random part | Variance | Variance | ||
| Site | 87.31 | 46.514 | ||
| Transect | 13.33 | 17.428 | ||
| Sample plot | 48.24 | 1.907 | ||
| Sample plot:year | 23.77 | 37.043 | ||
| Random error | 120.12 | 48.825 | ||
| DDist = distance to nearest ditch, m Vol = Volume of the sample plot with 3 m radius, m3 ha–1 DOY = Julian day ET4w = four-week evapotranspiration, mm P4w = four-week precipitation, mm | ||||
5 Model validation
The model showed rather good agreement with the modelling data when predicting the average water table depths at the observation time points (Fig. 2). There is no trend in the bias in either year. The largest bias (2.4 cm too deep WTD) was observed on DOY 205 in 2014 and significantly deviated from 0. The bias in different sites varied quite a lot, but was also rather well accounted for by the model (Fig. 3). There was some inaccuracy in early and late summer in all sites, but no trend in any site.
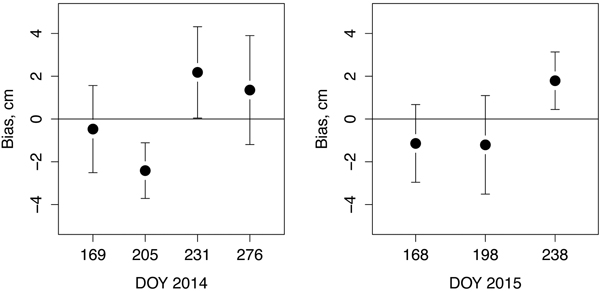
Fig. 2. Mean bias of WTD by Julian days, (DOY) of the final model (Table 3) in the modelling data in years 2014 and 2015. The 95% confidence intervals are shown by bars.
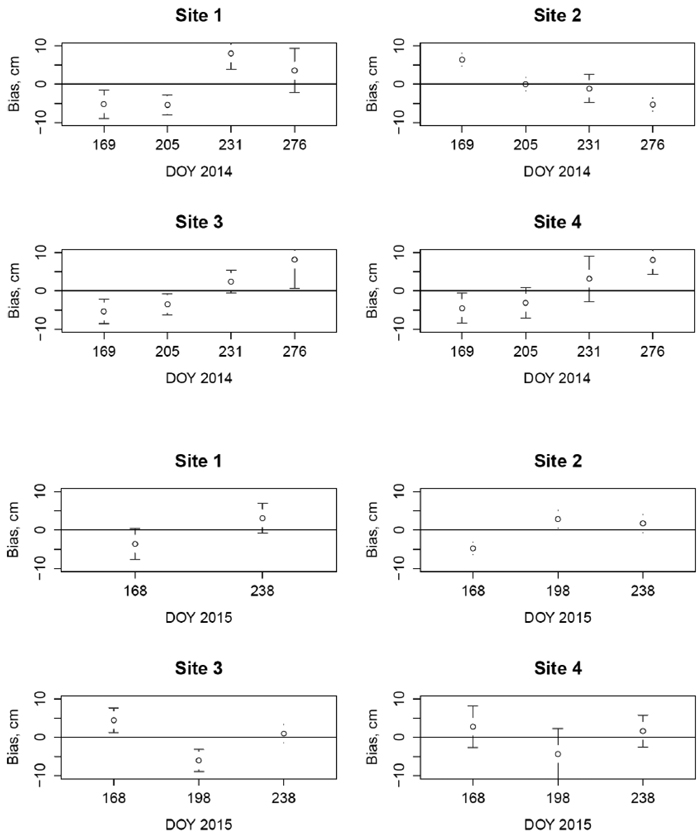
Fig. 3. Mean bias of WTD of the final model (Table 3) by different sites (1–4) by measurement dates (Julian days, DOY) in years 2014 and 2015. The 95% confidence intervals are shown by bars.
6 Discussion
The rather limited amount of data, especially the number of water table observations along the growing season did not permit very detailed modelling of WTD variability. In sparse datasets the dependences may not become uncovered. A good point was that due to very different growing seasons in 2014 and 2015, wide ranges in WTD and weather conditions were included. However, to avoid misinterpretations the model was kept very simple. The results revealed the potential of weather parameters to predict drained peatland water table depth variations during the growing season.
The weather variables used in the model influenced WTD in a logical manner. Higher four-week precipitation raised water table towards the soil surface, which is consistent with results obtained in many previous studies (e.g., Koivusalo et al. 2000; Mannerkoski et al. 2005). The effect of four-week ET on WTD was related to Julian day: the influence was clearer in late summer than in early summer. This is probably related to the fact that in early summer there is a lot of water stored in the soil due to spring snow-melt. This water storage is mainly reduced by run-off, while in late summer vegetation ET may take a bigger role in controlling the water storage. Hökkä et al. (2013) also found that the effect of four-week evapotranspiration and precipitation were significant in explaining variation of WTD. They also found that cumulative P and ET were significant, contrary to results of this study. In this study ET and P calculated for shorter periods than one month were also tested but found to be non-significant.
Increasing distance to the nearest ditch significantly raised the WTD, which has also been observed in numerous previous studies (e.g., Päivänen 1974; Jutras and Plamondon 2005; Haahti et al. 2012), and is related to the more effective drainage near the ditch (Skaggs et al. 2008).
Haahti et al. (2012) and Hökkä et al. (2013) found that surface elevation was one of the most important factors affecting the WTD. In this study such effect was found to be non-significant. This was probably due to the fact that in both of the abovementioned studies the elevation differences in the data were generated by a gentle slope over the whole study area, while in the data of this study the elevation differences were more or less random deviations from the mean elevation of each study site. Differences in WTD due to varying surface elevation may not become evident in such a situation. Further, the values of surface elevation were less accurate (+0.3 m) in this study.
Haahti et al. (2012) pointed out that especially in dry growing seasons peatland forest stand water use (combined effect of canopy interception and transpiration) as reflected by stand basal area significantly influence the WTD. Stand volume (or basal area) is tightly correlated with the amount of stand biomass (Lehtonen et al. 2004) and biomass, in turn, is correlated with leaf area index (LAI) (Majasalmi et al. 2013), thus reflecting the water use potential of the stand. Here we assumed stand volume as a surrogate for LAI which is commonly used in hydrologic models to describe the effect of canopy interception and evapotranspiration on forest hydrology (e.g. Amatya and Skaggs 2001). The interaction between WTD and stand water use in peatland sites has been shown also in several earlier studies (Penner et al. 1995; Jutras et al. 2006b; Hökkä et al. 2008; Sarkkola et al. 2010). In these data the effect of the tree volume was more significant in late summer, i.e., when the water table was deeper below the soil surface, which is in line with previous results (e.g., Ahti and Hökkä 2006; Haahti et al. 2013). Due to the small plot size, very high volumes were observed in some plots. This is however also the case in practice if small-scale variation in peat bearing capacity is assessed: there are small locations with very low or very high volume, depending on unevenness of the spatial distribution of trees within the stand.
Despite some inconsistency between observed and predicted WTDs in early and late growing seasons in different sites, the mean WTDs predicted by the model for the measurement dates were close to the observed WTDs. Whether this is adequate accuracy for estimating conditions where a specific site is harvestable cannot be judged here. The results of this study from southern Finland and those of an independent study by Hökkä et al. (2013) from northern Finland both suggest that precipitation and evapotranspiration of the previous month explain much of the variation in WTD and confirm the general importance of these weather parameters in predicting WTD, not just in one specific site. With more representative data in terms of geography and with more observations over growing seasons and over several years, higher variability in the weather parameters could be included in the modelling. That would enable a more detailed analysis and more generally applicable results. Also, more information on peat characteristics, e.g., peat type, degree decomposition, and bulk density could also explain part of the residual variation. However, information on these characteristics presumes additional field work, if it is not possible to obtain information from a data base.
The applied methodology of mixed linear models offers also a possibility to do site-specific predictions. Utilizing the model’s random part and a few observations of the response variable (here WTD) the model’s prediction can be calibrated into a specific site (Lappi and Bailey 1988).
The aim of the study was to test the impact of weather parameters on WTD by means of empirical regression analysis, but it was important to include other known effects in the same analysis since they may have direct or interacting effects with weather parameters on the studied response. In general, variables analysed in this study describing weather conditions, stand properties, topography, and drainage are comparable to those used as input in hydrological process models to simulate hydrology of a forest stand, including water table level (Amatya and Skaggs 2001). However, the level of detail was far more robust and the water processes in soil and vegetation were lacking from this empirical approach. Also the model output was WTD only.
The model developed provides an interesting possibility to predict wetness of peat prior to logging operations without any additional field operations. WTD is known to correlate with the moisture content of the upper peat layers (Heikurainen et al. 1964) which, in turn, has shown to correlate with the bearing capacity of peatland forest soil (Amarjan 1972; Uusitalo and Ala-Ilomäki 2013).
Forestry is gradually moving towards a situation where Airborne Laser Scanning (ALS) data on growing stock is available in most areas (Kotivuori et al. 2016). While at the same time most ditches are also digitized and found in geographical databases and on-line prediction of moisture content for any given point in any given stand is rather easily produced. It is very obvious that managers and operators conducting forest operations on peatlands would benefit greatly from the on-line prediction of moisture content of peat. On-line bearing capacity visualizations could help managers to bring forward or postpone operations based on weather records and provide suggestions as to where logging trails should be placed.
Acknowledgements
Ari Ryynänen from Luke Parkano assisted us in the field measurements and data management. Comments of two anonymous referees helped to improve the manuscript. The English language revision was provided by Semantix.
References
Ahti E., Hökkä H. (2006). Effects of the growth and volume of Scots pine stands on the level of the water table on peat in central Finland. Proceedings of an international conference on hydrology and management of forested wetlands, 8–12 April 2006, New Bern, North Carolina. p. 309–315.
Ala-Ilomäki J., Högnäs T., Lamminen S., Sirén M. (2011). Equipping a conventional wheeled forwarder for peatland operations. International Journal of Forest Engineering 22(1): 7–13. http://dx.doi.org/10.1080/14942119.2011.10702599.
Amarjan L.S. (1972). Metody rasceta procnosti u svigaemosti torfjanyh gruntov. Materialy k pervoj vsesojunoz konferencii po stroitel’stvu na torfjanuk gruntah. Kalinin. Cast 1:69–90. [In Russian].
Amatya D., Skaggs W. (2001). Hydrologic modeling of a drained pine plantation on poorly drained soils. Forest Science 47(1): 103–114. http://dx.doi.org/10.1016/S0378-1127(00)00520-X.
Amatya D., Skaggs R.W., Gilliam J.W. (2006). Hydrology and water quality of a loblolly pine plantation in coastal North Carolina. Proceedings of an international conference on hydrology and management of forested wetlands, 8–12 April 2006, New Bern, North Carolina. p. 16–26.
Baayen R.H., Davidson D.J., Bates D.M. (2008). Mixed effects modeling with crossed random effects for subjects and items. Journal of Memory and Language 59: 390–412. http://dx.doi.org/10.1016/j.jml.2007.12.005.
Doran H., Bates D., Bliese P., Dowling M. (2007). Estimating the multilevel Rasch model: with the lme4 package. Journal of Statistical software 20(2):1–18. http://dx.doi.org/10.18637/jss.v020.i02.
Haahti K., Koivusalo H., Hökkä H., Nieminen M., Sarkkola S. (2012). Factors affecting the spatial variability of water table depth within a drained peatland forest in northern Finland. Suo 63(3–4): 107–121. [In Finnish with English summary]. http://www.suoseura.fi/suo/pdf/Suo63_Haahti.pdf.
Heikurainen L., Päivänen J., Sarasto J. (1964). Ground water table and water content in peat soil. Acta Forestalia Fennica 77(1):1–18.
Heinonen J. (1994). Koealojen puu- ja puustotunnusten laskentaohjelma KPL: käyttöohje. [Calculation program for sample plot tree and stand data: manual]. Research Paper 504. Finnish Forest Research Institute (Metla). [In Finnish].
Hökkä H., Repola J., Laine J. (2008). Quantifying the interrelationship between tree stand growth rate and water table level in drained peatland sites within Central Finland. Canadian Journal of Forest Research 38(7): 1775–1783. http://dx.doi.org/10.1139/X08-028.
Hökkä H., Haahti K., Sarkkola S., Nieminen M., Koivusalo H. (2013). An investigation of growing season fluctuations of water table in a forestry-drained Scots pine peatland using weather data and spatial information. Poster presented in EGU 2013 Conference, Vienna.
Jutras S., Plamondon A. (2005). Water table rise after harvesting a treed fen previously drained for forestry. Suo 56: 95–100. http://www.suoseura.fi/suo/pdf/Suo56_Jutras.pdf.
Jutras S., Plamondon A.P., Hökkä H., Bégin J. (2006a). Water table changes following pre-commercial thinning on post-harvest drained wetlands. Forest ecology and Management 235: 252–259. http://dx.doi.org/10.1016/j.foreco.2006.08.335.
Jutras S., Hökkä H., Begin J., Plamondon A.P. (2006b). Beneficial influence of plant neighbours on tree growth in drained forested peatlands: a case study. Canadian Journal of Forest Research 36: 2341–2350. http://dx.doi.org/10.1139/X06-134.
Koivusalo H., Karvonen T., Lepistö A. (2000). A quasi-three-dimensional model for predicting rainfall-runoff processes in a forested catchment in Southern Finland. Hydrology and Earth Systems 4(1): 65–78. http://dx.doi.org/10.5194/hess-4-65-2000.
Kotivuori E., Korhonen L., Packalen P. (2016). Nationwide airborne laser scanning based models for volume, biomass and dominant height in Finland. Silva Fennica 50(4) article 1567. http://dx.doi.org/10.14214/sf.1567.
Laine A., Leppälä M., Tarvainen O., Päätalo M.-L., Seppänen R., Tolvanen A. (2011). Restoration of managed pine fens: effect on hydrology and vegetation. Applied Vegetation Science 14(3): 340–349. http://dx.doi.org/10.1111/j.1654-109x.2011.01123.x.
Laine J., Vasander H., Hotanen J.-P., Nousiainen H., Saarinen M., Penttilä T. (2012). Suotyypit ja turvekankaat – opas kasvupaikkojen tunnistamiseen. Metsäkustannus Oy. 160 p. [In Finnish].
Lappi J., Bailey R.L. (1988). A height prediction model with random stand and tree parameters: and alternative to traditional site index methods. Forest Science 34(4): 907–927.
Lehtonen A., Mäkipää R., Heikkinen J., Sievänen R., Liski J. (2004). Biomass expansion factors (BEFs) for Scots pine, Norway spruce and birch according to stand age for boreal forests. Forest Ecology and Management 188(1–3): 214–224. http://dx.doi.org/10.1016/j.foreco.2003.07.008.
Majasalmi T., Rautiainen M., Stenberg P., Lukes P. (2013). An assessment of ground reference methods for estimating LAI of boreal forests. Forest Ecology and Management 292: 10–18. http://dx.doi.org/10.1016/j.foreco.2012.12.017.
Mannerkoski H., Finér L., Piirainen S., Starr M. (2005). Effect of clear-cutting and site preparation on the level and quality of groundwater in some headwater catchments in eastern Finland. Forest Ecology and Management 220(1–3): 107–117. http://dx.doi.org/10.1016/j.foreco.2005.08.008.
McCulloch C.E., Searle S.R. (2001). Generalized, linear and mixed models. Wiley, New York.
Nugent C., Kanali C., Owende P.M.O., Nieuwnhuis M., Ward S. (2003). Characteristics of site disturbance due to harvesting and extraction machinery traffic on sensitive forest sites with peat soils. Forest Ecology and Management 180(1–3): 85–98. http://dx.doi.org/10.1016/S0378-1127(02)00628-X.
Ojanen P., Minkkinen K., Alm J., Penttilä T. (2010). Soil–atmosphere CO2, CH4 and N2O fluxes in boreal forestry-drained peatlands. Forest Ecology and Management 260(3): 411–421. http://doi.org/10.1016/j.foreco.2010.04.036.
Päivänen J. (1974). The effect of ditch spacing and furrowing on the depth of the ground water table and on the development of a Scots pine plantation in a small-sedge bog. Silva Fennica 8(4): 215–224. [In Finnish with English summary]. http://dx.doi.org/10.14214/sf.a14752.
Päivänen J., Hånell B. (2012). Peatland ecology and forestry – a sound approach. University of Helsinki, Department of Forest Sciences. Publications 3. ISBN 978-952-10-4531-8.
Penner M., Penttilä T., Hökkä H. (1995). A method for using random parameters in analyzing permanent sample plots. Silva Fennica 29(4): 287–296. http://doi.org/10.14214/sf.a9214.
R Core Team (2015). R: a language and environment for statistical computing. R Foundation for Statistical Computing, Vienna, Austria. https://www.R-project.org/.
Sarkkola S., Hökkä H., Koivusalo H., Nieminen M., Ahti E., Päivänen J., Laine J. (2010). Role of tree stand evapotranspiration in maintaining satisfactory drainage conditions in drained peatlands. Canadian Journal of Forest Research 40(8): 1485–1496. http://dx.doi.org/10.1139/X10-084.
Skaggs R.W., Chescheir G.M., Amatya D.M., Diggs J.D. (2008). Effects of drainage and forest management practices on hydraulic conductivity of wetland soils. In: Farrel C., Feehan J. (eds.). Proceedings of the 13th International Peat Congress, Tullamore, Ireland, 8–13.6.2008. Vol. 1, oral presentations. p. 452–456.
Tian S., Youssef M., Skaggs W., Amatya D., Chescheir G. (2012). DRAINMOD-FOREST: integrated modeling of hydrology, soil carbon and nitrogen dynamics, and plant growth for drained forests. Journal of Environmental Quality 41(3): 764–782. http://doi.org/10.2134/jeq2011.0388.
Uusitalo J., Ala-Ilomäki J. (2013). The significance of above-ground biomass, moisture content, and mechanical properties of peat layer on the bearing capacity of ditched pine bogs. Silva Fennica 47(3) article 993. http://dx.doi.org/10.14214/sf.993.
Uusitalo J., Salomäki M., Ala-Ilomäki J. (2015). Variation of the factors affecting soil bearing capacity of ditched pine bogs in Southern Finland. Scandinavian Journal of Forest Research 30(5): 429–439. http://dx.doi.org/10.1080/02827581.2015.1012110.
Vompersky S., Sirin A. (1997). Hydrology of drained forested wetlands. In: Trettin C.C., Jurgensen M.F., Grigal D.F., Gale M.R., Jeglum J.K. (eds.). Nothern forested Wetlands. Ecology and Management. CRC Press, Lewis Publishers. p. 189–211.
Zeleke G., Owende P.M.O., Kanali C.L., Ward S.M. (2007). Predicting the pressure-sinkage characteristics of two forest sites in Ireland using in situ soil mechanical properties. Biosystems Engineering 97(2): 267–281. http://dx.doi.org/10.1016/j.biosystemseng.2007.03.007.
Total of 37 references.
