Jari Vauhkonen  ,
Juho Matala,
Ari Nikula
,
Juho Matala,
Ari Nikula
Future browsing damage in seedling stands according to projected forest resources and moose population density
Vauhkonen J., Matala J., Nikula A. (2023). Future browsing damage in seedling stands according to projected forest resources and moose population density. Silva Fennica vol. 57 no. 2 article id 23012. https://doi.org/10.14214/sf.23012
Highlights
- Projections of forest resources and seedling stands damaged by moose browsing
- Damaged seedling stand area modelled by moose population and forest characteristics
- Moose damage predicted by the age class structure of simulated future forests.
Abstract
An important modifier of forests and forestry practices is browsing by cervids. As high populations of moose (Alces alces L.) cause extensive forest damage in the Fennoscandian boreal forests, models should be able to predict the susceptibility of projected forest structures to browse damage. We augmented the European Forestry Dynamics Model (EFDM) for the area of seedling stands damaged by moose. The augmented model was tested in projecting both forest resources and moose damage for 18 million hectares of forest land in Finland, based on input data from the National Forest Inventory (NFI). Modeling the area of seedling stands damaged as a function of moose population density, forest characteristics, and region-specific interactions of these variables was found to work realistically for 30 years, predicting that the area of seedling stands damaged by moose would increase by up to a third from the last NFI observation. Our work lays the groundwork for modeling consequential, large-scale ecological and socio-economic effects of moose browsing.
Keywords
forest management planning;
forest development simulation;
forest projection;
Markov chain;
scenario analysis;
transition matrix model
-
Vauhkonen,
University of Eastern Finland, School of Forest Sciences, Yliopistokatu 7, FI-80101 Joensuu, Finland; University of Helsinki, Department of Forest Sciences, Latokartanonkaari 7, FI-00014 Helsingin yliopisto, Finland
E-mail
jari.vauhkonen@uef.fi
- Matala, Natural Resources Institute Finland (Luke), Natural resources, Yliopistokatu 6 B, FI-80100 Joensuu, Finland E-mail juho.matala@luke.fi
-
Nikula,
Natural Resources Institute Finland (Luke), Natural resources, Ounasjoentie 6, FI-96200 Rovaniemi, Finland
 https://orcid.org/0000-0001-8372-8440
E-mail
ari.nikula@luke.fi
https://orcid.org/0000-0001-8372-8440
E-mail
ari.nikula@luke.fi
Received 24 February 2023 Accepted 11 July 2023 Published 20 July 2023
Views 47094
Available at https://doi.org/10.14214/sf.23012 | Download PDF

Supplementary Files
1 Introduction
Several risks are expected to influence future forests and forestry in Finland (Venäläinen et al. 2020). Therefore, it is necessary to consider disturbances in the projections of future forest resources. Even if the occurrence of storms, fires, insects and pathogens has sometimes been considered (Reyer et al. 2017; Liénard and Strigul 2016; Ray et al. 2019; Subramanian et al. 2019), integrating disturbance risks into large-scale forest resource projections is rare. Related studies have especially considered storm-related damage, which may be partly due to a relatively simple simulation of damage that destroys all or part of the growing stock (Sallnäs et al. 2015) and occurs similarly to history (Subramanian et al. 2019). However, the probabilities for these stochastic events may depend on forest management (Subramanian et al. 2019) and change due to global warming, the risk of which may be most pronounced in the boreal coniferous forests (Seidl et al. 2017).
Currently, one important modifier of forests and forestry practices is the browsing by cervids (Gill 1992; Kielland and Bryant 1998; De Jager et al. 2017). For example, high moose (Alces alces L.) populations have caused extensive forest damage in the Fennoscandian boreal forests in recent decades (Markgren 1974; Lavsund et al. 2003; Bergqvist et al. 2014; Nevalainen et al. 2016). In Finland, the results of the 10th National Forest Inventory (NFI; 2004–2008) showed some symptoms of moose damage on 990 000 hectares, or 4.9% of the total forest area (Nevalainen et al. 2016). Moose damage is partly determined by their population density, as well as factors related to available browse and suitable habitat (Hörnberg 2001a,b; Nikula et al. 2019, 2021). To investigate the effects of these factors on the successional patterns predicted for North American forests, De Jager et al. (2017) added an extension to the forest landscape simulator LANDIS-II that simulates the effects of browsing on trees. Nikula et al. (2021) developed regional models to predict the area damaged by moose as a function of their population and forest characteristics observed in the NFI. Implementation of these models in a regional forest resource projection tool would allow prediction of the susceptibility of projected forest structures to moose damage in the northern boreal forests of Europe.
We focus on the European Forestry Dynamics Model (EFDM), which was developed to simulate forest development as Markov chains of possible future events based on transition matrices derived from the NFI data (Packalen et al. 2014). A test involving the NFIs of 20 European countries (Vauhkonen et al. 2019) demonstrated the viability of the EFDM for international modelling, as it can both (i) adapt to country-specific forest structure, conditions and forestry practices, and (ii) produce results that are comparable across countries when harmonized definitions, assumptions and modelling methods are applied. The EFDM has been parameterized to project even-aged (Packalen et al. 2014), uneven-aged (Sallnäs et al. 2015) and, by combining multiple Markov chain models for even- and uneven-aged forestry, ‘any-aged’ forest management at regional to national scales (Vauhkonen and Packalen 2018, 2019). By varying assumptions according to expected future scenarios, Vauhkonen and Packalen (2018, 2019) demonstrated how the EFDM can be used to examine uncertainties related to future climate, land use and consequent changes to silvicultural practices.
The modeling of some disturbances can be based on the standard EFDM, where the occurrence and degree of damage are included as additional activities, with transition probabilities modeled in terms of the dynamic axes of the matrices used (e.g., volume and age), similar to management activities (Sallnäs et al. 2015). This feature particularly allows for scenarios of catastrophic events such as storms or wildfires that force transitions to the beginning of the rotation (Castro Rego et al. 2019, Chapter 10; Adame et al. 2020). Using the EFDM, Sallnäs et al. (2015) modeled the occurrence of calamities, based on pooled disturbance sources recorded as tree mortality in the NFI data, similar to management activities such as harvesting. The activity and transition probabilities of the calamities were assumed to depend on elevation, stem number and volume class, to be equal for the entire simulation of about 100 years, and to be independent of the management applied, which may not be realistic. Even if the transition probabilities were allowed to change over time, as in Vauhkonen and Packalen (2018), the underlying Markovian property requires the next future state to be inferred from the current one. This can be problematic for projections of disturbances such as browsing by cervids, the levels of which depend on forest structure (e.g., ratio of seedling to mature stands) and factors external to forestry (moose population density), as explained by Nikula et al. (2021). In this case, damage levels should be predicted in each time step according to the evolution of these factors.
Our objective is to complement the European Forestry Dynamics Model (EFDM) by modelling the total area of damage caused by moose. Using the augmented model, we present projections of forest structures observed in the Finnish NFI and seedling stand damage assuming moose winter population densities within the realistic variations of the Finnish moose population in recent decades.
2 Methods
2.1 Study area and data sources
We combined the 10th (NFI10) and 11th (NFI11) Finnish NFI (Data: National Forest Inventory, Natural Resources Institute Finland (Luke)), carried out in 2004–2008 (Korhonen et al. 2013) and 2009–2013 (Korhonen et al. 2017) respectively, with observations of moose winter population estimates (individuals per 1000 ha of land area) for our analyses. The combined forest resource and moose data were used for moose damage modeling similar to Nikula et al. (2021). As described in more detail in that paper, moose management areas in four geographical zones (Northern, Eastern, Southern and Western Finland) in Finland were used as estimation units, for which both the NFI resource variables and the moose population were derived. The map and descriptive statistics on areas of these zones are presented in Supplementary file S1.
We focused on productive or poorly productive forest land managed for timber production. Areas where forestry operations were prohibited (forests not available for timber production) were determined according to administrative forest use restrictions, as in Korhonen (2016), and excluded from the analyses. The areas analyzed covered almost all of Finland, excluding the southern archipelago and forests located in the northernmost areas where the NFI10 was not implemented. In total, the analyses covered about 18 million hectares, which is about 70% of the total forest area in Finland.
2.2 Modelling the area of seedling stands damaged by moose
We considered moose damage as fresh browsing of seedling stands within geographical zones of 2–6 million hectares (Suppl. file S1), which are scales representing different biogeographical conditions in Finland from the point of view of moose management (Nikula et al. 2021). Nikula et al. (2021) explored alternatives for predicting the area damaged by moose, arguing that the damage varies in different parts of the country depending on habitat selection and is driven by biogeographical differences in climate and snow, terrain, forage, settlement areas, forest vegetation and growth patterns, and competition with other (deer) species. According to the prediction model they formulated, the damage was region-specifically dependent on the total forest area, proportions of seedling stands and mature forests, and moose population density per land area. The model of Nikula et al. (2021) was specified as a mixed-effects model with the NFI (either the 10th or 11th NFI round) as the random effect, although the NFI effect was finally not found significant.
Even if descriptive disturbance models like Nikula et al. (2021) exist, they may need to be refined for use as prescriptive models with simulated forestry dynamics over time. Consequently, model evaluation should include critical validation and verification that the model workflow serves its intended purpose (Pretzsch 2009). In our case, the Nikula et al. (2021) model defined the proportions of seedling stands and mature forests according to a categorical variable that can be determined for a given forest state based on diameter limits. We conducted preliminary tests with the exact Nikula et al. (2021) model, predicting the development stage variable from the age structure, but found bias in the projections as the development stages did not correspond exactly to any age class interval. For these reasons, in order to incorporate the moose damage model into the EFDM, the relevant work involves re-fitting the damage model in terms of age classes, which is reasonable in that the development stages are also essentially dynamic, age-related forest characteristics.
We adopted the same mixed effects model structure and predictors for the damaged area as in Nikula et al. (2021), but with two changes in order to promote prediction towards future. First, we dropped the non-significant NFI effect from the model. Second, we redefined the proportions of seedling and mature forest areas in terms of the age classes used to describe forestry dynamics in the EFDM. In practice, we re-fitted the model of Nikula et al. (2021) using the generalized least squares (gls) function of the nlme library of R (Pinheiro et al. 2021). We calculated the proportions of seedling and mature stands from the NFI data based on different age thresholds (e.g., age classes <5 or 5–10 or 5–15, and so on, as seedling stands and the rest as mature stands) and tested the obtained proportions as the respective predictors of the model. The fit of the model was assessed both graphically and using the Akaike Information Criterion (AIC).
As a result, we consider the model with the following structure and predictors:
![]()
where Y is the continuous moose damage in seedling stands (km2), where “continuous” is defined as fresh browsing observed at the time of the inventory; Zone is an indicator for one of four geographical modeling units (Northern, Western, Eastern and Southern Finland); ForestArea_km2 is the forest area (km2); MoosePop_1000ha is the moose population density (animals per 1000 ha of land area); and DevStages is a vector of the proportions of seedling and mature stands (%) in the given Zone. Similar to Nikula et al. (2021), an exponential spatial correlation structure was included to account for the similarity of nearby areas. As the model and its parameters were expressed on a logarithmic scale, a bias correction as the ratio of observed to predicted mean (Snowdon 1991) was added to the anti-logarithm transformation.
The area of seedling stands damaged by moose was predicted by extracting the values of the forest characteristics projected for each geographical unit and time step (Section 2.3.). The model of Eq. 1 was used to predict damage for an average moose management area within the geographic zone. It was generalized to the entire geographical modeling unit by an expansion factor, which was the ratio of the total area of the zone to that of the average moose management area (Suppl. file S1). We used the model assuming three moose population levels. Moose population densities in the data from Nikula et al. (2021) varied from 1 to 8 animals per 1000 ha land, with a mean of 4. For our experiments, we assumed moose winter population densities of 2, 4 and 6 animals per 1000 ha, which correspond to realistic variations of the Finnish moose population in the recent decades and are well within the range of observations.
2.3 Predicting the damaged area by the projected forest area distribution using the EFDM
We downloaded v. 2.0 of the EFDM from the European Commission (2016) as free software licensed under the European Union Public Licence (EUPL, v. 1.1). The basic version of the EFDM provides an R-implementation of the generic modeling framework (Fig. 1), which each user needs to parameterize according to the country-specific forestry dynamics. The simulations of forest development are based on a matrix factorization according to ecological, technical or socio-economic factors affecting forestry dynamics or reporting, and transition probabilities specific to the cells of the matrix associated with forestry activities (see Packalen et al. 2014 for details). The parameter environment of the EFDM (Fig. 1) was defined on the basis of the NFI10 and NFI11 data and the factorization given in Suppl. file S2. Furthermore, the classification of the forest area according to NFI11 in the initial state matrix and the transition probabilities and transformation and state coefficients correspond to the previous analysis by Vauhkonen and Packalen (2019), to which the reader should refer for further details.
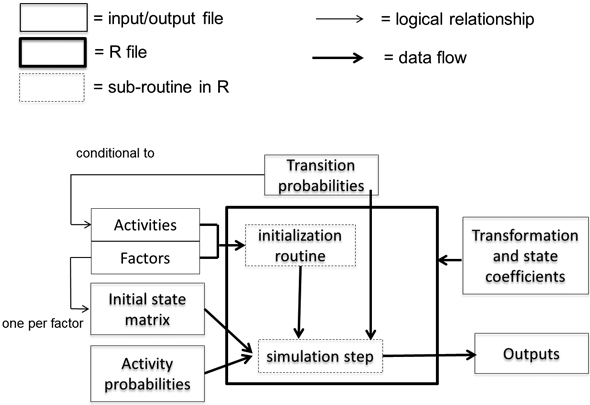
Fig. 1. The parameter environment of the European Forestry Dynamics Model (EFDM) (Vauhkonen et al. 2019).
Possible management activities were ’no management’ (i.e., simulation of natural processes only), ’thinning from below’, and ’regeneration harvesting’, which was implemented as either clear-cutting or thinning from above, depending on the forest use restrictions of the area. Clear-cutting produced the seedling stands on which moose damage was simulated and it was allowed on 91% of the total area. Clear-cutting was replaced by thinning from above in 6.5% of the area, which was restricted from most intensive management (Korhonen 2016). In the area without restrictions, the initial probabilities for the exact management activities were determined as proportions of the area recorded by the NFI that should be managed according to official silvicultural instructions within the first 5-year period. These proportions were further iterated to produce a total roundwood harvest level of 70 million m3 per year at the start of the simulations. The area proportions meeting the harvest target were set as the probabilities of the management activities for the later simulation steps, i.e., the area managed after the first step varied according to the realized forestry dynamics (cf., Vauhkonen and Packalen 2019). The growing stock and harvests projected by the EFDM are shown in Suppl. file S3, while the underlying areas of forest development stages are employed in the following.
3 Results
3.1 Developing and evaluating the damage model
Table 1 shows the final model fitted for the continuous moose damage (Eq. 1). In the model that produced the best fit in terms of the AIC, seedling stands were defined as forests aged 5–25 years in all other regions except for the northern region (5–35 years), while the older stands represented mature forests. In addition to the development stages, the moose population and forest area had a zone-specific influence on the prediction of damaged area, as shown by the different signs of the coefficients for zones and their interactions with development stages (Table 1). Fig. 2 illustrates the zone-specific differences, when the values of the predictors related to the development stages were fixed.
| Table 1. Final predictors and coefficients of Eq. 1, when fitted to National Forest Inventory (NFI) and moose population data. By default, the model predicts for zone 1 (Northern Finland), while zones 2–4 correspond to Western, Eastern, and Southern Finland, respectively, corresponding to specific dummy variables. Predictor variables ForestArea_km2, MoosePop_1000ha, Seedling_prop and Mature_prop denote forest area (km2), moose population density (animals per 1000 ha of land area), and proportions of seedling and mature stands (%), respectively. Asterisks (*) indicate interactions between two variables. | ||||
| Variable | Value | S.E. | t-value | p-value |
| Intercept | 5.72 | 1.22 | 4.69 | 0.00 |
| Zone2 | 3.19 | 2.94 | 1.08 | 0.28 |
| Zone3 | –1.60 | 2.26 | –0.71 | 0.48 |
| Zone4 | –8.08 | 2.92 | –2.77 | 0.01 |
| ForestArea_km2 | 1.8 × 10⁻⁴ | 3.0 × 10⁻⁵ | 6.05 | 0.00 |
| MoosePop_1000ha | 0.19 | 0.04 | 4.65 | 0.00 |
| Seedling_prop | –0.04 | 0.03 | –1.29 | 0.20 |
| Mature_prop | –0.03 | 0.02 | –1.80 | 0.08 |
| Zone2*Seedling_prop | –0.03 | 0.04 | –0.63 | 0.53 |
| Zone3*Seedling_prop | 0.10 | 0.04 | 2.59 | 0.01 |
| Zone4*Seedling_prop | 0.16 | 0.05 | 3.58 | 0.00 |
| Zone2*Mature_prop | –0.04 | 0.03 | –1.24 | 0.22 |
| Zone3*Mature_prop | –0.01 | 0.02 | –0.31 | 0.76 |
| Zone4*Mature_prop | 0.07 | 0.04 | 1.62 | 0.11 |
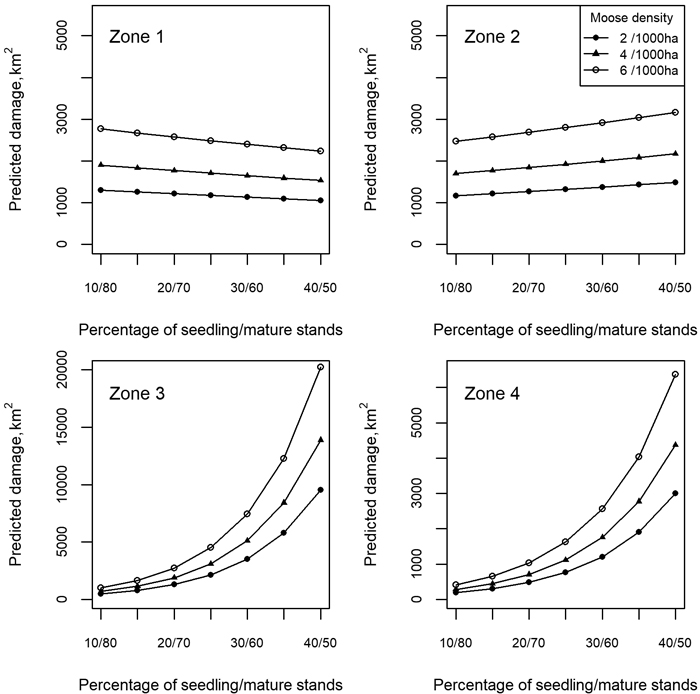
Fig. 2. Zone-specific differences in damage area predictions with three moose population sizes and fixed seedling and mature stand proportions, where zone numbers 1–4 refer to the geographical zones of Northern, Western, Eastern, and Southern Finland, respectively.
According to Fig. 3, the model fitted in this study performed comparably to the model of Nikula et al. (2021). Based on the residuals at moose management areas, the model had a higher tendency to overestimate regional damage projections of 50–150 km2 and to underestimate those of >150 km2. Damage predictions for an average moose management area in a zone were more consistent with the observations (Fig. 3). As the averages were needed in particular for future development simulations, the developed model was considered suitable for this purpose. The predictions of the mean values for some zones also showed a small bias, which can be seen when comparing the observations of the two NFIs separately (Fig. 3). Both the models exhibited this bias especially when predicting damage for an average moose management area in Northern Finland (zone with the highest observed average damage area in Fig. 3), and the models performed equally well in these aspects (Fig. 3(c)).
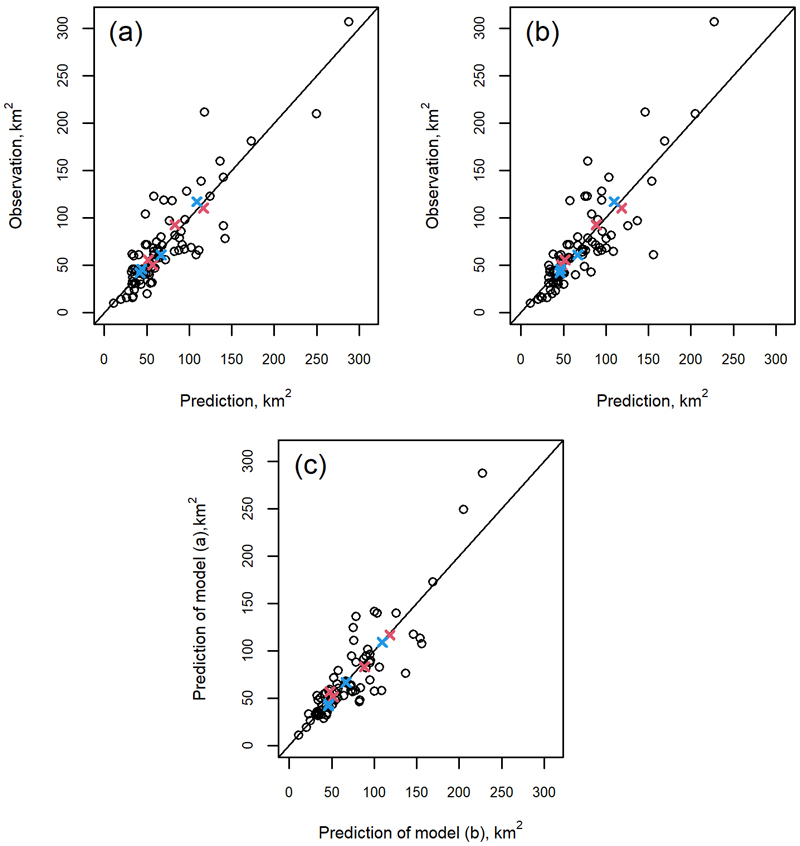
Fig. 3. Comparison of moose damage predicted using the observed moose population density and (a) the model of Nikula et al. (2021) or (b) the model developed in this study, against reference observations from the moose management areas, with (c) an intercomparison of the predictions of the two models. Red and blue crosses indicate the mean of the observations by the 10th and 11th National Forest Inventory (NFI), respectively, for the four geographical zones (Northern, Western, Eastern and Southern Finland) used as modeling units in the forest development simulations.
At the level of whole geographical zones used as modeling units for the development simulations, the predictions of both the model by Nikula et al. (2021) and the model developed here usually agreed well with the reference value (Fig. 4). This was particularly the case when predictions were made at the level of individual moose management areas, assuming that their forest characteristics and moose population statistics were available as predictors exactly as in the modeling data. However, in addition to the model itself, its intended use in the future forest simulation influenced the predictions, as using the observed values for an average moose management area within a geographical zone and scaling up caused a slight additional imprecision (see predicted and upscaled cases in Fig. 4). In addition, the predictions depended on the assumed moose population level, and the reference damage value always fell between the predictions obtained using population densities of 2–6 animals per 1000 ha, corresponding to later development simulations. Summing up the zone-specific figures (Fig. 4) for the whole country, the model of Nikula et al. (2021) and the model developed here showed an underestimation of 24 km2 and an overestimation of 41 km2, respectively. However, when the predictions were calculated as zone averages and a moose population of 4 animals per 1000 ha was assumed (the predicted and upscaled cases of Fig. 4), the overestimation by the latter model was 163 km2 at the level of the whole study area.
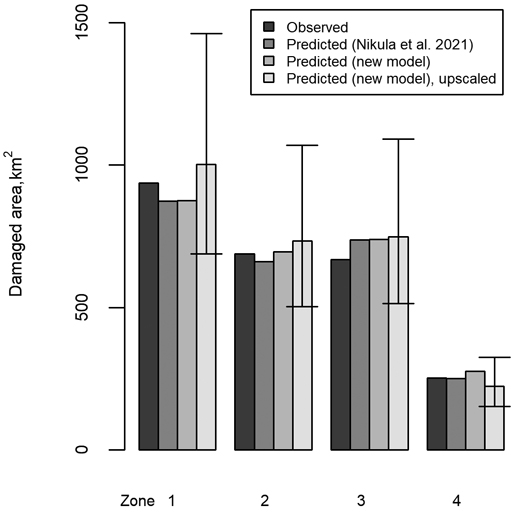
Fig. 4. Comparison of moose damage, when the observed and predicted damage are summed up for the geographical zones 1–4 (Northern, Western, Eastern and Southern Finland, respectively) from the individual moose management areas. The predictions of Nikula et al. (2021) and the model developed in this study are first shown with the values for the predictor variables extracted from the reference data. Then, in the upscaled case, the model developed for this study is used as in the case of the actual simulations, i.e., scaling up the prediction for an average-sized moose management area within a zone and assuming a fixed moose population of 4 animals per 1000 ha for the thick bars and 2 or 6 animals per 1000 ha for the lower and upper limits of the error bars, respectively.
3.2 Applying the model to the projected forest structures
The way in which the development stages evolved during the EFDM simulations indicated a varying reliability of the simulations for the future, as can be interpreted from Fig. 5 and Fig. 6. According to Fig. 5, the proportions of seedling and mature stands exceeded the range of the respective values in the training data after about 30 years (i.e., after the sixth 5-year period). Consequently, the model had to extrapolate after this time, which probably reduced the reliability of the predictions. Fig. 6 shows that the predicted damage for zones 1 and 2 (Northern and Western Finland) was fairly well within the range of the training data, although the proportions of the development stages were extrapolated more than for the other two zones. Zones 3 and 4 (Eastern and Southern Finland) were more sensitive to extrapolation due to the stronger zone-specific effects, which can already be observed from Fig. 2 and will be further explored in the Discussion.
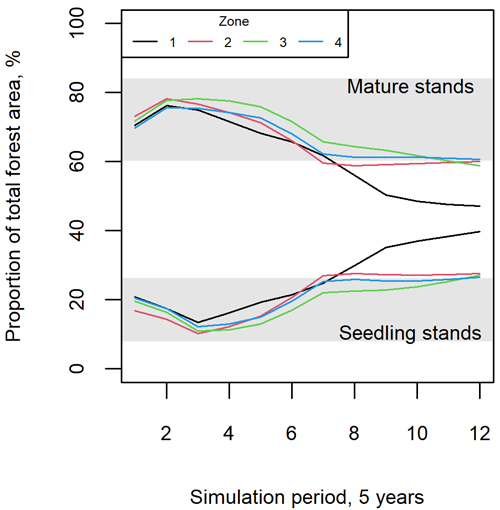
Fig. 5. Proportions of mature (upper lines and area) vs. seedling stands in the modeling data (grey area) and different simulation periods, when projecting the forest development with the European Forestry Dynamics Model (EFDM). Zones 1–4 correspond to Northern, Western, Eastern and Southern Finland, respectively.
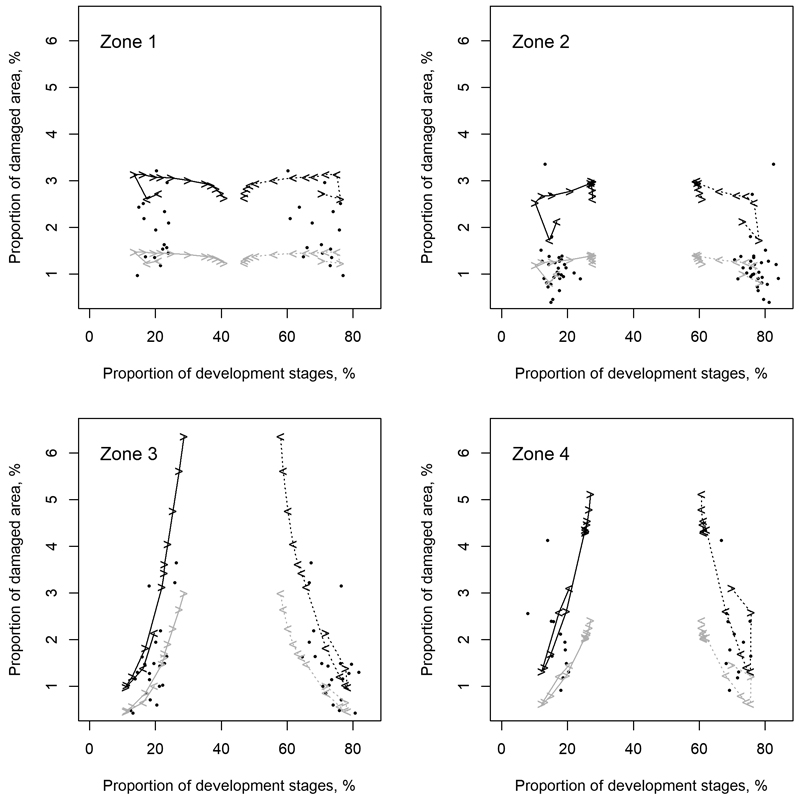
Fig. 6. Proportion of development stages (i.e., seedling and mature stands, x-axis) vs. the proportion of damaged area to the total forest area of the four geographical zones (numbers 1–4 indicated in the subfigures correspond to Northern, Western, Eastern, and Southern Finland, respectively). The dots and lines show the observations in the training data and the simulated forest development, respectively. Black and grey lines show simulation results based on 6 and 2 animals per 1000 ha, respectively. Solid and dashed lines show the proportion of seedling and mature stands in the simulations. The arrowheads on the lines indicate these proportions at each simulation step and the direction in which their simulated values evolved from that step.
The above results suggest that it is reasonable to consider only the first 30 years of the total simulated development (60 years in total) because of the extrapolation of predictor variables thereafter. During this time, the area of seedling stands damaged by moose was predicted to increase by up to a third compared to the last NFI observation, depending on the zone and moose density (Fig. 7). Fig. 7 shows the distribution of damaged seedling stand area and its evolution in the predictions for 5-year steps over the entire simulation horizon. It is important to note that some characteristics of this evolution can be related to the above model diagnostics, as discussed in Section 4.
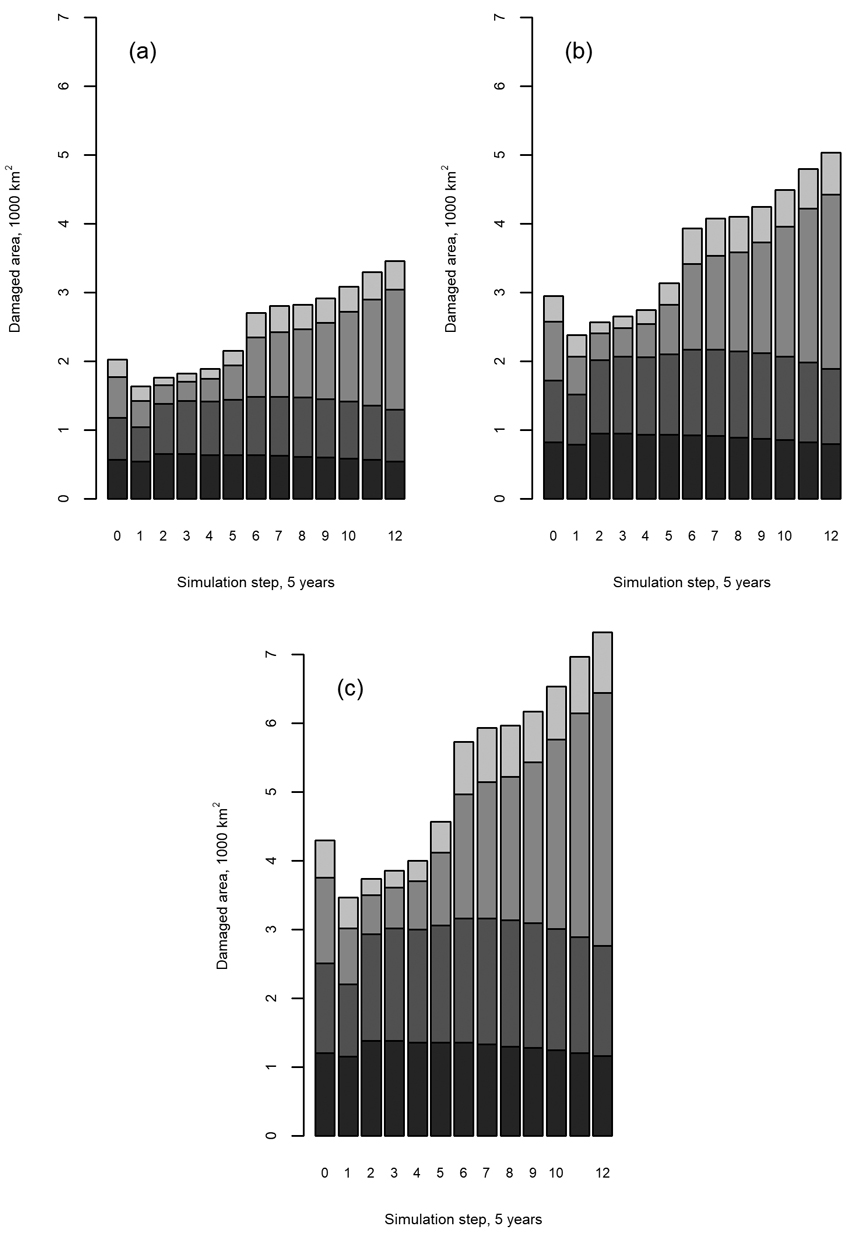
Fig. 7. Total continuous moose damage to seedling stands based on moose population sizes of (a) 2, (b) 4, or (c) 6 animals per 1000 ha. The shades of grey in each bar correspond, from bottom to up, to the geographical zones of Northern, Western, Eastern, and Southern Finland. Step 0 indicates the modeled initial state, i.e. the predicted damage to the forest area distribution observed by the 11th National Forest Inventory (NFI11) when the development stages are averaged for the four geographical zones and then used as predictors of the model (Eq. 1 and Table 1) with the different moose population densities. Steps 1–12 indicate the application of the model to future development stages simulated by the European Forestry Dynamics Model (EFDM).
4 Discussion
We modeled the area of seedling stands that received a moose damage that reduced the forest quality or production (Nikula et al. 2021). Due to this definition, our estimated moose damage on the forest area is smaller than studies that report even the slightest symptoms of moose damage (Nevalainen et al. 2016). The above results suggest that the developed model can be realistically applied to predict the susceptibility of the expected forest structures to moose damage, especially for the first 30 years, with respect to our modeling data and previous literature. These points are further discussed from the point of view of model validation and verification, as they affect the application of the developed moose extension.
Moose damage predicted by the developed model consists of an interaction between prevailing forest characteristics and moose population in different geographical areas. According to the model, a similar evolution of forest characteristics under a fixed moose population causes different levels of damage in different geographical areas (Fig. 2; see also justification for these differences in Section 2.2.). The inclusion of the geographical zone was therefore essential, but had implications for the application of the model. In particular, according to Fig. 2 and Fig. 6, the shift from mature to seedling stand structure increased the predicted damage at a much faster rate in Eastern and Southern Finland than in the other two other zones, at the same moose population density. The effects described in the paragraph above are evident when the model is applied with the age classes projected by the EFDM. The probabilities for the management activities were not geographically balanced, but the same probabilities were applied throughout the country, resulting in more intensive harvesting of forests in Northern Finland than in practice. While the shift from mature to seedling stands was most pronounced there (zone 1 in Fig. 5), the proportions of seedling and mature stands in all zones were outside the values in the training data after six simulation periods (30 years). Fig. 6 shows that even a small extrapolation of the forest structure resulted in considerably higher damage rates especially for zone 3 (Eastern Finland), whereas much higher extrapolations for zones 1 and 2 did not show similar effects. After the start of the model extrapolation (i.e., after six simulation periods or 30 years as identified above), the proportion of damage in the final moose damage predictions in Fig. 7 starts to increase much faster than in the earlier years, due to the propagation of the effects discussed above. Most of this increase can be attributed geographically to zone 3, as discussed above.
There are some peculiarities in the projections resulting from both the use of the model (Fig. 4) and the way forest resources are managed in the EFDM (Fig. 7). Fig. 4 shows a discrepancy due to the fact that the exact information content of the NFI11 cannot be used for individual moose management areas, but has to be averaged for the four geographical zones for which the forest resource projections are made. It could be circumvented by predicting forest resources for smaller regions using different principles than the NFI-based transition matrices, which on the other hand can be justified by the representative sample of transition probability observations for the projections collected by the NFI. The beginning of the full projection in Fig. 7 shows another discrepancy due to the prediction of the management actions and resulting forest resources by the EFDM. In step 1 and beyond, management actions are simulated according to their probabilities, which at the beginning of the simulations may not correspond to the actual managed areas as observed in the NFI data; however, this is a common problem of any simulation where the future management actions have to be allocated computationally.
These results emphasize the need for careful model validation and verification, which for future projections should emphasize causal reasoning between observations and predictions that may be in agreement by chance, even if there are semantic or logical problems affecting the use of the projections. Although the above results are based on the application of a model in a projection case, those can be used to discuss reasonable time spans for future forest projections. For instance, Nabuurs et al. (2000) suggested a maximum feasible time span of 50–60 years, based on a qualitative analysis of scenarios to 2050, but parameterized by forest inventory data to the 1990s. Vauhkonen et al. (2021) considered a time span of 30 years, but argued that uncertainties related to markets, climate and management could make a maximum feasible time span for realistic projections much shorter. Our results also support shorter projection periods.
The present work allows modeling of the area of seedling stands damaged by moose browsing, but further modeling of the consequences in the damaged area is also motivated. Previously, Nilsson et al. (2016) modelled the survival and height growth of trees in size categories after an experiment where Scots pine shoots were cut to mimic browsing, and simulated the development of surviving trees. They found small effects on wood production, but more pronounced economic effects already at a browsing level that affected only 2% of the trees. However, this was a stand-level study with potentially limited generalizability, whereas the framework presented here would allow the simulation of consequential effects for millions of hectares of forest. In practice, the use of the EFDM for this analysis requires the specification of transformation coefficients, which for (net) growth and quality reduction could possibly be modeled similarly to Nilsson et al. (2016) based on artificial shoot cutting experiments mimicking moose damage (Persson et al. 2005; Wallgren et al. 2014; Matala et al. 2020). Comprehensive analyses should consider other (consequential socio-)economic effects related to the risk of areal damage from moose such as reduced growth and timber assortment yield due to poor quality (Heikkilä and Löyttyniemi 1992; Wallgren et al. 2014; Matala et al. 2020). For example, to avoid economic losses due to moose damage, forest owners may regenerate forests with species that are not optimally suited to a site but are less susceptible to damage. The effects of these decisions on forest resources could be studied by varying activity and transition probabilities.
5 Conclusion
We augmented the European Forestry Dynamics Model (EFDM) to project the area of seedling stands damaged by moose browsing. Based on qualitative analyses of projections of Finnish NFI data and three alternative moose population sizes, we conclude that moose damage can be realistically projected for 30 years with the proposed model. Our work provides an example of the integration of damage models into large-scale forestry projection models, which is discussed from the point of view of model validation and verification, with implications for the application of the developed moose extension.
Declaration of openness of research materials, data, and code
Data are not available, because it was restricted by contract for the purposes of this study. Code can be made available by a reasonable request by e-mail to the first author.
Author’s contributions
J.V. carried out all numerical analyses and drafted the manuscript. J.M. and A.N. participated to the acquisition and interpretation of data and results and revising the manuscript. All authors participated to defining research question and design of the work and approved the final version to be published.
Acknowledgements
Data: National Forest Inventory, Natural Resources Institute Finland (Luke).
Funding
The authors received funding through the project “Future multipurpose forests and their disturbance risk in the changing climate (FOSTER)” within the “Catch the Carbon”-Initiative, funded by the Finnish Ministry of Agriculture and Forestry, project number: VN/28654/2020.
References
Adame P, Cañellas I, Moreno-Fernández D, Packalen T, Hernández L, Alberdi I (2020) Analyzing the joint effect of forest management and wildfires on living biomass and carbon stocks in Spanish forests. Forests 11, article id 1219. https://doi.org/10.3390/f11111219.
Bergqvist G, Bergström R, Wallgren M (2014) Recent browsing damage by moose on Scots pine, birch and aspen in young commercial forests – effects of forage availability, moose population density and site productivity. Silva Fenn 48, article id 1077. https://doi.org/10.14214/sf.1077.
Castro Rego F, Bunting SC, Strand EK, Godinho-Ferreira P (2019) Applied landscape ecology. Wiley. ISBN 978-1-119-36820-5.
De Jager NR, Drohan PJ, Miranda BM, Sturtevant BR, Stout SL, Royo AA, Gustafson EJ, Romanski MC (2017) Simulating ungulate herbivory across forest landscapes: a browsing extension for LANDIS-II. Ecol Mod 350: 11–29. https://doi.org/10.1016/j.ecolmodel.2017.01.014.
European Commission (2016) European Forestry Dynamics Model (EFDM). EU Science Hub, The European Commission’s science and knowledge service repository. https://ec.europa.eu/jrc/en/european-forestry-dynamics-model. Accessed 6 January 2022.
Gill RMA (1992) A review of damage by mammals in north temperate forest: 3. Impact on trees and forests. Forestry 65: 363–388. https://doi.org/10.1093/forestry/65.4.363-a.
Heikkilä R, Löyttyniemi K (1992) Growth response of young Scots pines to artificial shoot breaking simulating moose damage. Silva Fenn 26: 19–26. https://doi.org/10.14214/sf.a15627.
Hörnberg S (2001a) Changes in population density of moose (Alces alces) and damage to forests in Sweden. For Ecol Manage 149: 141–151. https://doi.org/10.1016/S0378-1127(00)00551-X.
Hörnberg S (2001b) The relationship between moose (Alces alces) browsing utilisation and the occurrence of different forage species in Sweden. For Ecol Manage 149: 91–102. https://doi.org/10.1016/S0378-1127(00)00547-8.
Kielland K, Bryant JP (1998) Moose herbivory in taiga: effects on biochemistry and vegetation dynamics in primary succession. Oikos 82: 377–383. https://doi.org/10.2307/3546979.
Korhonen KT (2016) Finland. In: Vidal C, Alberdi IA, Hernández Mateo L, Redmond JJ (eds) National Forest Inventories – assessment of wood availability and use. Springer, Cham, pp 369–384. https://doi.org/10.1007/978-3-319-44015-6_19.
Korhonen KT, Ihalainen A, Viiri H, Heikkinen J, Hotanen JP, Mäkelä H, Nevalainen S, Pitkänen J (2013) Suomen metsät 2004–2008 ja niiden kehitys 1921–2008. [Forests of Finland 2004–2008 and their development in 1921–2008]. Metsätieteen Aikakauskirja 3/2013: 269–608. https://doi.org/10.14214/ma.6025.
Korhonen KT, Ihalainen A, Ahola A, Heikkinen J, Henttonen HM, Hotanen JP, Nevalainen S, Pitkänen J, Strandström M, Viiri H (2017) Suomen metsät 2009–2013 ja niiden kehitys 1921–2013. [Forests of Finland 2008–2013 and their development in 1921–2013]. Luonnonvara- ja biotalouden tutkimus 59/2017. http://urn.fi/URN:ISBN:978-952-326-467-0.
Lavsund S, Nygrén T, Solberg EJ (2003) Status of moose populations and challenges to moose management in Fennoscandia. Alces 39: 109–130.
Liénard JF, Strigul NS (2016) Modelling of hardwood forest in Quebec under dynamic disturbance regimes: a time-inhomogeneous Markov chain approach. J Ecol 104: 806–816. https://doi.org/10.1111/1365-2745.12540.
Markgren G (1974) The moose in Fennoscandia. Nat Can 101: 185–194.
Matala J, Kilpeläinen H, Heräjärvi H, Wall T, Verkasalo E (2020) Sawlog quality and tree dimensions of Scots pine 34 years after artificial moose browsing damage. Silva Fenn 54, article id 10389. https://doi.org/10.14214/sf.10389.
Nabuurs GJ, Schelhaas MJ, Pussinen A (2000) Validation of the European Forest Information Scenario Model (EFISCEN) and a projection of Finnish forests. Silva Fenn 34: 167–179. https://doi.org/10.14214/sf.638.
Nevalainen S, Matala J, Korhonen KT, Ihalainen A, Nikula A (2016) Moose damage in National Forest Inventories (1986–2008) in Finland. Silva Fenn 50, article id 1410. https://doi.org/10.14214/sf.1410.
Nikula A, Nivala V, Matala J, Heliövaara K (2019) Modelling the effect of habitat composition and roads on the occurrence and number of moose damage at multiple scales. Silva Fenn 53, article id 9918. https://doi.org/10.14214/sf.9918.
Nikula A, Matala J, Hallikainen V, Pusenius J, Ihalainen A, Kukko T, Korhonen KT (2021) Modelling the effect of moose Alces alces population density and regional forest structure on the amount of damage in forest seedling stands. Pest Manage Sci 77: 620–627. https://doi.org/10.1002/ps.6081.
Nilsson U, Berglund M, Bergquist J, Holmström H, Wallgren M (2016) Simulated effects of browsing on the production and economic values of Scots pine (Pinus sylvestris) stands. Scand J For Res 31: 279–285. https://doi.org/10.1080/02827581.2015.1099728.
Packalen T, Sallnäs O, Sirkiä S, Korhonen K, Salminen O, Vidal C, Robert N, Colin A, Belouard T, Schadauer K, Berger A, Rego A, Louro G, Camia A, Räty M, San-Miguel J (2014) The European Forestry Dynamics Model: concept, design and results of first case studies. JRC Science and Policy Reports Volume 93450, EUR 27004, Publications Office of the European Union, Luxembourg. https://doi.org/10.2788/153990.
Persson IL, Danell K, Bergström R (2005) Different moose densities and accompanied changes in tree morphology and browse production. Ecol Appl 15: 1296–1305. https://doi.org/10.1890/04-0499.
Pinheiro J, Bates D, DebRoy S, Sarkar D, R Core Team (2021) nlme: linear and nonlinear mixed effects models R package version 3.1-152. https://CRAN.R-project.org/package=nlme. Accessed 6 January 2022
Pretzsch H (2009) Forest dynamics, growth and yield – from measurement to model. Springer-Verlag, Berlin Heidelberg. https://doi.org/10.1007/978-3-540-88307-4.
Ray D, Petr M, Mullett M, Bathgate S, Marchi M, Beauchamp K (2019) A simulation-based approach to assess forest policy options under biotic and abiotic climate change impacts: a case study on Scotland’s National Forest Estate. For Pol Econ 103: 17–27. https://doi.org/10.1016/j.forpol.2017.10.010.
Reyer CPO, Bathgate S, Blennow K, Borges JG, Bugmann H, Delzon S, Faias SP, Garcia-Gonzalo J, Gardiner G, Gonzalez-Olabarria JR, Gracia C, Guerra Hernández J, Kellomäki S, Kramer K, Lexer MJ, Lindner M, van der Maaten E, Maroschek M, Muys B, Nicoll B, Palahi M, Palma JHN, Paulo JA, Peltola H, Pukkala T, Rammer W, Ray D, Sabaté S, Schelhaas MJ, Seidl R, Temperli C, Tomé M, Yousefpour R, Zimmermann NE, Hanewinkel M (2017) Are forest disturbances amplifying or canceling out climate change-induced productivity changes in European forests? Env Res Lett 12, article id 034027. https://doi.org/10.1088/1748-9326/aa5ef1.
Sallnäs O, Berger A, Räty M, Trubins R (2015) An area-based matrix model for uneven-aged forests. Forests 6: 1500–1515. https://doi.org/10.3390/f6051500.
Seidl R, Thom D, Kautz M, Martin-Benito D, Peltoniemi M, Vacchiano G, Wild J, Ascoli D, Peter M, Honkaniemi J, Lexer MJ, Trotsiuk V, Mairota P, Svoboda M, Fabrika M, Nagel TA, Reyer CPO (2017) Forest disturbances under climate change. Nat Clim Change 7: 395–402. https://doi.org/10.1038/nclimate3303.
Snowdon P (1991) A ratio estimator for bias correction in logarithmic regressions. Can J For Res 21: 720–724. https://doi.org/10.1139/x91-101.
Vauhkonen J, Packalen T (2018) Uncertainties related to climate change and forest management with implications on climate regulation in Finland. Ecosyst Serv 33: 213–224. https://doi.org/10.1016/j.ecoser.2018.02.011.
Vauhkonen J, Packalen T (2019) Shifting from even-aged management to less intensive forestry in varying proportions of forest land in Finland – impacts on carbon storage, harvest removals, and harvesting costs. Eur J For Res 138: 219–238. https://doi.org/10.1007/s10342-019-01163-9.
Vauhkonen J, Berger A, Gschwantner T, Schadauer K, Lejeune P, Perin J, Pitchugin M, Adolt R, Zeman M, Johannsen VK, Kepfer-Rojas S, Sims A, Bastick C, Morneau F, Colin A, Bender S, Kovácsevics P, Solti G, Kolozs L, Nagy D, Nagy K, Twomey M, Redmond J, Gasparini P, Notarangelo M, Rizzo M, Makovskis K, Lazdins A, Lupikis A, Kulbokas G, Antón-Fernández C, Castro Rego F, Nunes L, Marin G, Calota C, Pantić D, Borota D, Roessiger J, Bosela M, Šebeň V, Skudnik M, Adame P, Alberdi I, Cañellas I, Lind T, Trubins R, Thürig E, Stadelmann G, Ditchburn B, Ross D, Gilbert J, Halsall L, Lier M, Packalen T (2019) Harmonised projections of future forest resources in Europe. Ann For Sci 76, article id 79. https://doi.org/10.1007/s13595-019-0863-6.
Vauhkonen J, Mutanen A, Packalen T, Asikainen A (2021) Initial forest age distribution may generate computational sinks or sources of carbon: a generic approach to test assumptions underlying the EU LULUCF forest reference levels. Carbon Balance Manage 16, article id 13. https://doi.org/10.1186/s13021-021-00177-4.
Venäläinen A, Lehtonen I, Laapas M, Ruosteenoja K, Tikkanen OP, Viiri H, Ikonen VP, Peltola H (2020) Climate change induces multiple risks to boreal forests and forestry in Finland: a literature review. Glob Change Biol 26: 4178–4196. https://doi.org/10.1111/gcb.15183.
Wallgren M, Bergquist J, Bergström R, Eriksson S (2014) Effects of timing, duration, and intensity of simulated browsing on Scots pine growth and stem quality. Scand J For Res 29: 734–746. https://doi.org/10.1080/02827581.2014.960896.
Total of 37 references.
