Karri Uotila  ,
Timo Saksa,
Juho Rantala,
Nuutti Kiljunen
,
Timo Saksa,
Juho Rantala,
Nuutti Kiljunen
Labour consumption models applied to motor-manual pre-commercial thinning in Finland
Uotila K., Saksa T., Rantala J., Kiljunen N. (2014). Labour consumption models applied to motor-manual pre-commercial thinning in Finland. Silva Fennica vol. 48 no. 2 article id 982. https://doi.org/10.14214/sf.982
Highlights
- When a young stand grows and gets older, the work time needed to make pre-commercial thinning increases. The stands of Norway spruce (Picea abies (L.) Karst.), Scots pine (Pinus sylvestris L.) and hardwoods (Betula spp.) required an additional 8.2%, 5.2%, and 3.3% work-time per year, respectively.
Abstract
Labour models were developed to estimate the time required to Pre-Commercially Thin (PCT) with a clearing saw 4- to 20-year-old stands of the main commercial tree species in Finland. Labour (i.e., work-time consumption) was estimated from the density and stem diameter of the removal of 448 stands via an existing work productivity function. The removal based estimator attained was used as the basis for a priori mixed linear regression models. The main finding was that when a young stand grows and gets older, the work time needed to make a PCT increases. The stands of Norway spruce (Picea abies (L.) Karst.), Scots pine (Pinus sylvestris L.) and hardwoods (Betula spp.) required an additional 8.2%, 5.2%, and 3.3% work-time per year, respectively. Site fertility also played a role in that the most fertile site (mesic OMT) had an estimated labour requirement 114% higher than that for dryish VT. We also note that, per unit area, small stands require less labour than large ones and soil preparation method had a minor effect on the labour estimate. The stands which had previously gone through PCT were separately analysed. In those stands, the only significant variable concerning the labour estimate was age. The a priori models described here can help foresters to develop economic management programmes and issue quotes for forestry services.
Keywords
productivity;
pre-commercial thinning;
forest vegetation management;
early cleaning;
release treatment;
mixed linear regression
-
Uotila,
Finnish Forest Research Institute, Juntintie 154, FI-77600 Suonenjoki, Finland
E-mail
karri.uotila@metla.fi
- Saksa, Finnish Forest Research Institute, Juntintie 154, FI-77600 Suonenjoki, Finland E-mail timo.saksa@metla.fi
- Rantala, Metsä Group, Lielahdenkatu 10, FI-33400 Tampere, Finland E-mail juho.rantala@metsagroup.com
- Kiljunen, Metsähallitus, Asemakatu 7, FI-70107 Kuopio, Finland E-mail nuutti.kiljunen@metsa.fi
Received 20 August 2013 Accepted 26 February 2014 Published 6 March 2014
Views 141445
Available at https://doi.org/10.14214/sf.982 | Download PDF

1 Introduction
Pre-Commercial Thinning (PCT) is considered an important task in boreal forestry because forest vegetation can compete vigorously with crop trees on unmanaged stands (Bell 2011). In the context of this study, PCT means young stand management operations in which hardwoods are removed and stands are thinned to their optimal density motor-manually with a clearing saw.
It is well known that removing hardwoods and other competing vegetation from young stands increases the growth of the released trees and enhances the eventual crop of commercial timber (Walfridsson 1976; Nilsson and Örlander 1999; Comeau et al. 2000; Jobidon 2000; Siipilehto 2001; Hytönen and Jylhä 2008; Fu et al. 2008; Boateng et al. 2009). However, in practice hardwoods are often removed too late to gain the most benefit from it (Uotila et al. 2012; Uotila and Saksa 2013).
In Finland, the real-valued per hectare cost of PCT has doubled since the middle of the 1990s (Finnish Statistical… 2011). Unfortunately, the quality and proportion of well-managed stands does not reflect the trend in higher management costs and may actually have declined during the same period. According to the recent National Forest Inventory (NFI10), the proportion of good quality young stands has fallen from 39% to 30% since that last inventory (NFI9: Korhonen et al. 2010). One reason for the increased costs can be related to the point at which treatment is applied during the lifespan of a stand. A clear understanding of how costs of PCT relate to stand development and forest regeneration could lead to improved management programs and more profitable forestry.
The main management cost in motor-manual PCT is labour because expensive utilities, tools or materials are not required. Furthermore, the labour spent on a worksite depends largely on the density and size of trees to be removed (Hämäläinen and Kaila 1983; Kaila et al. 1999; Ligné et al. 2005; Kaila et al. 2006; LeBel and Dubeau 2007). Because unwanted trees continue to grow after a stand is established, the cost of a PCT increases with time. According to Kaila et al. (2006), a two-year delay can increase the cost by 8–42%. A longer delay easily doubles the cost of PCT of a stand.
Forest owners generally know the benefits of PCT rather well. However, relationship between labour consumption of PCT and stand age, and high variation of labour consumption between worksites are not that well known. Even though variation of cost largely depends on site conditions, forest owner’s perception of costs of laborious worksite can cause argue with a forest service provider. This can lead to forest owner’s unwillingness to order PCT. Therefore, it seems important to investigate the relationship of forest registry data and PCT payment basis. Forest owner should have a tool to analyse the time when PCT should typically be affordable, whereas service provider should be able to show which kind of sites are typically expensive to manage.
Forest owners and managers often require a cost estimate, or quote, prior to any work being performed by a third party. The cost of PCT is easy to calculate retrospectively, or it can be estimated, for an example, with a removal-based labour model (Kaila et al. 2006) used to determine worksite difficulty. However, quotes are labour consuming to generate if an employer has to measure the removal of a stand (Saksa and Kankaanhuhta 2007) and competing service providers must repeat the task independently. An objective decision-making tool to estimate PCT costs could make the management of sapling stands easier, more profitable and prevent the unnecessary duplication of effort made by service providers. Quotes generated by forest service providers could be similar with the insurance industry, i.e., an initial fee is agreed and paid by the client while the service provider faces uncertain future costs (Kliger and Levikson 1998).
Understanding how costs are inter-related and affected by local circumstances is also important to those making decisions across a broad landscape, e.g., governmental agencies. Cost-effective and robust management strategies can only be developed if costs can be related to stand age and the timing of treatments within a variable environment. Although these factors and their relationships have yet to be focus of a rigorous investigation, Opio et al. (2009) presented a protocol to help determine the number of times a stand requires treatment and a few studies have compared cost efficiency (Bell et al. 1997; Saksa and Miina 2010) and profitability of various release treatment techniques (Homagain et al. 2011a; Homagain et al. 2011b). However, more information is still needed.
In this study, an empirical a priori model will be constructed to estimate the labour required to PCT young stands of Norway spruce (Picea abies (L.) Karst.), Scots pine (Pinus sylvestris L.), and hardwoods consisting mainly of silver birch (Betula pendula Roth) and downy birch (Betula pubescens Ehrh.) without going in to the forest.
2 Material and methods
2.1 Study material
A sample of 448 stands ≤ 20 years old and with a weighted mean diameter at breast height < 8 cm were measured in 2005–2006 (Tables 1 and 2). Sample stands were located in Pohjois-Savo in Central Finland between 62°40´N and 64°00´N, and 26°50´E and 28°50´E. The sample was measured by personnel of The Finnish Forest Centre during their inspections of young stand management standards established by the Act on the Financing of Sustainable Forestry (1094/1996). Thus, all stands were privately-owned young forests recently obliged to conform with a management protocol. According to the Act, recommended heights and stand densities after treatment are 4–5 m and 1800 ha–1 for spruce, 5–8 m and 1800–2000 ha–1 for pine, and 5–8 m and 2000 ha–1 for birch, and the stands should consists of commercially valuable species and have no evident threat from other forest vegetation after the release treatment. The selected stands were a random sample from the above mentioned category.
| Table 1. Classification and site characteristics of the sample stands (PCT = Pre-Commercial Thinning, OMT = Oxalis-Myrtillus type, MT = Myrtillus type, VT = Vaccinium type). | ||||||
| Attribute | No previous PCT done | PCT has been previously done | ||||
| Pine | Spruce | Hardwood | Pine | Spruce | Hardwood | |
| Regeneration method | ||||||
| Planting | 30 | 176 | 31 | 19 | 46 | 13 |
| Sowing or natural regeneration | 34 | 16 | 14 | 15 | 15 | 14 |
| Undefined | 6 | 6 | 6 | 1 | 4 | 2 |
| Site type | ||||||
| OMT | 0 | 67 | 11 | 0 | 11 | 7 |
| MT | 38 | 118 | 40 | 17 | 48 | 22 |
| VT | 32 | 13 | 0 | 18 | 6 | 0 |
| Soil texture | ||||||
| Mineral soil | 66 | 189 | 46 | 28 | 63 | 25 |
| Peatland | 4 | 9 | 5 | 7 | 2 | 4 |
| Soil preparation method | ||||||
| Continuous trace | 27 | 104 | 26 | 15 | 27 | 18 |
| Ploughing | 7 | 25 | 3 | 0 | 5 | 1 |
| Disc-trenching | 20 | 79 | 23 | 15 | 22 | 17 |
| Spots | 27 | 85 | 19 | 15 | 27 | 4 |
| Mounding with ditching | 11 | 41 | 6 | 10 | 14 | 3 |
| Spot- or invert mounding | 2 | 17 | 5 | 2 | 6 | 0 |
| Patching | 14 | 27 | 8 | 3 | 7 | 1 |
| Not prepared | 16 | 9 | 6 | 5 | 11 | 7 |
| Total | 70 | 198 | 51 | 35 | 65 | 29 |
| Table 2. Characteristics of the sample stands treated as continuous variables (PCT = Pre-Commercial Thinning). | |||||||
| Dataset | General stand characteristics | Young stand management | |||||
| Area, ha | Stand age, years | Density, trees ha–1 | Height, m | Removal, stumps ha–1 | Stump diameter, cm | Labour consumption, days ha–1 | |
| No previous PCT done | |||||||
| Scots pine (N 70) | |||||||
| Mean | 2.1 | 12.1 | 2231 | 4.2 | 12 308 | 2.5 | 1.6 |
| SD | 1.8 | 3.9 | 538 | 1.9 | 8204 | 1.1 | 1.3 |
| Min | 0.3 | 6.0 | 960 | 1.4 | 1400 | 0.7 | 0.4 |
| Max | 9 | 20.0 | 3840 | 9.0 | 39 800 | 7.3 | 8.9 |
| Norway spruce (N 198) | |||||||
| Mean | 2.4 | 10.7 | 2019 | 3.2 | 13 877 | 2.8 | 2.0 |
| SD | 2.0 | 3.2 | 495 | 1.2 | 7959 | 1.1 | 1.4 |
| Min | 0.2 | 4.0 | 1000 | 1.1 | 2000 | 0.7 | 0.4 |
| Max | 11.9 | 20.0 | 5520 | 7.1 | 58 400 | 6.5 | 9.6 |
| Hardwood (N 51) | |||||||
| Mean | 1.6 | 11.1 | 1973 | 5.2 | 12 682 | 2.4 | 1.5 |
| SD | 1.2 | 3.6 | 491 | 1.5 | 8386 | 0.8 | 0.8 |
| Min | 0.2 | 6.0 | 1200 | 3.1 | 1000 | 0.6 | 0.4 |
| Max | 5.4 | 20.0 | 3240 | 9.8 | 46 200 | 4.2 | 4.2 |
| PCT has been previously done | |||||||
| Scots pine (N 35) | |||||||
| Mean | 2.0 | 13.6 | 2402 | 4.7 | 11 091 | 2.1 | 1.2 |
| SD | 1.5 | 3.2 | 551 | 1.4 | 5032 | 0.6 | 0.4 |
| Min | 0.3 | 8.0 | 960 | 2.4 | 5200 | 1.0 | 0.6 |
| Max | 6.1 | 20.0 | 3440 | 7.1 | 32 200 | 3.5 | 2.4 |
| Norway spruce (N 65) | |||||||
| Mean | 1.7 | 11.9 | 2250 | 4.3 | 11 465 | 2.3 | 1.3 |
| SD | 1.2 | 3.3 | 636 | 1.6 | 6646 | 0.8 | 0.6 |
| Min | 0.2 | 7.0 | 1080 | 1.7 | 1800 | 1.2 | 0.4 |
| Max | 5.2 | 20.0 | 4280 | 9.0 | 45 200 | 6.2 | 3.9 |
| Hardwood (N 29) | |||||||
| Mean | 1.7 | 13.3 | 2167 | 6.8 | 10 766 | 2.3 | 1.2 |
| SD | 1.7 | 3.0 | 591 | 2.0 | 4490 | 0.6 | 0.4 |
| Min | 0.1 | 8.0 | 1200 | 2.2 | 3200 | 1.3 | 0.5 |
| Max | 6.7 | 20.0 | 3320 | 10.2 | 23 600 | 3.3 | 2.0 |
The dominant tree species of each stand was the species the stand had been regenerated to. Previously made PCT was evaluated by searching for signs such as older debris and stumps. Under this scheme, 319 stands showed no signs of earlier PCT and were categorized as “no previous PCT” while 129 contained obvious stumps and debris and were categorized as “PCT previously done”.
The inventory method was a transect survey with circular sample plots. The transect was established on the longest possible diagonal of a stand. Five experimental plot midpoints were established at 10%, 30%, 50%, 70% and 90% of the transect length. On complex stands, the transect was turned 90 degrees at an appropriate point if it was considered necessary in order for the transect to cover a larger area of the stand. Inappropriate plot locations (e.g., large trees or wetlands) were extended 5 m until they were filled with young trees. Depending on the information collected, two kinds of circular sample plots were established per midpoint and are detailed below.
Crop trees in the main plots (50 m2: r 3.99 m) were tallied by species and their heights were estimated and used to generate a mean to the nearest 0.5 m. Soil was classified as mineral soil or peatland, and site fertility was recorded according to Cajander’s (1926) site type classification as Oxalis–Myrtillus type (OMT), Myrtillus type (MT), Vaccinium type (VT), or their peatland equivalents. Soil preparation and regeneration methods were inferred by observing the alignment and distance among crop trees and the soil around their bases (e.g., patch, mound or trench). Stand age was determined from annual growth increments of crop trees and stand areas were provided by The Finnish Forest Centre.
Trees that were not crop trees were considered as removal. Trees in removal were tallied from subplots. Subplots (10 m2: r = 1.78 m) were smaller than the main plots but were located at the same midpoint. Diameters were measured of 3—5 stumps nearest to the plot midpoint. The maximum diameter of cut stumps was restricted to 10 cm.
2.2 Calculation of labour consumption (LC)
This study employs existing theory to determine the utility and accuracy of a priori labour estimation models within the context of PCT. The labour consumed by PCT was estimated according to the model of Kaila et al. (2006, Eq. 3) which relies on the density and stump diameter of removed trees, and has been used to construct the wage tables for silvicultural operations and manual felling in Finland. The function is based on the results of work studies by Hämäläinen and Kaila (1983). Productivity functions of labour consumption are recognized as an appropriate method of studying stand management cost-efficiency (Kaila et al., 2006).
Labour consumption was calculated separately for each plot and restricted to a maximum of 15 days ha–1 to avoid high-leverage outliers caused by sampling or data entry errors. The replacement was considered necessary as sampling made excessively high values possible. However, only 9 extreme values from the total of 3 290 plots were replaced. The estimated variable is referred to as calculated LC so as not to confuse it with estimates provided by the statistical analyses.
2.3 Data analysis
Mixed linear regression models were constructed separately for stands without previous PCT (LCNPCT) and for those with previous PCT (LCPCT). The data were analysed using SPSS 16.0 (SPSS Base 16.0 User’s Guide 2007). Labour Consumption of PCT (LC), calculated according to Kaila et al. (2006), was the dependent variable in both models. Logarithmic transformations of the dependent variables were used because of their heteroscedasticity and positive skew.
The independent variables tested were dominant tree species, site type, regeneration method, soil preparation method, and area and age of the stand (Tables 1 and 2). In the final analysis, soil preparation methods “ploughing” and “disc trenching” were combined as “continuous trace” and the other methods as “spot”. Also, site type OMT was combined with MT for Scots pine stands and VT with MT in hardwood stands. The combined categories had only a few observations and they were not significantly different. Independent variables were included in the models if a log-likelihood test indicated significant improvements due to the independent variable included. The base model was:
![]()
where LCij is labour consumption of PCT on plot i (i = 1,..,k.) on stand j (j = 1,…, n.), µ is a fixed intercept parameter, X and a represent independent variables and their fixed effect parameters, and uj and eij are stand and plot level error terms.
The final model predicts LC on a logarithmic scale. If the models are applied in practice Ln(LC) must be transformed to the original scale. However, transformation of a log-transformed model introduces a bias. Back-transformed and bias-corrected values can be calculated using the following equation based on Pokharel and Dech (2012):

where ![]() is the expected back-transformed value of
is the expected back-transformed value of ![]() and Var(uj) and Var(eij) are the stand and plot level variances for
and Var(uj) and Var(eij) are the stand and plot level variances for ![]() , respectively.
, respectively.
Technically, the modelling approach compares effectiveness of a priori estimation (without measurements) of labour consumption to a removal based estimation method, in which the labour consumption is calculated according to the measured removal. Potential biases or errors of the original model of Kaila et al. (2006) were not taken into account.
Similar models were constructed for stump diameter and density of the removed trees for stands without previous PCT. These two models illustrate the effects of removal of PCT on the variables included in the labour consumption model. The modelling procedure followed the description above (Eq. 1), but without the logarithmic transformation of the dependent variables.
3 Results
3.1 LC models for PCT
Stand age, site type, dominant tree species, soil preparation and area affected LC in stands without previous PCT (Table 3). The model is presented in Table 4. Most of the variables that were significant on stands without previous PCT were not so on stands with previous PCT (Table 5). The only significant variable was stand age. Regeneration method was not significant in either of the models.
| Table 3. Fixed effects of the mixed linear regression model for Labour Consumption of Pre-Commercial Thinning (PCT) on stands without previous PCT. The dependent variable is Ln(LCNPCT) and all denominators had 308 df. | |||
| Source | Numerator df | F | Sig. |
| Intercept | 1 | 26.116 | 0.000 |
| Dominant tree species | 2 | 2.053 | 0.130 |
| Stand age | 1 | 41.735 | 0.000 |
| Stand age * Main tree species | 2 | 3.066 | 0.048 |
| Site type | 2 | 25.845 | 0.000 |
| Soil preparation method | 2 | 9.955 | 0.000 |
| Ln(Area) | 1 | 15.349 | 0.000 |
| Table 4. Mixed linear regression model for Labour Consumption of Pre-Commercial Thinning (PCT) on stands without previous PCT. The dependent variable is Ln(LCNPCT) in days ha–1, the random stand and plot level effects are uj (Var = 0.379^2) and eij (Var = 0.542^2), all variables had 308 df, and the model fit is 47.6%. OMT = Oxalis-Myrtillus type, MT = Myrtillus type, VT = Vaccinium type. | ||||||
| Parameter | Estimate | Std. error | t | Sig. | 95% confidence interval | |
| Lower bound | Upper bound | |||||
| Intercept | –0.9762 | 0.2300 | –4.245 | 0.0000 | –1.4288 | –0.5237 |
| Dominant tree species (Ref. Hardwood) | ||||||
| Scots pine | 0.0140 | 0.2794 | 0.050 | 0.9600 | –0.5357 | 0.5638 |
| Norway spruce | –0.3550 | 0.2389 | –1.486 | 0.1384 | –0.8251 | 0.1152 |
| Stand age | 0.0321 | 0.0179 | 1.797 | 0.0733 | –0.0031 | 0.0673 |
| Stand age * Scots pine | 0.0184 | 0.0227 | 0.809 | 0.4189 | –0.0263 | 0.0630 |
| Stand age * Norway spruce | 0.0471 | 0.0208 | 2.267 | 0.0241 | 0.0062 | 0.0880 |
| Stand age * Hardwoods | 0.0000 | 0.0000 | ||||
| Site type (Ref. VT) | ||||||
| OMT | 0.7613 | 0.1059 | 7.189 | 0.0000 | 0.5529 | 0.9696 |
| MT | 0.5059 | 0.0885 | 5.719 | 0.0000 | 0.3318 | 0.6799 |
| Soil preparation method (Ref. not prepared) | ||||||
| Continuous trace | 0.1067 | 0.0965 | 1.106 | 0.2697 | –0.0831 | 0.2965 |
| Spots | 0.3163 | 0.0967 | 3.271 | 0.0012 | 0.1260 | 0.5066 |
| Ln(Area), ha | 0.1359 | 0.0347 | 3.918 | 0.0001 | 0.0677 | 0.2042 |
| Variance components [Stand (uj), Plot (eij)] | ||||||
| Var(uj) | 0.1436 | 0.0165 | 0.000 | 0.2715 | 0.3171 | |
| Var(eij) | 0.2934 | 0.0116 | 0.000 | 0.1147 | 0.1797 | |
| Table 5. Mixed linear regression model for Labour Consumption of Pre-Commercial Thinning (PCT) on stands with previous PCT. The dependent variable is Ln(LCPCT) in days ha–1, and the random stand and plot level effects are uj (Var = 0.265^2) and eij (Var = 0.504^2), and the model fit is 6.7%. | |||||||
| Parameter | Estimate | Std. error | df | t | Sig. | 95% confidence interval | |
| Lower bound | Upper bound | ||||||
| Intercept | –0.2905 | 0.0942 | 207 | –3.085 | 0.002 | –0.476 | –0.105 |
| Stand age, years | 0.0249 | 0.0071 | 207 | 3.495 | 0.001 | 0.011 | 0.039 |
| Variance components [Stand (uj), Plot (eij)] | |||||||
| Var(uj) | 0.0706 | 0.0122 | 0.000 | 0.050 | 0.099 | ||
| Var(eij) | 0.2539 | 0.0124 | 0.000 | 0.237 | 0.287 | ||
Model fit was explored by comparing stand level variances with and without fixed effects. Fixed effects accounted for 47.6% of the variance at stand level in stands without previous PCT and 6.7% in stands with previous PCT. Plot level variances remained the same in random effects models because all the fixed effects were stand level variables.
Stand age had a large impact on estimated LC. On Norway spruce stands in particular, the rate of increase in LC per year was 8.2% (Fig. 1). Such a rate translates to LC effectively doubling in nine years. The estimated annual increase was a moderate 5.2% in Scots pine stands, and 3.3% in hardwood stands. However, the effect of tree species was also significant between spruce and pine stands, why the estimated initial LC was lower for spruce (Table 4). Labour time increased with stand age mostly because of the growth of stump diameter of removal, density of the trees to be removed did not vary much with age (Tables 6 and 7).
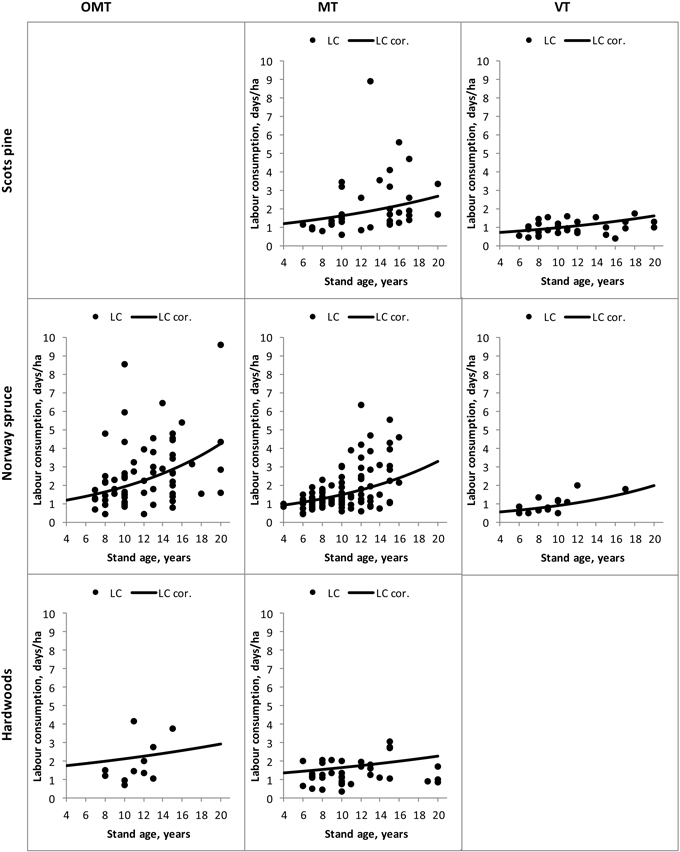
Fig. 1. The back-transformed and bias-corrected a priori estimates (LC cor.), and the calculated values (LC) of labour consumption of Pre-Cmmercial Thinning (PCT) according to site type (OMT = Oxalis-Myrtillus type, MT = Myrtillus type, VT = Vaccinium type), stand age, and removal in Scots pine, Norway spruce, and hardwood stands which have no previous PCT done. In the estimates, variables “area” and “soil preparation” were set to “2.2 ha” and “Continuous trace”, respectively.
| Table 6. Mixed linear regression model for stump diameter of the removed trees on stands which have not been previously pre-commercially thinned. The dependent variable is stump diameter in cm, the random stand and plot level effects are uj (Var = 0.674^2) and eij (Var = 1.110^2), all variables had 308 df, and the model fit is 45.6%. OMT = Oxalis-Myrtillus type, MT = Myrtillus type, VT = Vaccinium type. | ||||||
| Parameter | Estimate | Std. error | t | Sig. | 95% confidence interval | |
| Lower bound | Upper bound | |||||
| Intercept | 0.3356 | 0.4279 | 0.784 | 0.433 | –0.5063 | 1.1776 |
| Dominant tree species (Ref. Hardwood) | ||||||
| Scots pine | 0.5988 | 0.5198 | 1.1520 | 0.250 | –0.4240 | 1.6215 |
| Norway spruce | –0.1462 | 0.4446 | –0.329 | 0.742 | –1.0210 | 0.7285 |
| Stand age | 0.1148 | 0.0333 | 3.451 | 0.001 | 0.0494 | 0.1803 |
| Stand age * Scots pine | –0.0219 | 0.0422 | –0.519 | 0.604 | –0.1050 | 0.0612 |
| Stand age * Norway spruce | 0.0459 | 0.0387 | 1.186 | 0.236 | –0.0302 | 0.1220 |
| Stand age * Hardwoods | 0.0000 | 0.0000 | ||||
| Site type (Ref. VT) | ||||||
| OMT | 1.0663 | 0.1970 | 5.412 | 0.000 | 0.6787 | 1.4540 |
| MT | 0.5469 | 0.1646 | 3.323 | 0.001 | 0.2231 | 0.8707 |
| Soil preparation method (Ref. not prepared) | ||||||
| Continuous trace | –0.0662 | 0.1795 | –0.3687 | 0.713 | –0.4193 | 0.2870 |
| Spots | 0.2550 | 0.1799 | 1.417 | 0.157 | –0.0991 | 0.6090 |
| Ln(Area), ha | 0.1487 | 0.0646 | 2.303 | 0.022 | 0.0217 | 0.2757 |
| Variance components [Stand (uj), Plot (eij)] | ||||||
| Var(uj) | 0.4536 | 0.0572 | 0.000 | 0.3542 | 0.5809 | |
| Var(eij) | 1.2323 | 0.0488 | 0.000 | 1.1403 | 1.3317 | |
| Table 7. Mixed linear regression model for density of the removed trees on stands which have not been previously pre-commercially thinned. The dependent variable is density of the trees removed ha–1, the random stand and plot level effects are uj (Var = 6569.5^2) and eij (Var = 8333.9^2) all variables had 308 df, and the model fit is 16.2%. | ||||||
| Parameter | Estimate | Std. error | t | Sig. | 95% confidence interval | |
| Lower bound | Upper bound | |||||
| Intercept | 2764.3 | 3862.7 | 0.716 | 0.475 | –4836.3 | 10364.9 |
| Dominant tree species (Ref. Hardwood) | ||||||
| Scots pine | –1717.5 | 4692.0 | –0.366 | 0.715 | –10949.9 | 7514.9 |
| Norway spruce | –2554.6 | 4013.0 | –0.637 | 0.525 | –10451.0 | 5341.8 |
| Stand age | 90.0 | 300.3 | 0.300 | 0.765 | –501.0 | 681.0 |
| Stand age * Scots pine | 313.3 | 381.3 | 0.822 | 0.412 | –437.0 | 1063.6 |
| Stand age * Norway spruce | 271.8 | 349.0 | 0.779 | 0.437 | –415.0 | 958.6 |
| Stand age * Hardwoods | 0.0 | 0.0 | ||||
| Site type (Ref. VT) | ||||||
| OMT | 7109.7 | 1778.5 | 3.998 | 0.000 | 3610.1 | 10609.2 |
| MT | 5928.1 | 1485.6 | 3.990 | 0.000 | 3004.9 | 8851.4 |
| Soil preparation method (Ref. not prepared) | ||||||
| Continuous trace | 1784.0 | 1620.0 | 1.101 | 0.272 | –1403.6 | 4971.6 |
| Spots | 3784.2 | 1624.3 | 2.330 | 0.020 | 588.1 | 6980.3 |
| Ln(Area), ha | 2064.4 | 582.7 | 3.543 | 0.000 | 917.8 | 3210.9 |
| Variance components [Stand (uj), Plot (eij)] | ||||||
| Var(uj) | 43157746 | 4629589 | 0.000 | 34974317 | 53255967 | |
| Var(eij) | 69436790 | 2749029 | 0.000 | 64252532 | 75039344 | |
For all species, fertile sites consumed more labour than drier ones; fertile OMT was 114% higher and mesic MT was 66% higher than dryish VT. LC was high on fertile sites because of both large diameter and high density of removal. Soil preparation method also increased LC, mainly because soil-prepared sites had more trees to be removed than sites not prepared. The interaction term between site type and stand age was not significant on stands without previous PCT. However, larger sites were more time consuming to PCT than smaller ones per unit area. Both stump diameter and density of the removal increased with area of a site.
On stands with former PCT, estimating LC remains difficult. The only significant variable in the model (Table 4) was stand age and this has a positive but minor effect on LC (Fig. 2). Analysis of other variables did not reveal significant differences. However, compared to conifer OMT and MT stands without previous PCT, the estimated LC for stands with previous PCT was rather low. For example, the estimated bias-corrected LC for a 15-year old OMT spruce stand without previous PCT is 2.8 days ha–1, whereas that value on stands with previous PCT is 1.3 days ha–1 (Figs. 1 and 2).
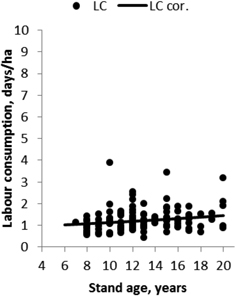
Fig. 2. The back-transformed and bias-corrected a priori estimates (LC cor.), and calculated values (LC) of labour consumption of Pre-Commercial Thinning (PCT) according to stand age and removal in stands which have previously had PCT.
4 Discussion
This study points out that LC of PCT increases as a function of stand age. In addition to predicting the costs of a given worksite, we believe LC models can be used to plan and implement cost-effective management programmes for commercial forests.
Although LC increased with stand age for all tree species modelled, with respect to spruce, the relative increase was lower for pine and lower still for hardwood stands. The growth dynamics of different tree species offer a rational explanation for the result, in that early (< 20 years) growth of Norway spruce is slower than that of birch or Scots pine (Vuokila and Väliaho 1980; Kaila et al. 2006). However, older spruce stands typically contain rather large hardwoods that are time consuming to remove. In stands dominated by hardwoods and Scots pine, many of the largest trees are crop trees. Thus, non-crop trees are smaller and easier to remove.
In this study, LC of the Norway spruce stands which had no previous PCT done increased at a very similar rate (17% over two years) to that of PCT of > 4 m stands (15% over two years) according to Kaila et al. (2006). However, LC of the PCT of < 4 m stands increased at 27% over two years according to Kaila et al. (2006). In this study, the rate of increase could be slower because results represent an average increase of LC from one age group to another in the inventory study. Stand selection may not have been random, and the slope of the LC curve may consequently be biased in relation to development of LC in a certain stand, i.e., the method used by Kaila et al. (2006).
The estimated LC ha–1 increased as stand area increased. The reason for lower LC of small areas might be a consequence of competition from adjacent stands containing older trees. In areas < 1 ha, the density and size of removed trees was lower than in larger areas. According to Siipilehto (2006), an adjacent stand can strongly affect the growth of smaller trees located within half their mean height away from the stand edge. Thus, mature adjacent stands can substantially reduce the growth of trees to be removed from small stands.
Our results suggest soil preparation method influences LC, and those employed under the “spot” category translated to the highest increase. This is similar to the effect soil preparation technique has on the need for early cleaning (Uotila et al., 2012). However, this result is unexpected because a preparation method that exposes a lot of mineral soil (i.e., continuous trace) typically leads to the emergence of many hardwood seedlings (Uotila et al. 2010). However, soil preparation techniques are site dependent, e.g., mounding methods are generally applied to damp and fertile sites that favour hardwoods, whereas disc-trenching is the most common opposite option (Hyvän metsänhoidon suositukset 2002). In spite of these factors, our results remain valid because the models represent the outcome of different soil preparation methods in practice.
The inventory was conducted in privately owned forests that are not required to maintain records of PCT. Thus, the time of earlier PCT was not possible to determine reliably. For that reason, the model remains approximate with respect to LC for stands which had previous PCT done.
This study was based on LC estimated from the removal of PCT according to Kaila et al. (2006), and assumed this accurately reflected the mean LC of a managed stand. Thus, the model is appropriate for comparing a priori and a removal based labour consumption estimation methods. However, general conclusions about variation of labour consumption of PCT can’t be made because of the residuals of the model of Kaila et al. (2006) were not taken into account. Furthermore, field measurements can have large sampling errors which may have caused some bias in the results. For example, the average stump diameter of removed trees was high in some stands, especially when compared to the density of removal. The sampling error we detected appears to be random and it was considered to have only a minor effect on the modelling procedure. However, few extreme and abnormally high values were considered necessary to replace with less extreme ones.
The model was based on typical forest practices and conditions in Finland and the information available from forest management plan. However, other relevant factors can affect the establishment and growth of competing hardwoods. In the case of stands with previous PCT in particular, timing of earlier PCT is important. In addition the time periods between clear-cutting, soil preparation and regeneration likely influence the number of hardwoods on a given site. Likewise, the hardwood basal area prior to clear-cut, ditches, and soil moisture could complicate PCT, but because these variables are observed or measured at some stage of the regeneration process, they are also easy to include in future models and management databases.
The results are well representative in Northern Savonia, which is the area where the material was collected from. Further on, forest of southern part of Finland, including the parts south from the line of Oulu to Kuhmo are similar kind of boreal forests as in Northern Savonia. Thus, the models can be applicable in there, except in the more temperate climate of coast, especially in south. The results are not directly applicable in cooler climate of Northern Finland. On the other hand, the results can be adapted to other similar kind of conditions as boreal forests of southern part of Finland, for example in the middle part of Sweden.
In practice, a priori LC estimation could be applied to small worksites, in which the cost of removal based estimation are high compared to the estimated costs of actual PCT work. The average size of a PCT stand in Finland is ca 1.6 ha (Tapion vuositilasto… 2012). Thus, a large proportion of Finnish forest sites are amenable to this approach. A forest service provider may also be required to produce quotes for a large complex of small and disconnected stands. Accurate evaluation of such stands would be difficult and time consuming. However, it is likely that LC estimates generated with our approach would be close to the actual LC for such instances, demonstrating the utility of a model-based estimation procedure and the inherent value it offers.
Acknowledgements
The research was partly funded by the Foundation for Research of Natural Resources in Finland (Suomen Luonnonvarain Tutkimussäätiö), and the work was carried out at the Finnish Forest Research Institute Suonenjoki Unit. We thank Dr. Juha Lappi for the comments about statistical analysis, Michael Hardman for revising the English language, and The Finnish Forest Centre for the collaboration in collecting the material of the study.
References
Act on the Financing of Sustainable Forestry (1094/1996).
Bell F.W., Ride K.R., St-Amour M.L., Ryans M. (1997). Productivity, cost, efficacy and cost effectiveness of motor-manual, mechanical, and herbicide release of boreal spruce plantations. The Forestry Chronicle 73(1): 39–46. http://dx.doi.org/10.5558/tfc73039-1.
Bell F.W., Thiffaul N., Szuba K. Luckai N.J., Stinson A. (2011). Synthesis of silviculture options, costs, and consequences of alternative vegetation management practices relevant to boreal and temperate conifer forests: Introduction. The Forestry Chronicle 87(2): 155–160. http://dx.doi.org/10.5558/tfc2011-005.
Boateng J.O., Heineman J.L., Bedford L., Harper G.J., Linnel Nemec A.F. (2009). Long-term effects of site preparation and postplanting vegetation control on Picea glauca survival, growth and predicted yield in boreal British Columbia. Scandinavian Journal of Forest Research 24: 111–129. http://dx.doi.org/10.1080/02827580902759685.
Cajander A.K. (1926). The theory of forest types. Acta Forestalia Fennica 29(3).108 p.
Comeau P.G., Biring B.S., Harper G.J. (2000). Effectiveness of repeated manual cutting and glyphosate for release of Engelmann Spruce from mixed-shrub herb vegetation. Western Journal of Applied Forestry 15(3): 154–162.
Finnish Statistical Yearbook of Forestry. (2011). Finnish Forest Research Institute. 470 p.
Fu S., Chen H.Y.H., Bell F.W., Sharma M. Delaney J.R., Peterson G. (2008). Effects of timing of glyphosate application on jack pine, black spruce, and white spruce plantations in northern Manitoba. The Forestry Chronicle 84(1): 37–45. http://dx.doi.org/10.5558/tfc84037-1.
Hämäläinen J., Kaila S. (1983). Taimikon perkauksen ja harvennuksen sekä uudistusalan raivauksen ajanmenekkisuhteet. [Relative time consumption of clearing-saw (brush-cutter) work in clearing, and in young stand cleaning and thinning]. Metsätehon katsaus. 4 p. [In Finnish].
Homagain K., Shahi C.K., Leitch M., Luckai N.J., Bell F.W. (2011a). Difference in extrinsic tree quality and value of fibre production following alternative vegetation management treatments in northwestern Ontario. The Forestry Chonicle 87(2): 251–259. http://dx.doi.org/10.5558/tfc2011-012.
Homagain K., Shahi C.K., Luckai N.J., Leitch M., Bell F.W. (2011b). Benefit-cost analysis of vegetation management alternatives: an Ontario case study. The Forestry Chronicle 87(2): 260–273. http://dx.doi.org/10.5558/tfc2011-013.
Hytönen J., Jylhä P. (2008). Fifteen-year response of weed control intensity and seedling type on Norway spruce survival and growth on arable land. Silva Fennica 42(3): 355–368.
Hyvän metsänhoidon suositukset. (2002). Metsätalouden kehittämiskeskus Tapio. 95 p. [In Finnish].
Jobidon R. (2000). Density-dependent effects of northern hardwood competition on selected environmental resources and young white spruce (Picea glauca) plantation growth, mineral nutrition, and stand structural development – a 5-year study. Forest Ecology and Management 130: 77–97. http://dx.doi.org/10.1016/S0378-1127(99)00176-0.
Kaila S., Poikela A., Strandström M. (1999). Raivaussahatyön tuottavuus ja palkanmääritys. [Payment and productivity of forest clearing with clearing saw (brush cutter)]. Metsätehon raportti 78. 39 s. + liitteet. [In Finnish].
Kaila S., Kiljunen N., Miettinen A., Valkonen S. (2006). Effect of precommercial thinning on the consumption of working time in Picea abies stands in Finland. Scandinavian Journal of Forest Research 21: 496–504. http://dx.doi.org/10.1080/02827580601073263.
Kliger D., Levikson B. (1998). Pricing insurance contracts – an economic viewpoint. Insurance: Mathematics and Economics 22: 243–249. http://dx.doi.org/10.1016/S0167-6687(98)00002-X.
Korhonen K.T., Ihalainen A., Miina J., Saksa T., Viiri H. (2010). Metsänuudistamisen tila Suomessa VMI10:n aineistojen perusteella. [The state of forest regeneration in Finland according to National Forest Inventory 10]. Metsätieteen aikakauskirja 4/2010: 425–478. [In Finnish].
LeBel L.G., Dubeau D. (2007). Predicting the productivity of motor-manual workers in precommercial thinning operations. The Forestry Chronicle 83(2): 215–220. http://dx.doi.org/10.5558/tfc83215-2.
Ligné D., Eliasson L., Nordfjell T. (2005). Time consumption and damage to the remaining stock in mechanised and motor manual pre-commercial thinning. Silva Fennica 39(3): 455–464.
Nilsson U., Örlander G. (1999). Vegetation management on grass-dominated clearcuts planted with Norway spruce in southern Sweden. Canadian Journal of Forest Research 29: 1015–1026. http://dx.doi.org/10.1139/x99-071.
Opio C., Fredj K., Wang B. (2009). Profitability of manual brushing in young lodgepole pine plantations. BC Journal of Ecosystem and Management 10(1):15–21
Pokharel B., Dech J.P. (2012). Mixed-effects basal area increment models for tree species in the boreal forests of Ontario, Canada using an ecological land classification approach to incorporate site effects. Forestry 85(2): 255–270. http://dx.doi.org/10.1093/forestry/cpr070.
Saksa T., Kankaanhuhta V. (2007). Metsänuudistamisen laatu ja keskeisimmät kehityskohteet Etelä-Suomessa. Metsänuudistamisen laadun hallinta -hankkeen loppuraportti. [Success of forest regeneration in Southern Finland and the most essential matters to develop: quality control in forest regeneration – final report of the project]. Metsäntutkimuslaitos, Suonenjoen yksikkö. 90 p. [In Finnish].
Saksa T., Miina J. (2010). Perkaustavan ja -ajankohdan vaikutus männyn istutustaimikon kehitykseen Etelä-Suomessa. Metsätieteen aikakauskirja 2/2010: 115–127.
Siipilehto J. (2001). Effect of weed control with fibre mulches and herbicides on the initial development of spruce, birch and aspen seedlings on abandoned farmland. Silva Fennica 35(4): 403–414.
Siipilehto J. (2006). Height distributions of Scots pine sapling stands affected by retained tree and edge stand competition. Silva Fennica 40(3): 473–486.
SPSS Base 16.0 user’s guide. (2007). SPSS Inc. 527 p.
Tapion vuositilasto 2011. (2012). Metsätalouden kehittämiskeskus Tapio. 55 p. [In Finnish].
Uotila K., Saksa T. (2013). Effects of early cleaning on young Picea abies stands. Scandinavian Journal of Forest Research. http://dx.doi.org/10.1080/02827581.2013.869349.
Uotila K., Rantala J., Harstela P., Saksa T. (2010). Effect of soil preparation method on economic result of Norway spruce regeneration chain. Silva Fennica 44(3): 511–524.
Uotila K., Rantala J., Saksa T. (2012). Estimating the need for early cleaning in Norway spruce plantations in Finland. Silva Fennica 46(5): 683–693.
Vuokila Y., Väliaho H. (1980). Viljeltyjen havumetsiköiden kasvatusmallit. Summary: Growth and yield models for conifer cultures in Finland. Communicationes Instituti Forestalis Fenniae 99(2). 271 p.
Walfridsson E. (1976). Lövets konkurrens i barrkulturen. [Competition from broadleaf trees in young conifer stands]. Skogen 63: 631–633. [In Swedish].
Total of 34 references
Send to email
