Karri Uotila  ,
Jari Miina,
Timo Saksa,
Ron Store,
Kauko Kärkkäinen,
Mika Härkönen
,
Jari Miina,
Timo Saksa,
Ron Store,
Kauko Kärkkäinen,
Mika Härkönen
Low cost prediction of time consumption for pre-commercial thinning in Finland
Uotila K., Miina J., Saksa T., Store R., Kärkkäinen K., Härkönen M. (2020). Low cost prediction of time consumption for pre-commercial thinning in Finland. Silva Fennica vol. 54 no. 1 article id 10196. https://doi.org/10.14214/sf.10196
Highlights
- Time consumption (TC) in pre-commercial thinning (PCT) can be predicted by variables describing site and stands conditions and previous silvicultural management
- Applying variables available in forest resources data the field-assessment of worksite difficulty factors is not needed
- The TC model could facilitate the predictions of the labour costs of PCT in forest information systems.
Abstract
The time consumption (TC) of pre-commercial thinning (PCT) varies greatly among sites, stands and forest workers. The TC in PCT is usually estimated by field-assessed work difficulty factors. In this study, a linear mixed model for the TC in PCT was prepared by utilizing forest resources data (FRD). The modelling data included 11 848 and validation data included 3035 worksites with TC information recorded by forest workers within the period of 2008–2018. The worksites represented a range of site and stand conditions across a broad geographical area in Finland. Site and stand characteristics and previous management logically explained the TC in PCT. The more fertile the site, the more working time was needed in PCT. On sites of medium fertility, TC in the initial PCT increased with stand age by 0.5 h ha–1 yr–1. Site wetness increased the TC. PCT in summer was more time consuming than in spring. Small areas were more time consuming to PCT per hectare than larger ones. The between-forest worker variation involved in the TC was as high as 35% of the variation unexplained by the TC model. The coefficient of determination in validation data was 19.3%, RMSE 4.75 h ha–1 and bias –1.6%. The TC model based on FRD was slightly less precise than the one based on field-assessed work difficulty factors (removal quantity and type and terrain difficulty): RMSE 4.9 h ha–1 vs. 4.1 h ha–1 (52% vs. 43%). The TC model could be connected to forest information systems where it would facilitate the predictions of the labour costs of PCT without field-assessing work difficulty factors.
Keywords
forest vegetation management;
early cleaning;
release treatment;
linear mixed model;
topographic wetness index;
work productivity
-
Uotila,
Natural Resources Institute Finland (Luke), Natural resources, Latokartanonkaari 9, FI-00790 Helsinki, Finland
E-mail
karri.uotila@luke.fi
- Miina, Natural Resources Institute Finland (Luke), Natural resources, Yliopistokatu 6 B, FI-80100 Joensuu, Finland E-mail jari.miina@luke.fi
- Saksa, Natural Resources Institute Finland (Luke), Natural resources, Survontie 9, FI-40500 Jyväskylä, Finland E-mail timo.saksa@luke.fi
- Store, Natural Resources Institute Finland (Luke), Bioeconomy and environment, Teknologiakatu 7, FI-67100 Kokkola, Finland E-mail ron.store@luke.fi
- Kärkkäinen, E-mail kauko.karkkainen@gmail.com
- Härkönen, Tornator Oyj, Pielisentie 2–6, FI-81700 Lieksa, Finland E-mail mika.harkonen@tornator.fi
Received 13 May 2019 Accepted 18 February 2020 Published 21 February 2020
Views 69769
Available at https://doi.org/10.14214/sf.10196 | Download PDF

1 Introduction
Pre-commercial thinning (PCT) is a release or spacing treatment in juvenile forest stands. The best individuals are chosen as crop trees, and site resources are made available by removing their closest competing trees, typically with a forest clearing saw by a forest worker. Released crop trees will grow and produce commercially valuable timber products more quickly. Benefits of PCT for wood production are well studied and broadly recognized (Pettersson 1992; Huuskonen and Hynynen 2006; Uotila 2017; Fahlvik 2018).
PCT is often needed in commercial wood production in many boreal forests. Slightly less than 200 000 hectares of juvenile stands are annually managed in Finland and annual expenditures on PCT is about 80 million euros (OSF 2018). The real-valued per hectare cost of PCT has steadily increased from the middle of the 1990s, doubling in 20 years (Finnish Statistical Yearbook... 2014). PCT has taken an increasingly larger share of the early rotation silvicultural costs, and the need to optimise PCT-procedures has become quite necessary. For example, Uotila (2017) found that some parts of PCT operations management could be streamlined. Estimation of time consumption (TC) of PCT is one such factor. Silvicultural service providers need worksite difficulty and TC information of PCT in different stand and site conditions for payment and marketing purposes; it would be preferable to get this information before PCT is applied.
In Fennoscandia, TC is typically estimated with removal based worksite classification (WSC) methods, which commonly account for density and size of the trees, but may also account tree species of removal, clustering of removal, and terrain difficulty (Hämäläinen and Kaila 1983; Bergstrand et al. 1986). These methods have been used for several decades. Since, working techniques in PCT have been basically remained constant, with only minor technical equipment updates. Moreover, the WSC-methods have been tested with the updated working techniques (Kaila et al. 1999) and are still valid for estimating TC in PCT.
However, the estimation methods used for WSC are based on field measurements or visual observations of removal; they are rather expensive to implement with a precise outcome as measuring a stand comprehensively and objectively can take 1.5–4.5 h ha–1 of working time (Bergstrand et al. 1986; Kaila et al. 1999). The precision and expenses of WSC increase with the number of plots required. The expenses may be high compared to a PCT of a rather easy worksite, which takes about 4–10 h ha–1 to do (Koskinen 2013; Uotila et al. 2014). Thus, WSC-methods used in practice are likely to be much less time demanding.
Subjective visual observation and measuring only a few subjectively-selected plots may increase the efficiency of field estimation; according to Bergstrand et al. (1986), it took approximately 0.5 h ha–1 to measure 4–6 subjectively-selected plots on a worksite. The estimated time consumption was judged often to give similar results to comprehensive objective estimation. A quick peek at a worksite without measurements, approximately 20 min ha–1, by an experienced forestry officer, on the other hand, often gave divergent results (Bergstrand et al. 1986). In addition, subjective observations can lead to a systematic bias in estimation or conflict situations between forest workers and the officers determining the subjective estimates (Bergstrand et al. 1986; Kaila et al. 1999; Lupin et al. 2019). According to Kaila et al. (1999), the TC-estimations made by forestry officers in practice were badly biased compared to objective comprehensive measurements; the officers overestimated TC by about 50%. Nevertheless, the possible bias and lack of precision may be accepted because of the high costs of the comprehensive objective estimates.
The costs of objective estimates of TC could be dramatically reduced by automating the process and predicting TC with the forest resources data (FRD) available from silvicultural service providers. Uotila et al. (2014) found that the traditional forest management plan data on site and stand characteristics are beneficial in estimating TC. However, the forest management plan data can have shortcomings that severely limit estimation of TC in PCT. Uotila (2017) introduced that big data may overcome some of the shortcomings seen in the estimation. The most notable ones were quantifying site wetness and including information on previous silvicultural management within the estimation. For example, topographic wetness indices (TWI) computed from digital elevation models have been used to predict the properties of the soil (Seibert et al. 2007; Murphy et al. 2011) that would support the regeneration of broadleaves (Sarvas 1948; Miina and Saksa 2013b). Moreover, some silvicultural service providers are recording data on silvicultural operations into their forest information systems. Including these types of additional information could overcome the most notable shortcomings of Uotila et al.’s (2014) TC model. Moreover, there are other factors affecting the TC in PCT (e.g. seasonal timing of PCT and variation among forest workers) that should be included in the TC analyses. For example, in a forest information system, a model for PCT TC could be utilized to predict the productivity for and costs of PCT in different site and stand conditions. A model based on only those variables available in forest information systems would enable such predictions without any costs related to field visits and observations. However, it is not known how accurately the TC can be predicted without field observations on worksite.
The aim of this study was to predict the TC of motor-manual PCT using an extensive data collected while implementing PCT work in Finland. A model was fitted using only those variables that can easily be obtained from forest resources data (e.g. site and stand characteristics and previous stand management). Another TC model was fitted using WSC done in the field in connection to PCT. The two TC models estimated were used to evaluate factors affecting productivity for motor manual PCT with a clearing saw. Special attention was given to the seasonal timing of the PCT work, wetness of the site, and between-forest worker variation involved in the TC. These variables have not been thoroughly analysed earlier, but we hypothesized that they affect the TC of PCT. Model predictions based on only forest resources data were compared to those based on field-assessed WSC. The models for TC in PCT were designed to be included in forest information systems for silvicultural planning purposes.
2 Materials and methods
2.1 Pre-commercial thinned worksites
The data on PCT-worksites were obtained from the database of a national scale silvicultural service provider in Finland. The data of the study consisted of 14 833 worksites (Fig. 1), individually thinned by 163 different forest workers with clearing saws during the years 2008–2018. The data was randomly split into a modelling (80%, N = 11 848) and a validation (20%, N = 3035) datasets. The modelling data contained a wide range of young stands growing across a wide range of site conditions (Tables 1 and 2). Forest regeneration and management of young stands (including timing of PCT) have been done according to the silvicultural prescriptions of the silvicultural service provider. The values following in the text describe the modelling dataset, unless noted otherwise.
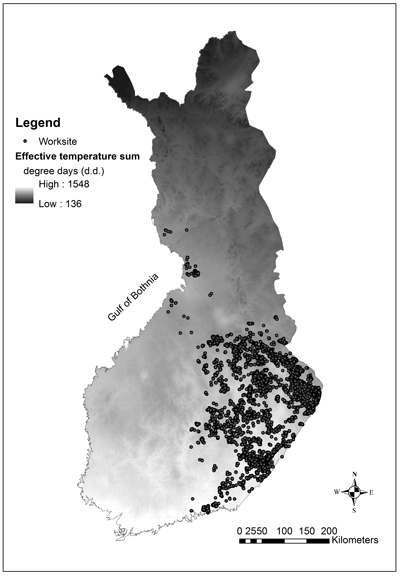
Fig. 1. Location of the study worksites in Finland. The long-term (1971–2000) average effective temperature sum is showed on the map.
| Table 1. Main categorical characteristics of the worksites (N = 11 848) extracted from forest resources data (FRD) and used in modelling. | |||||||||
| Year | Month | Site type a | Main tree species b | Soil preparation method | |||||
| 2008 | 359 | Dec–Mar | 216 | OMT | 1316 | Pinus | 3936 | Spot mounding | 4637 |
| 2009 | 454 | Apr | 522 | MT | 6812 | Picea | 6184 | Disc trenching | 2689 |
| 2010 | 737 | May | 1625 | VT | 1869 | Betula pendula | 869 | No preparation | 45 |
| 2011 | 863 | Jun | 1618 | CT or ClT | 82 | Betula pubescens | 812 | Inverting | 68 |
| 2012 | 1120 | Jul | 1304 | Rhtkg or Mtkg | 1335 | Other broadleaves | 47 | Excavator patching | 1392 |
| 2013 | 995 | Aug | 1793 | Ptkg | 397 | Continuous patching | 1380 | ||
| 2014 | 1574 | Sep | 1489 | Vtkg or Jätkg | 37 | Establishment method | Ditch mounding | 1258 | |
| 2015 | 1476 | Oct | 1967 | Planting | 9780 | Not known | 379 | ||
| 2016 | 1490 | Nov | 1314 | JSM c | Direct seeding | 1358 | |||
| 2017 | 1533 | Yes | 1418 | Natural | 710 | ||||
| 2018 | 1247 | No | 10430 | ||||||
| a Oxalis–Myrtillus type (OMT), Myrtillus type (MT), Vaccinium type (VT), Calluna type (CT), and Cladonia type (ClT) on mineral soils, and the corresponding site types on peatlands herb-rich type (Rhtkg), Myrtillus type (Mtkg), Vaccinium type (Ptkg), dwarf shrub type (Vtkg) and Cladonia type (Jätkg). b Picea includes also Larix and Abies, and Pinus includes both P. sylvestris and P. contorta as main tree species. c Juvenile stand management (JSM) has been done earlier or not. | |||||||||
| Table 2. Main continuous characteristics of the worksites (N = 11 848) used in modelling. | ||||||
| Min | Median | Mean | SD | Max | ||
| TC, h ha–1 | 0.40 | 8.80 | 9.93 | ± | 5.47 | 46.10 |
| Worksite area, ha | 0.03 | 1.34 | 1.89 | ± | 1.75 | 27.73 |
| Stand age, years | 2 | 8 | 8.40 | ± | 3.40 | 24 |
| Establishment delay a, years | 0 | 1 | 0.58 | ± | 0.59 | 9 |
| Stand age in previous JSM b, years | 1 | 7 | 6.90 | ± | 2.00 | 13 |
| Birch in final harvest, m3 ha–1 | 0 | 5 | 13.78 | ± | 0.24 | 233 |
| Topographic wetness index | 3891 | 6797 | 7263 | ± | 1872 | 21846 |
| Temperature sum, d.d. | 935 | 1147 | 1161 | ± | 98 | 1388 |
| Latitude ETRS-TM35FIN | 6699759 | 6930960 | 7331801 | |||
| Longitude ETRS-TM35FIN | 378536 | 596313 | 725856 | |||
| a Time from the soil preparation to the artificial regeneration. b Only worksites with previous juvenile stand management (JSM) (N = 1418). | ||||||
A total of 1418 worksites (12%) were treated previously by juvenile stand management (JSM), i.e. any PCT-type operation applied prior to the current PCT. The need for and timing of the JSM were determined based on field visits and observations on the heights and densities of undesired and crop-trees. The JSM may consist of one or more operations depending on tree species, establishment method and site type. According to the prescriptions, JSM is to be conducted in two phases; first removing undesired broadleaves (so-called early cleaning) and later spacing the crop trees in PCT. In practice, one-phase JSM had been applied if undesired broadleaves only sparsely populated the site in the very early phase of the rotation according to field observations.
The time consumption of PCT was recorded to the nearest 0.05 h from car to worksite and back, and subsequently entered into the database by the forest worker (Table 2). The worker estimated the area of the worksite from a map. The time consumption per hectare was calculated from these values. The forest worker also reported the dominant tree species at the site. Dominant tree species were pine (Pinus; mainly Pinus sylvestris L., but a few Pinus contorta Douglas ex Loudon), spruce (Picea; mainly Picea abies (L.) Karst., but a few Larix or Abies), pubescent birch (Betula pubescens Ehrh.), silver birch (Betula pendula Roth), or other broadleaved species.
The following information on earlier management and its timing was determined for each worksite using the database of the silvicultural service provider: the volume of birch harvested in the final harvest, soil preparation method, establishment method, site fertility and JSM, if done. Establishment delay (i.e., the number of years between soil preparation and establishment) and stand age at the time of previous and current JSM were calculated according to the dates of these operations. Site fertility classification was based on Cajander’s (1926) site type classification and corresponding classification on peatlands (Laine et al. 2012).
Variables describing the wetness and location of the worksite in Finland were calculated for each worksite. First, the topographic wetness index (TWI) was calculated by Salmivaara et al. (2017) based on the estimation methods suggested by Bewen and Kirkby (1979). The TWI for each worksite was estimated from the digital elevation models, and based on the TWI value of a 16 m × 16 m square at the center point of the worksite. It was considered as an appropriate indicator of the site wetness as worksite boundaries were not precisely known. During the modelling phase, we also tested alternative mean-based wetness indices calculated to certain surroundings from the centre of a worksite. The TWI data are freely available at https://avaa.tdata.fi/-/paituli-paikkatietopalvelu.
The average effective temperature sum (TS) of the long-term reference period 1971–2000, the sum of the positive difference between the daily mean temperature and +5 °C during the growing season, was used to describe the country-scale variation in site conditions. The source of the daily temperature data was Finnish Meteorological Institute (Venäläinen et al. 2005), and the initial point observations of TS were interpolated to a continuous raster surface with a resolution of 1 km (Ojansuu and Henttonen 1983). The effective temperature sum of a worksite was the value of the 1 km × 1 km square on which the centre of the worksite was located (Fig. 1).
The modelling dataset was filtered from a larger dataset. The following criteria were used to select the PCT sites:
- Worksite was individually managed by only one worker.
- TC was 0.5–45.0 h worksite–1.
- TC was 0.33–49 h ha–1.
- Stand age was 2–30 years.
- Previous cutting was final harvest.
- Soil preparation was other than deep soil cultivation.
- Current operation was early cleaning, PCT or young stand restoration with clearing saw. Young stand restoration is basically a delayed PCT.
- Time since the previous JSM, if conducted, was at least two years.
Some of the rare categories of the variables were combined. For example, the two poorest site type classes on mineral soils, Calluna (CT) and Cladonia type (ClT), and the two poorest on peatlands, dwarf shrub (Vtkg) and Cladonia type (Jätkg), were both merged (see Table 1). Moreover, if determining the establishment delay (time between soil preparation and establishment) was not possible (458 worksites), the mode value of establishment delay (one year) was used.
In 51% of the study worksites, a forest officer or a worker of the service provider had done the worksite classification (WSC). WSC was only been conducted since 2014 to estimate the reference time consumption category for the PCT. Subjective evaluation and subjectively selected plots were used in estimation. We expect the field estimation to take about 0.5 h ha–1 of worktime (Bergstrand et al. 1986), but the estimation method or work time consumption was not precisely documented. The estimation methods are based on time consumption tables in collective labour agreement on forestry and time studies of Hämäläinen and Kaila (1983). In the WSC the following worksite difficulty factors were estimated (Table 3):
1) Removal quantity in five categories, based upon the density and size of the trees to be removed, and addressed as reference productivities in PCT: sparse = 1.80 ha day–1, easy = 1.25 ha day–1, normal = 0.67 ha day–1, difficult = 0.32 ha day–1, and extreme = 0.20 ha day–1.
2) Terrain difficulty in three categories, addressed subjectively as a multiplier for reference productivity: normal = 1.00, difficult = 0.95, and extreme = 0.90.
3) Removal type in three categories, based upon the main tree species to be removed, and addressed as a multiplier for reference productivity: easy = 1.00, normal = 0.95, and difficult = 0.90.
| Table 3. Worksite difficulty factors (N = 7595) determined in field-assessed worksite classification (WSC) by forestry officer or worker and used in modelling. Reference productivity guidelines for removal quantity (ha day–1), terrain difficulty (multiplier) and removal type (multiplier) classes are given in parentheses. | |||||
| Removal quantity | Terrain difficulty | Removal type | |||
| Class | N | Class | N | Class | N |
| Sparse (1.80 ha day–1) | 444 | Normal (1.00) | 5590 | Easy (1.00) | 178 |
| Easy (1.25 ha day–1) | 1657 | Difficult (0.95) | 1836 | Normal (0.95) | 7286 |
| Normal (0.67 ha day–1) | 3779 | Extreme (0.90) | 169 | Difficult (0.90) | 131 |
| Difficult (0.32 ha day–1) | 1569 | ||||
| Extreme (0.20 ha day–1) | 146 | ||||
In this study the productivity values of the factors are re-determined in the analysis. The WSC-classification also had a class for worksites which were difficult to estimate with the WSC (e.g., in heavily browsed stands). These sites were excluded from the analysis.
The worksite difficulty factors were used as predictors in a model for TC in PCT. This WSC-based model was utilized in evaluating the performance of the TC model based on only the forest resources data (FRD) without field observations on worksite difficulty factors.
2.2 Predicting the TC in PCT
Three mixed-effect models for the time consumption (TC) in pre-commercial thinning (PCT) were fitted using the data on the worksites of the silvicultural service provider in Finland. In Model 1 (FRD-Model), the (fixed) effects of site and stand characteristics, as well as previous silvicultural management on the TC in PCT were modelled by accounting for random year and forest worker effects. The values of these predictors are usually known in the forest resources data (FRD). The dataset of 2008–2018 described in Tables 1 and 2 was used in modelling. The number of observations (worksites) was 11 848.
In Model 2 (WSC-Model), the TC in PCT was modelled as a function of field-assessed worksite difficulty (WSC) factors by accounting for random year and forest worker effects. A total of 7583 worksites managed by 100 forest workers were determined by worksite difficulty factors in 2014–2018 (Table 3).
Model 3 was fitted for comparison purposes by refitting Model 1 with the same data set (7583 worksites) for which field-assessed WSC were determined. The year and forest worker effects were incorporated as random. Models 2 and 3 were used in validation of the FRD-based modelling of TC in PCT by comparing it to the WSC-based one.
For all three models, the following structural equation was used:
![]()
where TC is the time consumption in pre-commercial thinning (h ha–1); f(·) is the fixed part of the model; x1, x2, …, xn are fixed predictors; and u, v and e are, respectively, the random forest worker and year effects and the error term with a mean of zero and constant variances. The subscripts i, j and t refer to worksite, forest worker and year, respectively. The variances of the random, normally distributed effects and the parameters of fixed predictors were estimated with the statistical software R version 3.5.1 (R Core Team 2018) using the restricted maximum likelihood method (REML) of the lmer function in the package lme4 (Bates et al. 2015).
The logarithmic transformation of the response was used to avoid the heteroscedasticity and normalize the response. The log-transformed responses were back-transformed to the original scale and corrected for bias using Snowdon (1991), before the error statistics were calculated.
Several variables for site and stand characteristics and stand management, as well as their transformations, were tested as predictors in Model 1. Predictors and their interactions were initially selected by expert judgement. The acceptance criteria were that all the predictors of the models had to be logical and that no systematic errors were observed in the residuals. When adding a new predictor into the model, the predictor had to be significant at the 0.01 level. Especially, the effects of JSM-program were carefully planned to have rational and logical interactions of previous JSM and stand ages at the time of previous and current JSM.
The accuracy of the back-transformed (marginal) predictions of the models obtained using only the fixed effects was determined by calculating the proportion of explained variance (R2), bias and root mean square error (RMSE). The relative error statistics was calculated by dividing the bias and RMSE by the mean of the observed time consumption. The same error statistics were also calculated for the validation data. The accuracy of predictions in validation data was also illustrated with a scatterplot. The large number of observations was visualized with a density dependent plot using the geom_point density function in the geompointdensity package with superimposed contours provided by the geom_density_2d function in ggplot2 package, both using the statistical software R version 3.5.1 (R Core Team 2018).
Using Model 1, the influence of varying the predictors on the model output was analysed by predicting and plotting time consumption as a function of the typical range of the predictors in the modelling data (Tables 1 and 2). In illustrations, relative values of TC were used. However, to interpret the interaction of current and previous JSM and their timing, absolute TC values were used by holding all other predictors constant.
3 Results
3.1 Model for time consumption in PCT
Several site and stand characteristics and previous stand management extracted from forest resources data significantly affected the TC in PCT (Table 4). The timing of current and previous PCT (i.e., the JSM-program) had the highest influence on TC in PCT (Fig. 2). PCT became more laborious to do in older stands. In the model, the relationship between stand age and TC was almost linear. On typical Myrtillus type (MT) site conditions, the annual increase in TC was about 0.5 h ha–1 in stands managed for the first time and about 0.8–1.1 h ha–1 in stands which had previous JSM. According to Model 1, PCT in the stands which had previous JSM were often more time consuming to do than were unmanaged stands (Fig. 2).
| Table 4. Linear mixed model (Model 1, Eq. 1) for the time consumption (h ha–1) in pre-commercial thinning (PCT) based on forest resources data (N = 11 848). F-values were calculated to test the significance of the categorical variables in the model. The bias correction ratio was 1.0037. | ||||
| Variable | Estimate | Std. Error | t-value | p |
| Intercept | 2.0505 | 0.0425 | 48.2 | < 0.001 |
| JSM-program | ||||
| Stand age, (years from estab.) | 0.0614 | 0.0056 | 10.9 | < 0.001 |
| Stand age^2, years | –0.0009 | 0.0003 | –3.2 | 0.001 |
| Previous JSM (1 yes, 0 No) | 0.2625 | 0.0571 | 4.6 | < 0.001 |
| Previous JSM * Stand age | 0.0215 | 0.0074 | 2.9 | 0.004 |
| Previous JSM * Stand age in previous JSM | –0.0672 | 0.0095 | –7.1 | < 0.001 |
| ln(site area), ha | –0.0582 | 0.0044 | –13.2 | < 0.001 |
| Site type, ref MT | F = 108.0 | < 0.001 | ||
| OMT | 0.0598 | 0.0124 | 4.8 | < 0.001 |
| VT | –0.2535 | 0.0133 | –19.0 | < 0.001 |
| CT-ClT | –0.5344 | 0.0450 | –11.9 | < 0.001 |
| Rhtkg-Mtkg | 0.1731 | 0.0141 | 12.3 | < 0.001 |
| Ptkg | 0.0074 | 0.0231 | 0.3 | 0.747 |
| Vtkg-Jätkg | –0.1973 | 0.0673 | –2.9 | 0.003 |
| Month, ref Aug. | F = 83.7 | < 0.001 | ||
| Dec.-Mar. | –0.1503 | 0.0286 | –5.3 | < 0.001 |
| Apr. | –0.3440 | 0.0200 | –17.2 | < 0.001 |
| May. | –0.2876 | 0.0137 | –21.1 | < 0.001 |
| Jun. | –0.1626 | 0.0136 | –12.0 | < 0.001 |
| Jul. | –0.0494 | 0.0144 | –3.4 | < 0.001 |
| Sept. | –0.0795 | 0.0138 | –5.7 | < 0.001 |
| Oct. | –0.1457 | 0.0130 | –11.2 | < 0.001 |
| Nov. | –0.1390 | 0.0145 | –9.6 | < 0.001 |
| Ln(TWI), in tens of thousands | 0.1491 | 0.0172 | 8.7 | < 0.001 |
| Establishment method, ref planting | F = 50.4 | < 0.001 | ||
| Direct-seeding | –0.1614 | 0.0162 | –10.0 | < 0.001 |
| Natural | –0.0842 | 0.0182 | –4.6 | < 0.001 |
| Establishment dealy, years | 0.0388 | 0.0068 | 5.7 | < 0.001 |
| Site preparation, ref spot mounding | F = 14.4 | < 0.001 | ||
| Disc trenching | –0.0596 | 0.0131 | –4.6 | < 0.001 |
| No soil preparation | –0.2030 | 0.0593 | –3.4 | < 0.001 |
| Inverting | 0.0345 | 0.0514 | 0.7 | 0.502 |
| Excavator patching | –0.0032 | 0.0140 | –0.2 | 0.821 |
| Continuous patching | –0.0512 | 0.0146 | –3.5 | < 0.001 |
| Ditch mounding | 0.1083 | 0.0151 | 7.2 | < 0.001 |
| Not known | –0.0384 | 0.0241 | –1.6 | 0.112 |
| Main species, ref Picea | F = 13.2 | < 0.001 | ||
| Pinus | –0.0504 | 0.0096 | –5.3 | < 0.001 |
| Betula pendula | 0.0335 | 0.0148 | 2.3 | 0.024 |
| Betula pubescens | 0.0349 | 0.0154 | 2.3 | 0.023 |
| Other broadleaf | 0.0829 | 0.0579 | 1.4 | 0.152 |
| Random effects at: | Variance | |||
| Forest worker level (N = 163) | 0.0848 | |||
| Year level (N = 11) | 0.0047 | |||
| Stand level (N = 11 848) | 0.1506 | |||
| a JSM = juvenile stand management, TWI = topographic wetness index, TS = effective temperature sum. | ||||
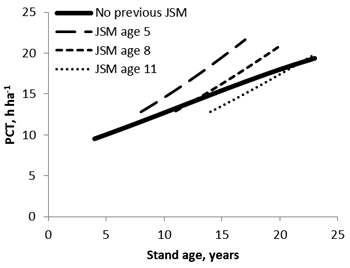
Fig. 2. Effect of stand age and the previous juvenile stand management (JSM) on the time consumption (TC) in pre-commercial thinning (PCT) done in August in planted spruce stand on spot mounded MT site type. Other predictor values fixed to: establishment delay = 0, TWI = 10 000, area = 1.5 ha.
Area of the worksite (F = 174.7, p < 0.001) had the second highest relationship with the TC in PCT; the larger the extent of a worksite, the lower the TC was per ha (Fig. 3). The relative effect was high especially on small areas due to logarithmic transformation of the predictor.
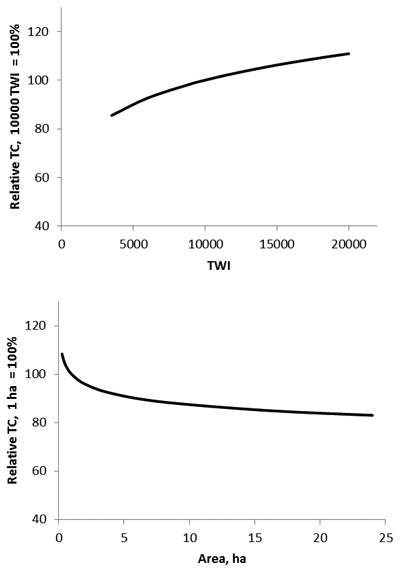
Fig. 3. Relative time consumptions (TC) for PCT as functions of the size of worksite area (1 ha = 100) and topographic wetness index (TWI 10 000 = 100).
Site type (F = 108.0, p < 0.001) also had a strong effect on the TC in PCT. PCT on less fertile sites took less time to do than on more fertile sites; e.g., CT or ClT site type stand took only 55% of the time compared to the Oxalis–Myrtillus type (OMT) (Fig. 4). Moreover, PCT in stands on mineral soils took less time than stands on peatlands on their corresponding site types; e.g., Vaccinium type mineral soil site (VT) took 77% of the time needed compared to the corresponding peatland (Ptkg).
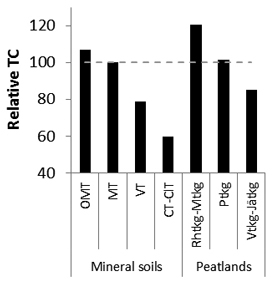
Fig. 4. Relative time consumption (TC) in PCT on different site types (MT = 100).
Several other variables also affected TC. The seasonal timing of PCT had a major impact on TC (F = 83.7, p < 0.001). During spring, TC was only 71% of that predicted in August, the most laborious season August (Fig. 5). Topographic wetness index (TWI) was positively related to TC (F = 75.1, p < 0.001) (Fig. 3). Establishment method (F = 50.4, p < 0.001), establishment delay (F = 32.5, p < 0.001), site preparation method (F = 14.4, p < 0.001), and main tree species (F = 13.2, p < 0.001) showed also a significant effect on TC. The TC of PCT in planted stands was higher than on direct seeded or naturally regenerated stands. TC increased with establishment delay, about 0.6 h ha–1 for each year the regeneration was delayed after soil preparation. Ditch-mounded sites took the most time in PCT amongst soil preparation methods; e.g. spot-mounded sites took 90% of that time compared to ditch-mounded. The differences amongst the other soil preparation methods were minor. However, sites with no soil preparation took only 73% of that time needed on ditch-mounded sites. There were only small differences among the main tree species in PCT; birch stands took 103–104% of that TC needed on spruce stands and pine stands took 95% of TC compared to spruce stands.
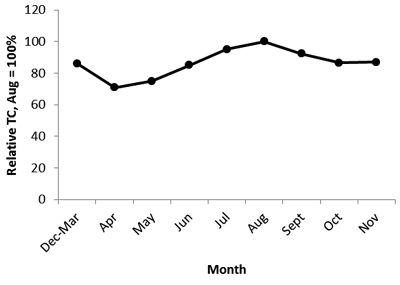
Fig. 5. The effect of the seasonal timing of PCT on the relative time consumption (TC) for PCT (August = 100).
Effective temperature sum (TS), and birch volume in the final harvest had an increasing, but non-significant effect on TC. Also the effect of standard deviation of elevation within worksite was tested, but it did not have logical or significant effect on time consumption in PCT when TWI was included in the model.
The Snowdon’s (1992) bias correction ratio for back-transformed (marginal) predictions was 1.0037. Bias-corrected RMSE of the model was 4.89 h ha–1 (RMSE% 49.3%). No systematic bias was observed in relation to the predictors of the model.
The proportion of the variance explained by fixed effects (R2) was only 20% (Table 5). As much as 35% of the unexplained variation was found at the forest worker level. Therefore, compared to the random effects of worksites (63% of the unexplained variation), there was considerable variability among forest workers that was not explained by the variables included in Model 1. The variance of the random year effects was only 2% of the unexplained variation.
| Table 5. Fitting statistics of three models for the time consumption in PCT. Fitting statistics were based on back-transformed predictions. In the modelling data sets, the models were unbiased due to Snowdon’s bias correction. | ||||
| Model 1 (FRD) | WSC-comparison | |||
| Modelling data set | Validation data set | Model 2 (WSC) | Model 3 (FRD) | |
| No. of worksites | 11 848 | 3035 | 7595 | 7595 |
| Bias, h ha–1 | 0 | –0.16 | 0 | 0 |
| Bias%, % | 0 | –1.6 | 0 | 0 |
| RMSE, h ha–1 | 4.89 | 4.75 | 4.11 | 4.91 |
| RMSE%, % | 49.3 | 48.9 | 43.2 | 51.6 |
| R2, % | 19.9 | 19.3 | 43.0 | 18.6 |
| Models 1 and 3 were fitted by using variables such as site and stand characteristics and previous silvicultural management available in forest resources data (FRD), whereas Model 2 was based on field-assessed worksite classification (WSC). | ||||
The model for TC in PCT (Model 1) was validated with a randomly selected 20% of the whole data of the study, not used in the modelling (the estimated parameters not shown). Model 1 gave slightly negatively biased predictions for TC in the validation data (bias –0.16 h ha–1 and bias% –1.6%), but other error statistics in the validation data were close to those in the modelling data (Fig. 6, Table 5).
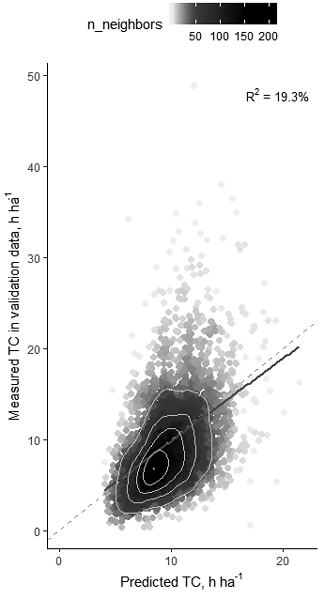
Fig. 6. Measured time consumption (TC) in PCT in validation data compared to forest resource data (FRD) based predictions (Model 1). Solid grey line is the regression line between the variables, dashed grey line is the diagonal where measured and predicted values are equal. The density of plots is illustrated with a density index as numbers of near neighbors (n_neighbors) and density based contours are marked with light grey contour lines each representing 20% share of the worksites, the outermost contour includes 80% of the observations.
3.2 Comparing the FRD and WSC-based models
In the WSC-based Model 2, the removal quantity was the most important factor (F = 2055.4, p < 0.001) affecting TC of PCT (Table 6). Terrain difficulty (F = 70.2, p < 0.001) and removal type (F = 15.9, p < 0.001) were also significant, but less important predictors of TC. In the WSC-based model, 52% of unexplained variation was found at the forest worker level.
| Table 6. Linear mixed model (Model 2, Eq. 1) for the time consumption (h ha–1) in PCT based on worksite difficulty classification (N = 7595). F-values were calculated to test the significance of the categorical variables in the model. The bias correction ratio was 0.98302. | ||||
| Value | Std.Error | t-value | p | |
| Intercept | 1.2410 | 0.0480 | 25.8 | <0.001 |
| Removal quantity class, ref Sparse | F = 2055.4 | <0.001 | ||
| Easy | 0.3574 | 0.0183 | 19.5 | <0.001 |
| Normal | 0.8298 | 0.0175 | 47.4 | <0.001 |
| Difficult | 1.2944 | 0.0190 | 68.2 | <0.001 |
| Extreme | 1.5388 | 0.0330 | 46.6 | <0.001 |
| Terrain difficulty class, ref Normal | F = 70.2 | <0.001 | ||
| Difficult | 0.1018 | 0.0101 | 10.1 | <0.001 |
| Extreme | 0.2202 | 0.0272 | 8.1 | <0.001 |
| Removal type class, ref Easy | F = 15.9 | <0.001 | ||
| Normal | 0.1396 | 0.0268 | 5.2 | <0.001 |
| Difficult | 0.1946 | 0.0399 | 4.9 | <0.001 |
| Random effects at: | Variance | |||
| Forest worker level (N = 100) | 0.1202 | |||
| Year level (N = 5) | 0.0006 | |||
| Worksite level (N = 7595) | 0.1089 | |||
Using the same data set, the WSC-based Model 2 was compared to Model 3 based on FRD (the estimated parameters not shown) and having the same predictors (excluding seasonal timing) as Model 1 (Table 4). TC was slightly more precisely predicted by the WSC-variables (RMSE 4.1 h ha–1, RMSE% 43%) than by the FRD variables (RMSE 4.9 h ha–1, RMSE% 52%). The proportion of the variance explained by fixed effects was higher in WSC-based Model 2 (R2 = 43.0%) than in FRD-based Model 3 (R2 = 18.6%).
4 Discussion
This study presented models for time consumption (TC) in pre-commercial thinning (PCT) in Finland. The data used in modelling cover – and the TC model can be considered as valid in – a large part of the forest land used in wood production in Finland (Fig. 1). Model 1 was based on variables available in forest resources data (FRD) without field assessment prior to PCT. Model 2 was prepared as a function of work difficulty factors currently field-assessed in worksite classification (WSC). The aims were to quantify the relationship between TC and variables used as predictors and to compare the precision of two modelling approaches. The TC models, especially the FRD-based one were intended to facilitate the predictions of the labour costs of PCT in forest information systems.
Both FRD and WSC-variables used as predictors in Model 1 and 2, respectively, explained significantly the variation in the TC in PCT. The field-assessed work difficulty factors (Model 2) were able to describe TC in PCT slightly more precisely than stand, site and management variables available in forest resources data (Model 1). However, an advantage of using Model 1 is that it can be applied without field assessment prior to PCT. In addition, the assessment of work difficulty factors involves uncertainties and between-assessor variability, which were not examined in this study.
TC increased with stand age as expected (Kaila et al. 2006; Miina and Saksa 2013a; Uotila et al. 2014; Fahlvik et al. 2018). However, in this study, the annual increase in TC was lower than reported in earlier studies, especially in previously unmanaged stands (Fig. 2). Furthermore, PCT in previously unmanaged stands took less time to conduct than PCT in previously managed stands, if the previous juvenile stand management had been at a very early stage of the rotation. This finding contrast with earlier studies which reported that early cleaning (previous JSM) will decrease the costs of the following PCT (Miina and Saksa 2013a; Uotila and Saksa 2014; Uotila et al. 2014).
The cross-sectional data and silvicultural decision on the need for and timing of PCT helped explain our results. Forest officers have proposed the earlier timing of the previous JSM (early cleaning, initial PCT) in stands having abundant removal and an urgent need for PCT, and correspondingly, proposed the later timing of PCT in stands with less competition from undesired broadleaves. Consequently, at the worksites that previously had JSM, the current PCT was probably more time consuming than it would have been without the previous JSM. However, when the postponement of PCT occurs due to a few competing broadleaves, the TC in PCT as an average in cross-sectional data appears to be lower than in previously managed stands (Fig. 2). Our assumption is supported by our observation that TC increased more rapidly in previously managed stands.
Due to the aforementioned reasons, Model 1 cannot be used to ‘optimise’ the need for and timing of the initial PCT. However, the model would be valid for estimating TC in previously managed stands, if the PCT-protocols are consistent with those applied at the worksites used in this study. In addition to the early timing of PCT, more intensive soil preparation method (e.g. ditch-mounding) and planting would also indicate that the site was expected to be occupied by abundant broadleaves during establishment. However, the model should not be used to predict the TC in PCT in situations that are rare in the modelling data (e.g. spruce planting on poor sites) or that are not feasible in practice (e.g. direct seeding without soil preparation).
The effects of site area and site type on TC of PCT were logical. The effect of the size of worksite on the TC indicates that small worksites had a higher TC, because the time needed to prepare and close out a worksite takes proportionally more time on small worksites. The effect of site type was congruent to that reported in Uotila et al. (2014).
The modelling revealed a significant and logical effect of the seasonal timing of PCT on TC. The TC in PCT was at its highest in summer when the flora is fully in leaf, and at its lowest in spring during the time period from snow melting until the full-grown leaves. In winter, snow cover presumably hindered the worker and PCT was more time-demanding.
The earlier studies of Hämäläinen and Kaila (1983) and Koskinen (2013) supported our findings that PCT took less time in spring than in summer. The effect of seasonal timing on TC could be utilized, for example, by scheduling PCT of pure pine stands with good visibility in summer, and performing early cleanings (i.e. eliminating undesired broadleaves overtopping crop trees) in spring. Currently, silvicultural service providers try to schedule removals of broadleaves in summer, because the re-growth of the stump sprouts after removal is at its weakest at that time (Stoeckler 1947; Johansson 1992; Koskinen 2013). However, PCT could be more cost-effective in spring or early summer, when it is quick to do and sprouting of stumps is not as intense as that following PCT in late autumn or winter (Johansson 1992).
Topographic wetness index (TWI) had a logical effect on TC. For example, TC in PCT increased with increasing TWI which supports the findings of Uotila et al. (2012) that excessive wetness increased the need for an early release treatment.
The effect of terrain steepness was found to be non-significant in modelling. Presumably mild to moderate steepness does not affect the productivity of PCT (Hämäläinen and Kaila 1983), and moreover, terrains extremely hard to traverse for a forest worker may be left unmanaged. However, the effects of terrain steepness, stoniness, etc., should be studied in more detail in the future studies. Ligné et al. (2015) found that steep terrains may increase TC in PCT. Moreover, in the WSC-based Model 2 the subjective terrain difficulty class, which may include also other factors than steepness, affected time consumption of PCT.
The unexplained between-forest worker variation in TC was relatively high, as had been also found with previous studies (Kaila et al. 1999; Ligné et al. 2005; Koskinen 2013). This variation indicates that the efficiency of a worker has a very big impact on TC in PCT. However, forest workers typically are a local resource, why some geographic variation may accumulate in it.
The model for TC in PCT (Model 1) fulfils most of the shortcomings noticed in the earlier models based on removal (Uotila et al. 2014; Uotila 2017). However, the precision of the model was seemingly low compared to Uotila et al. (2014), because the dependent variable of this study, the TC recorded from the worksites, includes all the variation in TC due to forest workers, worksites and implementing seasons. Day-to-day variation of worker efficiency is included in the worksite-level error term of the model. Thus, even though Model 1 had low precision statistics, we consider this model more suitable for application.
Model 1 gave unbiased errors in the modelling dataset after bias correction (Snowdon 1991). In the validation dataset, the negative bias of the predictions of Model 1 was minor, i.e. the time consumption was over-predicted by about 10 minutes per hectare. However, when applying the TC model for the forthcoming years, it should be acknowledged that there was some year-level variation in random part of the model. Yearly calibration will be needed to achieve the level of bias seen in validation. If recorded TC and independent model variables are available, the variance of the random year effects can be used in model calibration by applying the standard linear prediction theory (McCulloch et al. 2008).
Precision of the TC models based on forest resources data (FRD) was lower compared to that of the TC model based on field-assessed worksite classification (WSC-model). However, field assessment requires a decent amount of extra efforts and is more expensive to apply in estimating the TC in PCT. Thus, our modelling approach based on only variables available in forest information systems can be a suitable alternative for estimating time consumption in PCT.
The FRD-model should be preferred when profitability of the work is the key priority. There hardly is any available method providing more precise estimates of TC in PCT with the same or lower costs. However, it must be acknowledged that the variation around the estimated mean is rather high with the FRD-model as the coefficient of determination is only 20%. The FRD-model is about half as explanatory as the WSC-model (R2 = 43%), if the WSC-model is properly calibrated. Thus, field-assessed WSC should be preferred when precision of a single worksite estimate and fairness of the payment for a worker is the key priority. However, according to Lupin et al. (2019), systematic bias is typically high in field-assessed estimations of removal; workers commonly underestimate the density, but overestimate the size of the trees. This bias needs to be acknowledged and corrected to use removal based WSC estimation of TC in PCT. Moreover, combining different methods could be productive, e.g. FRD-model being the primary method to determine payment, but applying WSC if there is a dispute. In the WSC-model, removal quantity class was the most important variable. Therefore, a measure of removal density should be included as a variable in forest resources data, and thus as a predictor in the FRD-model. In the future, such updated and accurate information on young forest stands could be achieved by the use of remotely sensed data such as space borne imagery, aerial imagery or airborne laser scanning data (Korhonen et al. 2013; Wennerlund 2018; Puliti et al. 2019).
We conclude that time consumption (TC) in pre-commercial thinning (PCT) can be predicted with variables in forest resources data. Many site, stand and management variables described logically TC in PCT. The TC FRD-model was only slightly less precise than the one based on field-assessed WSC (removal quantity and type, and terrain difficulty). Our TC model could be connected to forest information systems where it would facilitate the predictions of the labour costs of PCT without field-assessing work difficulty factors.
Acknowledgements
The data of the study was obtained and analyzed in a project Development Leap in Silviculture. The project was funded by European Social Fund together with Natural Resources Institute Finland, Tornator Oyj, Forest owners association (FOA) Etelä-Savo, FOA Kangasniemi-Pieksämäki, FOA Savotta, FOA Pohjois-Karjala, and FOA Pohjois-Savo.
References
Bates D., Maechler M., Bolker B., Walker S. (2015). Fitting linear mixed-effects models using lme4. Journal of Statistical Software 67(1): 1–48. https://doi.org/10.18637/jss.v067.i01.
Bergstrand, K.-G., Lindman J., Petré E. (1986). Instruments for use in setting productivity targets for motor-manual cleaning. Forskningsstiftelsen Skogsarbeten, Redogörelse 7. 23 p. [In Swedish with English summary].
Beven K.J., Kirkby M.J. (1979). A physically based variable contributing area model of basin hydrology. Hydrolocial Science Bulletin 24(1): 43–69. https://doi.org/10.1080/02626667909491834.
Cajander A.K. (1926). The theory of forest types. Acta Forestalia Fennica 29(3). 108 p. https://doi.org/10.14214/aff.7193.
Fahlvik N. Berglund M., Holmström H., Nilsson U. (2018). Simulation of the long-term effects of different strategies for precommercial thinning in Pinus sylvestris. Scandinavian Journal of Forest Research 33(4): 347–356. https://doi.org/10.1080/02827581.2017.1383508.
Finnish Statistical Yearbook of Forestry (2014). Finnish Forest Research Institute. SVT, Agriculture, Forestry and Fishery. 428 p. http://urn.fi/URN:ISBN:978-951-40-2506-8.
Hämäläinen J., Kaila S. (1983). Taimikon perkauksen ja harvennuksen sekä uudistusalan raivauksen ajanmenekkisuhteet. [Time expenditure on cleaning and thinning of young stands and clearing of cutting areas by brush saw]. Metsätehon katsaus 16/1983. 4 p. [In Finnish].
Huuskonen S., Hynynen J. (2006). Timing and intensity of precommercial thinning and their effects on the first commercial thinning in Scots pine stands. Silva Fennica 40(4): 645–662. https://doi.org/10.14214/sf.320.
Johansson T. (1992). Sprouting of 2‐ to 5‐year old birches (Betula pubescens Ehrh. and Betula pendula Roth) in relation to stump height and felling time. Forest Ecology and Management 53(1–4): 263–281. https://doi.org/10.1016/0378-1127(92)90046-C.
Kaila S. Poikela A., Strandström M. (1999). Raivaussahatyön tuottavuus ja palkanmääritys. [Payment and productivity of forest clearing with clearing saw (brush cutter)]. Metsätehon raportti 78. 39 p. [In Finnish].
Kaila S., Kiljunen N., Miettinen A., Valkonen S. (2006). Effect of precommercial thinning on the consumption of working time in Picea abies stands in Finland. Scandinavian Journal of Forest Research 21(6): 496–504. https://doi.org/10.1080/02827580601073263.
Korhonen L., Pippuri I., Packalén P., Heikkinen V., Maltamo M., Heikkilä J. (2013). Detection of the need for seedling stand tending using high-resolution remote sensing data. Silva Fennica 47(2) article 952. 20 p. https://doi.org/10.14214/sf.952.
Koskinen H. (2013). The impact of cleaning method and time of year on the total working hour consumption and sprouting of broadleaf seedlings in planted Norway Spruce (Picea abies) stands. Master´s thesis. University of Eastern Finland, Faculty of Science and Forestry, School of Forest Sciences. 56 p. [In Finnish with English summary].
Laine J., Vasander H., Hotanen J.-P., Nousiainen H., Saarinen M., Penttilä T. (2012). Suotyypit ja turvekankaat – opas kasvupaikkojen tunnistamiseen. [Mires and drained peatlands – guide to the identification of habitats]. Metsäkustannus Oy. 160 p. [In Finnish].
Ligné D., Eliasson L., Nordfjell T. (2005). Time consumption and damage to the remaining stock in mechanised and motor manual pre-commercial thinning. Silva Fennica 39(3): 455–464. https://doi.org/10.14214/sf.379.
Luping S., Solberg S., Granhus A. (2019). Use of UAV photogrammetric data for estimation of biophysical properties in forest stands under regeneration. Remote Sensing 11(3) article233. 15 p. https://doi.org/10.3390/rs11030233.
McCulloch C.E., Searle S.R., Neuhaus J.M. (2008). Linear, generalized, and mixed models. 2nd Edition. Wiley Series in Probability and Statistics, New York. 424 p.
Miina J., Saksa T. (2013a). Perkauksen vaikutus männyn kylvö- ja luontaisen taimikon kehitykseen ja taimikonhoidon ajanmenekkiin. [The effect of early cleaning on stand growth and time consumption in PCT of natural and direct-seeded pine stands]. Metsätieteen aikakauskirja 1/2013: 33–44. [In Finnish]. https://doi.org/10.14214/ma.6030.
Miina J., Saksa T. (2013b). Predicting establishment of tree seedlings in regeneration areas of Picea abies in southern Finland. Baltic Forestry 19(2): 187–200.
Murphy P.N.C., Ogilvie J., Meng F.-R., White B., Bhatti J.S., Arp P.A. (2011). Modelling and mapping topographic variations in forest soils at high resolution: a case study. Ecological Modelling 222(14): 2314–2332. https://doi.org/10.1016/j.ecolmodel.2011.01.003.
Ojansuu R., Henttonen H. (1983). Estimation of local values of monthly mean temperature, effective temperature sum and precipitation sum from the measurements made by the Finnish Meteorological Office. Silva Fennica 17(2): 143–160. [In Finnish with English summary]. https://doi.org/10.14214/sf.a15099.
OSF (2018). Natural Resources Institute Finland, Silvicultural and forest improvement work. http://stat.luke.fi/en/silvicultural-and-forest-improvement-work.
Pettersson N. (1992). The effect on stand development of different spacing after planting and precommercial thinning in Norway spruce (Picea abies (L.) Karst.) and Scots pine (Pinus sylvestris L.) stands. Swedish University of Agricultural Sciences, Department of Forest Yield Research. Report No. 34. 17 p.
Puliti S., Solberg S., Granhus A. (2019). Use of UAV photogrammetric data for estimation of biophysical properties in forest stands under regeneration. Remote Sensing 11(3) article 233. 15 p. https://doi.org/10.3390/rs11030233.
R Core Team (2018). R: a language and environment for statistical computing. R Foundation for Statistical Computing, Vienna, Austria. http://www.R-project.org.
Salmivaara A. Launiainen S., Tuominen S., Ala-Ilomäki J., Finér L. (2017) Topographic wetness index for Finland. Natural Resources Institute Finland, Etsin research data finder. https://etsin.avointiede.fi/.
Sarvas R. (1948). A research on the regeneration of birch in south Finland. Communicationes Instituti Forestalis Fenniae 35(4). 91 p. [In Finnish with English summary].
Seibert J., Stendahl J., Sørensen R. (2007). Topographical influences on soil properties in boreal forests. Geoderma 141(1–2): 139–148. https://doi.org/10.1016/j.geoderma.2007.05.013.
Snowdon P. (1992). A ratio estimator for bias correction in logarithmic regressions. Canadian Journal of Forest Research 21(5): 720–724. https://doi.org/10.1139/x91-101.
Stoeckler J.H. (1947). When is plantation release most effective? Journal of Forestry 45: 265–271.
Uotila K. (2017). Optimization of early cleaning and precommercial thinning methods in juvenile stand management of Norway spruce stands. Dissertationes Forestales 231. 42 p. https://doi.org/10.14214/df.231.
Uotila K., Rantala J., Saksa T. (2012). Estimating the need for early cleaning in Norway spruce plantations in Finland. Silva Fennica 46(5): 683–693. https://doi.org/10.14214/sf.919.
Uotila K., Saksa T., Rantala J., Kiljunen N. (2014). Labour consumption models applied to motor-manual pre-commercial thinning in Finland. Silva Fennica 48(2) article id 982. 14 p. https://doi.org/10.14214/sf.982.
Venäläinen A., Tuomenvirta H., Pirinen P., Drebs A. (2005). A basic Finnish climate data set 1961–2000 – description and illustrations. Finnish Meteorological Institute, Reports 2005:5. 27 p.
Wennerlund L. (2018). Evaluating the need of cleaning using 3D point clouds derived from high resolution images collected with a drone. Swedish University of Agricultural Sciences. Master Thesis. 27 p.
Total of 35 references.
