Sulmaz Janfaza,
Hamed Yousefzadeh  ,
Seyed Mohammad Hosseini Nasr,
Roberto Botta,
Asad Asadi Abkenar,
Daniela Torello Marinoni
,
Seyed Mohammad Hosseini Nasr,
Roberto Botta,
Asad Asadi Abkenar,
Daniela Torello Marinoni
Genetic diversity of Castanea sativa an endangered species in the Hyrcanian forest
Janfaza S., Yousefzadeh H., Hosseini Nasr S. M., Botta R., Asadi Abkenar A., Marinoni D. T. (2017). Genetic diversity of Castanea sativa an endangered species in the Hyrcanian forest. Silva Fennica vol. 51 no. 1 article id 1705. https://doi.org/10.14214/sf.1705
Highlights
- This is the first report of genetic diversity of the few remaining populations of C. sativa in the southern limits of its distribution in Eurasia
- Low genetic diversity and high genetic differentiation among small isolated populations of C. sativa with low geographical distance represent serious genetic erosion indicators in the Hyrcanian forest, even hinting at an ongoing extinction vortex.
Abstract
Castanea sativa Mill. is one of the most endangered tree species in Iran where it is represented by small fragmented populations in the north of the country. 18 simple sequence repeat (SSR) loci (10 nuclear and 8 chloroplastic) were used to evaluate the genetic diversity and population structure of C. sativa from the Hyrcanian forest. For nuclear SSR, the number of alleles detected per locus ranged from 1 to 5 and observed heterozygosity (HO) was between 0.125 and 1.000. Analysis of molecular variance (AMOVA) indicated a high level of variation within populations (84%) and low levels between populations (16%). Based on structure analysis, the four studied populations were divided into two main clusters that have genetic distance Fst = 0.3. The Shafaroud population was separated in the first cluster, Siyahmazgi, Qalehroudkhan and Veysroud were placed in the second cluster. The UPGMA analysis confirmed the results of Structure analysis, separating the Shafaroud population from the others. The 8 chloroplast SSR loci used to screen the populations showed no polymorphism. In General, low nuclear genetic diversity, no polymorphism in cpDNA and considerable genetic differentiation among populations in short geographical distance represent a serious genetic erosion threat for C. sativa in the Hyrcanian forest, even hinting at an ongoing extinction vortex. Therefore, due to significant decline in genetic diversity, it is essential to introduce constraints protection upon the areas of distribution of all four populations of this species in Iran.
Keywords
population structure;
microsatellite markers;
sweet chestnut
- Janfaza, Department of Forestry, Sari University of Agriculture Sciences and Natural Resources, Km 9 Darya Road, P.O. Box 578, Mazandaran, Iran E-mail aristocratka_b@yahoo.com
-
Yousefzadeh,
Department of Environment, Faculty of Natural Resources and Marine Science ,Tarbiat Modares University, Noor, Mazandaran, Iran
E-mail
h.yousefzadeh@modares.ac.ir
- Hosseini Nasr, Department of Forestry, Sari University of Agriculture Sciences and Natural Resources, Km 9 Darya Road, P.O. Box 578, Mazandaran, Iran E-mail s.hosseini@sanru.ac.ir
- Botta, Dipartimento di Scienze Agrarie Forestali e Alimentari, DISAFA, Università di Torino, Via Verdi 8, 10124 Torino, Italy E-mail roberto.botta@unito.it
- Asadi Abkenar, Agricultural Research, Education and Extension Organization (AREEO) of IRAN, Agricultural Biotechnology Research Institute of Iran (RBRII), Branch of North Region, Guilan, Rasht, Iran E-mail asadiabkenarasad@gmail.com
- Marinoni, Dipartimento di Scienze Agrarie Forestali e Alimentari, DISAFA, Università di Torino, Via Verdi 8, 10124 Torino, Italy E-mail daniela.marinoni@unito.it
Received 22 September 2016 Accepted 7 December 2016 Published 10 February 2017
Views 187503
Available at https://doi.org/10.14214/sf.1705 | Download PDF

Supplementary Files
1 Introduction
The Hyrcanian forests stretch in an arc along the southern shores of the Caspian Sea from the Talish region in Azerbaijan to Golestan National Park in Iran and between latitudes in Azerbaijan Republic and in Iran (Payne and Miller 1994). Studies show that the occurrence of many Arcto-Tertiary relict elements, such as Zelkova carpinifolia (Pall.) K. Koch, Parrotia persica (DC.) C.A. Mey., and Pterocarya fraxinifolia Spach, has led biogeographers to the consensus that the Caspian forest has been an important refugium of temperate broad-leaved trees during the Quaternary glaciations (Tralau 1963; Zohary 1973; Probst 1981; Leroy and Arpe 2007). In terms of conservation and biodiversity, 44% of the total known plant species of Iran (3234 out of 7300 species; Akhani 2006) are presented in only 6% of the Iranian surface area (Hyrcanain forst). Only ca. 280 species from ca. 500 endemic and sub-endemic of Iranian vegetation are present in the Hyrcanian forest (Akhaniet al. 2010; Zarafshar et al 2010; Yousefzadeh et al 2014).
Sweet chestnut (Castanea sativa Mill.) is one of the rare and critically endangered tree species in the Hyrcanian forest (Jalili and Jamzade 1999), reported for the first time by Jazirei (1961). Unfortunately, the number of habitats and density of this species were significantly reduced due to blight fungus, livestock grazing, and seed collection by villagers (Yousefzadeh et al. 2014). Now there are only four small isolated populations of chestnut that remain in the Hyrcanian forest; they are located in the areas of Veysroud (V), Shah balut Mahaleh Lahijan (S), Shafarud (Sh) and QalehRoud khan (R) (Alipoor et al. 2015). Although the knowledge of genetic diversity is the first step to provide appropriate strategies for conservation of genetic resources, there is little information about chestnut in Iran, especially on its population genetic diversity.
The availability of DNA-based markers provides efficient and reliable means for evaluating biodiversity among plant genomes (Karp et al. 1996). Molecular markers such as random amplified polymorphic DNA (RAPD), amplified fragment length polymorphism (AFLP), simple sequence repeat (SSR) and inter-simple sequence repeat (ISSR) are frequently used for evaluating the genetic variation of plants (Baye 2012; Karp et al. 2012; Frascaroli et al. 2013; Tam et al. 2014).
Several studies were performed on different species of the genus Castanea, including C. sativa populations, using molecular markers (Yamamoto et al. 1998; Botta et al. 1999; Gobbinet al. 2007; Lang et al. 2007; Pereira-Lorenzo et al. 2011; Mellanoet al. 2012; McClearyet al. 2013); Lusini et al. (2014) estimated the genetic diversity and spatial structure of Bulgarian C. sativa populations by SSRs and indicated a generally high level of genetic diversity but little divergence among populations. Studies by Quintana et al. (2015) on C. sativa in Spain showed an unusual degree of genetic isolation. Fixation index estimates and AMOVA data are supportive of an unexpectedly high level of genetic differentiation in El Bierzo, larger than that estimated in a previous study with a broader geographical scope. Torello Marinoni et al. (2013) revealed that four gene pools contributed to the formation of the population of C. sativa in northwest Italy. Mattioni et al. (2013) studied on a large-scale the genetic diversity of C. sativa by SSR and the results showed a genetic divergence between the eastern (Greek and Turkish) and western (Italian and Spanish) populations. Two gene pools and a zone of gene introgression in Turkey were revealed. The inferred population structure showed a significant geographical correspondence with the hypothesized glacial refugia and rules out the migration of the chestnut from Turkey and Greece to Italy. The homogeneous gene pool observed in Italy and Spain may have originated from common refugia along with human-mediated colonization. Fineschi et al. (2000) studied haplotypes diversity of C. sativa by analyzing restriction fragment length polymorphism (PCR-RFLP) of chloroplast and mitochondrial genome regions; they detected no polymorphism for the single mitochondrial analyzed region, while a total of 11 different chloroplast (cp) haplotypes were scored. The distribution of the chloroplast DNA haplotypes revealed low geographical structure of the genetic diversity throughout southern European countries.
Among marker types, SSRs are attractive because they are codominant and many loci are available in comparison with isozyme/allozyme systems (Nelson 2009). SSRs have been widely used for the study of the genetic diversity of various plants with low taxonomic levels (species, populations or even clones). The objective of this study was to establish management strategies for the conservation of genetic resources of C. sativa in the Hyrcanian forest by (1) evaluating the genetic diversity and the differentiation of four small isolated populations of C. sativa, and (2) comparing the levels of genetic variability within and among C. sativa populations with the genetic diversity of plants with similar characteristics.
2 Materials and methods
2.1 Plant material, DNA extraction, simple sequence repeat (SSR) amplification and polymerase chain reaction (PCR)
Leaf samples were collected in the Hyrcanian forest from four small isolated populations of C. sativa located in the areas of Veysroud (V), Shahbalut Mahaleh Lahijan (S), Shafarud (Sh) and QalehRoud khan (R). The names of populations, geographical positions, and the number of individuals sampled per population are given in Table 1 and Fig. 1.
| Table 1. The geographical characteristics of four populations of C. sativa in Hyrcanian forest and the sample size in each population. | ||||
| Population name | Latitude, Longitude | Altitude (m a.s.l.) | Sample size (No.) | Population size (Hectare) |
| Veysroud (V) | 37°16´N, 49°15´E | 211–711 | 8 | 60 |
| Shafaroud (SH) | 37°30´N, 49°02´E | 200–360 | 8 | 50 |
| Siyahmazgi (S) | 40°97´N, 35°49´E | 290–350 | 8 | 40 |
| QaleRoudkhan (R) | 37°05´N, 49°14´E | 200–400 | 8 | 50 |
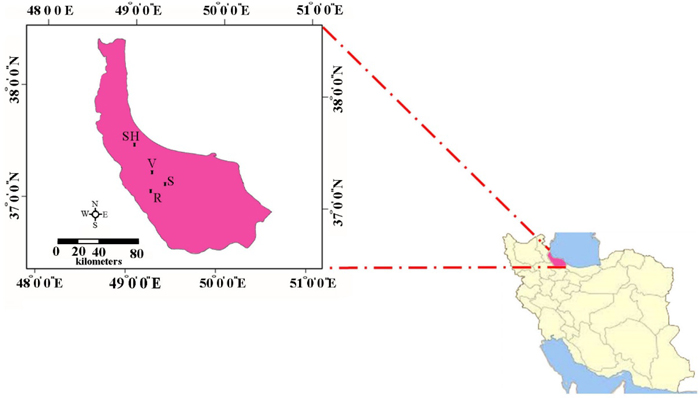
Fig. 1. The geographical positions of Hyrcanian populations of C. sativa in North of Iran. R = QalehRoudkhan region; S = SiyahMazgi region; SH = Shafaroud region; V = Veysroud region.
In order to avoid investigating clones or close relatives, sampled individuals within a population were separated by at least 30 meters. The leaves were frozen in liquid nitrogen and ground to a fine powder using a pestle and mortar. Total genomic DNA was isolated from the ground powder using a protocol adapted from Murry and Thompson (1980). Eight chloroplast SSR and 10 nuclear SSR loci (Table 2) were chosen based on their level of polymorphism for evaluating the genetic diversity of C. sativa in Hyrcanian forest.
| Table 2. Sequences of Castanea SSR primer pairs, PCR annealing temperature and PCR expected product size. | |||||||
| Marker | Number | SSR locus | Primer sequences (5’ → 3’) | Ta (°C) | Size of alleles (bp) | Reference | |
| NU SSR | 1 | CsCAT 1 | F | GAGAATGCCCACTTTTGCA | 54 | 177–212 | Marinoni et al. 2003 |
| R | GCTCCCTTATGGTCTCG | ||||||
| 2 | CsCAT 3 | F | CACTATTTTATCATGGACGG | 58 | 179–198 | ||
| R | CGAATTGAGAGTTCATACTC | ||||||
| 3 | CsCAT 6 | F | AGTGCTCGTGGTCAGTGAG | 54 | 199–238 | ||
| R | CAACTCTGCATGATAAC | ||||||
| 4 | CsCAT 7 | F | GAACATGATGATTGGCCTC | 54 | 179–223 | ||
| R | CCAAACATGACATATGTCCC | ||||||
| 5 | CsCAT 14 | F | CGAGGTTGTTGTTCATCATTAC | 54 | 133–151 | ||
| R | GATCTCAAGTCAAAAGGTGTC | ||||||
| 6 | CsCAT 15 | F | TTCTGCGACCTCGAAACCGA | 56 | 123–155 | ||
| R | GCTAGGGTTTTCATTTCTAG | ||||||
| 7 | CsCAT 17 | F | TTGGCTATACTTGTTCTGCAAG | 56 | 132–151 | ||
| R | GCCCCATGTTTTCTTCCATGG | ||||||
| 8 | CsCAT 41 | F | AAGTCAGCAACACCATATGC | 58 | 199–238 | ||
| R | CCCACTGTTCATGAGTTTCT | ||||||
| 9 | EMC 38 | F | TTTCCCTATTTCTAGTTTGTGATG | 58 | 227–261 | Buck et al. 2003 | |
| R | ATGGCGCTTTGGATGAAC | ||||||
| 10 | QpZAG110 | F | GGAGGCTTCCTTCAACCTACT | 54 | 207–223 | Steinkellner et al. 1997 | |
| R | GATCTCTTGTGTGCTGTATTT | ||||||
| CP SSR | 1 | CCMP2 | F | GATCCCGGACGTAATCCTG | 55 | 234 | Weising and Gardner 1999 |
| R | ATCGTACCGAGGGTTCGAAT | ||||||
| 2 | CCMP4 | F | AATGCTGAATCGAYGACCTA | 55 | 114 | ||
| R | CCAAAATATTBGGAGGACTCT | ||||||
| 3 | CCMP10 | F | TTTTTTTTTAGTGAACGTGTCA | 55 | 113 | ||
| R | TTCGTCGDCGTAGTAAATAG | ||||||
| 4 | CMCS2 | F | GAGCCATTCCCTTTTAGAAT | 55 | 141 | Sebastiani et al. 2004 | |
| R | TTGAAAACCGGTATAGTTCG | ||||||
| 5 | CMCS7 | F | AAGCGAGATGAATGAGTTTT | 55 | 205 | ||
| R | AAAATTGGATTGATTATTGACT | ||||||
| 6 | CMCS8 | F | GGTCTATTTTTCCACTCACAA | 55 | 179 | ||
| R | AGAAATAAACACCCCCATTA | ||||||
| 7 | CMCS12 | F | ATATTGGTAAAACGGCAACT | 55 | 216 | ||
| R | TTTATGGCATGAAACAACTC | ||||||
| 8 | CMCS14 | F | GGATTGTAACAAATTTTTCAGG | 55 | 176 | ||
| R | GTGCAAGGAATGTCGAACTA | ||||||
| F = forward primer; R = reverse primer; SSR = Simple sequence repeat; CP SSR = Chloroplast SSR; NU SSR = Nuclear SSR; Ta = PCR annealing temperature | |||||||
Polymerase chain reaction (PCR) was performed in 15 μl reaction volume containing 50 ng of DNA, 0.5 U Taq-DNA polymerase (AmpliTaq Gold, Applied Biosystems, Foster City, CA, USA), 2 μl of 10x PCR buffer (100 mM Tris-HCl pH 8.3, 500 mMKCl), 1.5 mM di MgCl2, 1 μl of 10% Bovine Albumin Serum (BSA), 200 μM dNTPs, 0.75 μM of each primers. Forward primers were labelled with a fluorochrome (6-FAM, HEX, NED or PET). Amplification of the DNA was performed using a Biorad (ICycler) thermocycler with the following parameters: (a) initial denaturation at 94 °C for 3 min; (b) 28 cycles of denaturation at 94 °C for 30 sec, primer annealing at the adequate temperature for each primer pair for 45 sec and extension at 72 °C for 1:30 min; (c) final extension at 72 °C for 30 min. Fragment analysis was carried out using a 3130xl Genetic Analyzer. Data and allele calling were elaborated with the software Gene Mapper.
2.2 Genetic diversity, population structure and bottleneck tests
Genetic variation assessment was conducted for individual microsatellite markers using GenAlEx 6.501 (Peakall and Smouse 2006; Peakall and Smouse 2012). Observed and expected heterozygosities (Ho, He, respectively) (Nei 1973) and number of alleles (Na) were calculated. An exact test for Hardy-Weinberg equilibrium (HWE) was calculated with GENEPOP 4.2 (Raymond and Rousset 1995; Rousset 2008). The frequency of null alleles at each locus was estimated by the square root method (Nei 1987). Analyses of molecular variance (AMOVA) were carried out in GenAlEx with two different analyses of distance, the number of different alleles (Fst) based on the infinite allele model. Gene flow parameter, Nm (the product of the effective population number and rate of migration among populations) was calculated from Fst as Nm = (1–Fst)/Fst for cpSSR data or Nm = 0.25 × (1–Fst)/Fst for the nuclear SSR data (Hamilton and Miller 2002). Rst parameter was used to measure genetic differentiation (Slatkin 1995), so as to include molecular information relating to the size of differences between the alleles in the differentiation estimates.
Genetic distance between populations was calculated according to Nei (1978). Cluster analysis based on genetic distance was performed by UPGMA (Unweighted Pair Group Method) analysis, using the Statistica software (STATSOFT Inc 1993). Genetic distances (1000 bootstraps) were computed as D = (1−proportion of shared alleles) by Microsat software (Minch 1997).
Genetic structure of populations was defined by STRUCTURE version 2.3.1 software (Pritchard et al. 2000). The admixture model was applied and allele frequencies were assumed to be correlated. Data analysis was carried out with an introduction period (burn-in) of 100 000 repeats for each hypothesis and ten trials of 205 Monte Carlo Markov Chain (MCMC) replications.
Since a better estimator of K, the number of homogeneous gene pools of origin for the population studied, is the modal value of ΔK (Evanno et al. 2005), this parameter was calculated by Structure Harvester software (Earl and vonHoldt 2011) and used to select the optimal K value.
Evidence of recent population bottlenecks was assessed using the program BOTTLENECK 1.2 (Cornuet and Luikart 1996). We used both a strict stepwise mutation model (SMM) (Kimura and Ohta 1978) and a two-phase model (TPM) (Di Rienzo et al. 1994) in which 90% of the microsatellite mutations followed the strict SMM and 10% produced multistep changes (Estoup and Cornuet 1999). In order to determine whether deviations of observed heterozygosity relative to that expected at drift-mutation equilibrium were significant (α = 0.05), Wilcoxon sign-rank tests (Luikart et al. 1998a) were applied. For a qualitative indicator of population bottlenecks (Luikart et al. 1998b), a mode-shift in allele frequency distribution was applied.
3 Results
3.1 Genetic diversity based on nuclear and chloroplast simple sequence repeat (SSR)
The analysis of 10 nuclear microsatellite primers identified a total of 114 alleles. The number of effective alleles varied from 1.000 (QpZAG110 and CsCAT3 loci) to 3.555 (EMC38 locus). The mean of expected and observed heterozygosity were 0.483 and 0.563, respectively. The highest (0.719) and lowest (monomorphic) expected heterozygosity (He) were found in loci EMC38 and QpZAG110, and in locus CsCAT3, respectively. The highest rate of the observed heterozygosity (Ho) was 1.000 (EMC38) and the lowest was 0.125 observed in loci CsCAT41, QpZAG110, CsCAT3. The lowest effective number of alleles was observed in S population (1.903) and the highest in the SH population (2.435). The average observed and expected heterozygosities in R population were 0.538 and 0.463, respectively, and in S 0.675 and 0.559, respectively. In SH population, these parameters were 0.675 and 0.559, and in V they were 0.475 and 0.477, respectively (Table 3). The results of analysis of molecular variance (AMOVA Table 4;) showed that 84% of the total genetic variation was found within populations and 16% was among populations. Also the low Φ value (0.163) related to Rst, is the indication of low differentiation between populations.
| Table 3. Genetic variability within four C. sativa populations based on SSR markers. | ||||||||||
| Marker | Pop | N | Na | Ne | I | Ho | He | UHe | F | |
| NU SSR | R | Mean | 8.000 | 3.000 | 2.142 | 0.807 | 0.538 | 0.463 | 0.494 | –0.147 |
| SE | 0.000 | 0.365 | 0.243 | 0.133 | 0.110 | 0.074 | 0.078 | 0.125 | ||
| S | Mean | 8.000 | 2.400 | 1.903 | 0.679 | 0.563 | 0.434 | 0.463 | –0.293 | |
| SE | 0.000 | 0.221 | 0.148 | 0.093 | 0.112 | 0.059 | 0.063 | 0.166 | ||
| SH | Mean | 8.000 | 3.300 | 2.435 | 0.962 | 0.675 | 0.559 | 0.597 | –0.230 | |
| SE | 0.000 | 0.213 | 0.197 | 0.081 | 0.075 | 0.044 | 0.046 | 0.130 | ||
| V | Mean | 8.000 | 2.700 | 2.174 | 0.781 | 0.475 | 0.477 | 0.508 | –0.007 | |
| SE | 0.000 | 0.260 | 0.223 | 0.122 | 0.096 | 0.073 | 0.078 | 0.115 | ||
| Total | Mean | 8.000 | 2.85 | 2.163 | 0.630 | 0.563 | 0.512 | 0.516 | –0.169 | |
| SE | 0.000 | 0.265 | 0.203 | 0.107 | 0.098 | 0.063 | 0.071 | 0.134 | ||
| NU SSR = Nuclear SSR; R = QalehRoudkhan region; S = SiyahMazgi region; SH = Shafaroud region; V = Veysroud region; N = number of individuals analyzed; Na = number of alleles; Ne = effective number of alleles; I = Shannon index; Ho = observed heterozygosity; He = expected heterozygosity; UHe = unbiased expected heterozygosity; F = F-values; SE = Standard errors | ||||||||||
| Table 4. Analyses of molecular variance (AMOVA) for four populations of C. sativa from Hyrcanian forest by Nuclear SSR (NU SSR). Statistics include sums of squared deviations (SS); mean squared deviations (MS), variance component estimates (Est. Var.), the percentage of the total variance contributed by each component; estimator of relative genetic differentiation based on fraction of total variance of allele size between two subpopulations (Rst) and the probability of obtaining a more extreme component estimate by chance alone. | ||||||
| Marker | S.O.V. | D.f | SS | MS | Est. Var. | % of Variance |
| NU SSR | Between groups | 3 | 8.305.094 | 2.768.365 | 130.923 | 16% |
| Within groups | 60 | 40.415.375 | 673.590 | 673.590 | 84% | |
| Total Sum | 63 | 48.720.469 | 804.513 | 100% | ||
| Stat | Value(Φ) | P(rand > = data) | ||||
| Rst | 0.163 | 0.010 | ||||
The 32 individuals were analysed at 8 cpSSR loci but no polymorphism was found in chloroplast SSR loci.
3.2 Genetic differentiation and population structure
Nei’s distance calculated between sites showed the maximum value (0.330) between R and V populations (Table 5), which means these two populations have the highest rate of genetic diversity; the minimum diversity (0.010) was observed between R and SH, R and S, SH and V, which is in agreement with the results provided by Fst value. Differentiation (Fst) and gene flow calculated for each locus (Appendix 2, available as a Supplementary file) showed average Fst value of 0.198 and average gene flow (Nm) = 2.590. Locus CsCAT6 had the highest Nm, 11.696, and QpZAG110 the lowest value, 0.153.
| Table 5. Pairwise estimated of Nei’s genetic distance and the calculated Fst based on 10 nuclear SSR markers among four populations of C. sativa in Hyrcanian forest. | ||||
| Population | R | S | SH | |
| Nei distance | R | 0.000 | ||
| S | 0.215 | |||
| SH | 0.237 | 0.175 | 0.000 | |
| V | 0.012 | 0.095 | 0.208 | |
| Fst | R | 0.000 | ||
| S | 0.132 | 0.000 | ||
| SH | 0.185 | 0.148 | 0.000 | |
| V | 0.034 | 0.114 | 0.163 | |
| NU SSR = Nuclear SSR; R = QalehRoudkhan region; S = SiyahMazgi region; SH = Shafaroud region; V = Veysroud region; Fst = Fixation index | ||||
The 32 chestnut individuals were further studied for population stratification using the STRUCTURE program. Nuclear SSR data were analyzed with possible cluster number (K-value) ranging from 1 to 7. A sharp signal was found at K = 3, thus indicating that three gene pools shaped the genetic structure of the population analyzed. To check the composition of each population and each individual with respect to each population, further analysis was therefore carried out based on K = 3. Structure analysis suggested differentiation grouping the genotypes in 3 gene pools, approximately matching the geographic areas for 3 out of 4 provenances (Fig. 2). In spite of the ability of STRUCTURE to separate 3 gene pools, Fst value (0.3) showed little differentiation between the populations. As STRUCTURE could not provide data for K = 1, we rejected the result showing that the population was divided into 3 groups. There was one peak in the estimate of the log-likelihood of the cluster number (L(k)) since the highest likelihood was for K = 3, and L(k) either consistently increased or showed an erratic pattern with increasing variance, with all individuals admixed and the proportion of any individual assigned to each subpopulation remaining roughly similar. The Evanno criterion, ΔK (Ganopoulos et al. 2012), was not relevant as it can only be computed for K ≥ 2 and does not enable comparison of results from K = 1. For K > 2, the value of ΔK remained close to 0in this study. The assignation of an individual to a specific gene pool was provided by a membership probability of qi (the mean proportion of ancestry). Genotypes with a membership probability lower than 70% were considered to belong to more than one gene pool. 13 genotypes (41%) showed a strong component derived from one specific gene pool (Blue color), while only 8 genotypes (25%) (Green color) resulted from different groups. The green gene pool included most trees from the SH population. The blue gene pool included most of the S trees and some of the V populations. The Red gene pool included individuals from R and V populations (Table 6). More precisely, the assignment proportions of each individual to population are reported in Fig. 3.
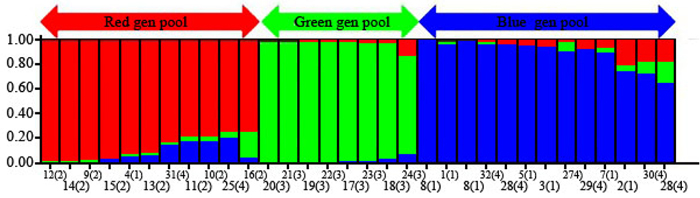
Fig. 2. Population structure of C. sativa was estimated based on Structure analysis. In the figure, the individuals of Iranian Castanea were sorted by Bayesian clustering approaches based on 10 nuclear microsatellite loci. Each bar represents a single individual analyzed. Legend of number in brackets: 1 = R1; 2 = R2; 3 = R3; 4 = R4; 5 = R5; 6 = R6; 7 = R7; 8 = R8; 9 = S1; 10 = S2; 11 = S3; 12 = S4; 13 = S5; 14 = S6; 15 = S7; 16 = S8; 17 = SH1; 18 = SH2; 19 = SH3; 20 = SH4; 21 = SH5; 22 = SH7; 23 = SH10; 24 = SH12; 25 = V1; 26 = V2; 27 = V3; 28 = V4; 29 = V5; 30 = V6; 31 = V7; 32 = V8.
| Table 6. The proportion membership of each individual of the four populations in each of the 3 gene pools identified by Structure analysis. | ||||||||||
| Sample | Structuregene pools (% inferred ancestry) | Sample | Structuregene pools (% inferred ancestry) | |||||||
| red | green | blue | red | green | blue | |||||
| 1 | R1 | 0.972 | 17 | SH1 | 0.950 | |||||
| 2 | R2 | 0.750 | 18 | SH2 | 0.930 | |||||
| 3 | R3 | 0.921 | 19 | SH3 | 0.972 | |||||
| 4 | R4 | 0.927 | 20 | SH4 | 0.976 | |||||
| 5 | R5 | 0.951 | 21 | SH5 | 0.974 | |||||
| 6 | R6 | 0.977 | 22 | SH7 | 0.967 | |||||
| 7 | R7 | 0.896 | 23 | SH10 | 0.943 | |||||
| 8 | R8 | 0.973 | 24 | SH12 | 0.803 | |||||
| 9 | S1 | 0.965 | 25 | V1 | 0.747 | |||||
| 10 | S2 | 0.784 | 26 | V2 | 0.649 | |||||
| 11 | S3 | 0.781 | 27 | V3 | 0.911 | |||||
| 12 | S4 | 0.978 | 28 | V4 | 0.956 | |||||
| 13 | S5 | 0.912 | 28 | V5 | 0.910 | |||||
| 14 | S6 | 0.973 | 30 | V6 | 0.727 | |||||
| 15 | S7 | 0.952 | 31 | V7 | 0.820 | |||||
| 16 | S8 | 0.744 | 32 | V8 | 0.964 | |||||
| R = QalehRoudkhan region; S = SiyahMazgi region; SH = Shafaroud region; V = Veysroud region | ||||||||||
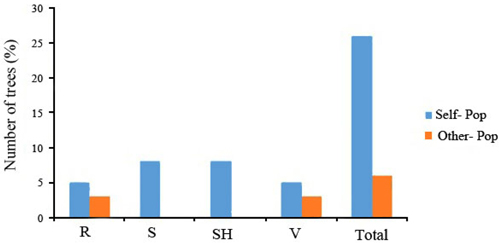
Fig. 3. Assignment percentage of individuals based on structure analysis per each population (K = 3). R = QalehRoudkhan region; S = SiyahMazgi region; SH = Shafaroud region; V = Veysroud region.
Cluster analysis (Fig. 4) separated the 4 populations into two main clusters at a genetic distance = 0.3. SH population was alone in the first cluster, S and R and V were placed in the second cluster. The UPGMA analysis thus confirmed the results of Structure analysis, separating the SH population from the others.
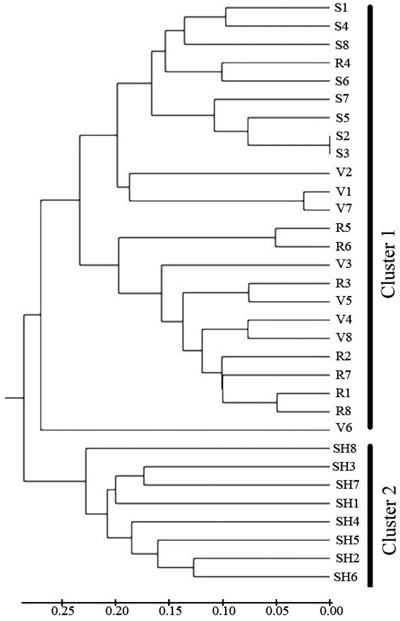
Fig. 4. Dendrogram depicting the distribution of genotypes of the four populations of C. sativa in Hyrcanian forest based on UMGMA method. R = QalehRoudkhan region; S = SiyahMazgi region; SH = Shafaroud region; V = Veysroud region.
3.3 Hardy-Weinberg equilibrium (HWE) and Bottleneck analyses
For most microsatellite loci there was no deviation from the HWE equilibrium (Appendix 1, available as a Suppl. file). Both tests (Wilcoxon and Sign) showed signs of genetic bottleneck in the V population. In this population, the number of expected loci with additional heterozygosity was 0.08 (for TPM model) and 0.034 (SMM model), which is less than the number of loci with additional observed heterozygosity in other regions (Table 7). Therefore, the null hypothesis that population is in mutation-drift equilibrium is rejected.
| Table 7. Results of BOTTLENECK tests elaborated on the four C. sativa populations analysed at 10 polymorphicnuclear microsatellite loci. | ||||||
| Test | Mutation Model | Population | ||||
| V | SH | S | R | |||
| Sign | P-value | IAM | 0.08 | 0.225 | 0.272 | 0.347 |
| SMM | 0.034* | 0.807 | 0.513 | 0.359 | ||
| TPM | 0.072 | 0.359 | 0.335 | 0.369 | ||
| Wilcoxon | P-value | IAM | 0.359 | 0.921 | 0.496 | 1.000 |
| SMM | 0.203 | 0.625 | 0.734 | 0.82 | ||
| TPM | 0.250 | 0.625 | 0.57 | 0.91 | ||
| Standardized differences | P-value | IAM | <0.001* | 0.468 | 0.003* | 0.396 |
| SMM | <0.001* | 0.272 | 0.04* | 0.057 | ||
| TPM | <0.001* | 0.114 | 0.012 | 0.208 | ||
| * Significant at level 0.05; P = Probability; IAM = Infinite allele model, TPM = Two phase model, SMM = Stepwise mutation model; R = QalehRoudkhan region; S = SiyahMazgi region; SH = Shafaroud region; V = Veysroud region | ||||||
4 Discussion
Intra-population genetic diversity is important for the long-term persistence of a species and the decrease of its extinction risk when meeting future environmental changes (Kahilainen et al. 2014). By analyzing 10 microsatellite loci we identified a total 114 alleles which shows all the loci were highly polymorphic .The number of alleles per locus in our study was less than in other related papers on Castanea species (Beccaro et al. 2012; Marinoni et al. 2003; Stilwell et al. 2003). A mean of 2.625 alleles per locus was identified from the existing literature in Castanea genetic diversity. The Na of 1.75 in our study is lower than the Na in C. sativa (A = 2.05) previously described (Huang et al. 1994). The difference is more likely due to the very small size and fragmentation of Castanea populations in Iran. The genetic consequences of these phenomenon is lack of gene flow through seed and pollination leading to many changes in alleles frequency (genetic drift) and shrinking population to alleles and genotype reduction (genetic erosion) (Oostermeijer et al. 2003). According to the map of distribution of chestnuts in the world, it is clear that Hyrcanian populations are far away from the nearest populations (Armenia), which leads to a loss of gene exchange between sites. With this direction, Yousefzadeh et al. (2014) expressed the hypothesis that the long time isolation and absence of gene flow between the Iranian population of Castanea and its nearest population may have led to the creation of different taxa of C. sativa, at least at a subspecies level in the north of Iran. Mean expected (He) and observed (Ho) heterozygosities were 0.483 and 0.563, rather close to data by Boccacci et al. (2004) on C. sativa populations in Italy, where He and Ho were 0.592 and 0.667, respectively. On the contrary the Shannon-weaver index was lower than values found in other studies on C. sativa (Beccaro et al. 2012). In fact, Beccaro et al. (2012) and Huang et al. (2012) showed a high degree of diversity, ranging in the Castanea populations between 0.647 and 0.721, in Southern Switzerland and China, respectively. In addition, the genetic variation of the Ozark chinkapin was found to be relatively high with most of the heterozygosity harbored within populations (Dane et al. 1999). Also, geographic separation and natural barriers and transportation of seeds by human beings can influence allele diversity (Alipoor et al. 2015).
The highest genetic distance was observed between V and SH populations and the lowest genetic distance was observed between R and SH populations. Since Iranian chestnut pollen is dispersed only in the local population, gene flow between the different populations of chestnut is reduced or null; this leads to isolating population and inbreeding. This factor reduces the genetic diversity and increases the similarity between chestnut populations in Hyrcanian forest. Our results agreed with the studies conducted by Villani et al. (1991) in Italy on the same species, with a lack of differentiation among chestnut populations. Lusini et al. (2014) estimated the genetic diversity and spatial structure of Bulgarian C. sativa populations by SSRs and the results indicated a generally high level of genetic diversity, but little divergence among populations. In this direction, very little genetic differentiation among Iranian populations of C. sativa was observed, except for the Siyahmazgi population. No polymorphism in chloroplasts SSR was detected.
The high similarity of C. sativa populations in Iran indicates that they very likely originated from a common ancestor gene pool. As a result, small populations developed in isolation and under inbreeding conditions, which has led to the reduction of genetic diversity of chestnuts stands and has maintained a substantially high similarity of Hyrcanian populations of chestnut in the north of Iran.
On the other hand, deviations from the HW equilibrium were observed in some of microsatellite loci, especially in EMC38. This may be due to the increase in heterozygosity of ecological mechanisms and the influence of natural selection (Freelan 2005). Both tests (Wilcoxon and Sign) in the Visrud population showed signs of genetic bottleneck. In this population, the number of expected loci with additional heterozygosity was 0.08 (for TPM model) and 0.034 (SMM model), which is less than the number of loci with additional observed heterozygosity in other regions.
5 Conclusion
High level of admixture among Castanea populations (STRUCTURE results) and pairwise genetic distances indicated a low level of genetic differentiation among C. sativa populations in the Hyrcanian forest, with slightly greater differentiation between the Shafaroud population and the other three populations. Regarding the huge loss of chestnut trees due to chestnut blight disease in the north of Iran for over 30 years, there is evidence that a genetic bottleneck has occurred. Signs of genetic bottleneck and also the very small size of the chestnut areas will lead to greater vulnerability of the Hyrcanian chestnut populations. Hence, in order to better conserve the chestnut populations in Iran, it is necessary to put a protection imposition upon the areas of their distribution.
Acknowledgements
The authors would like to thank ETKA organization Research and Development Centre for access to the sampling sites Shafaroud Company, Behrouz Karamdoost Marian and a great thanks to Elenaz Janfaza in compiling and editing this article.
References
Akhani H., Djamali M., Ghorbanalizadeh A., Ramezani E. (2010). Plant of Hyrcanian relict forests, N Iran: an overview of the flora, vegetation, paleoecology and conservation. Pakistan Journal of Botany 42: 231–258.
Alipoor S., TaheriAbkenar K., Asadi Abkenar A.,Potki P. (2015). Genetic diversity of European chestnut (Castanea sativa Mill.) in different populations of Guilan Province using SSR markers. Iranian Journal of Forest 3(7): 375–363.
Baye W. (2012). Investigation of genetic diversity in Ethiopian collections of safflower (Carthamus tinctorius) using ISSR markers. International Journal of Biochemistry and Biotechnology 4(3): 544–548.
Beccaro G.L., Torello-Marinoni D., Binelli G., Donno D., Boccacci P., Botta R., Conedera M. (2012). Insights in the chestnut genetic diversity in Canton Ticino (Southern Switzerland). Silvae Genetica 61(6): 292–300.
Boccacci P., Akkak A., Marinoni D.T., Bounous G., Botta R. (2004). Typing European chestnut (Castanea sativa Mill.) cultivars using oak simple sequence repeat markers. HortScience 39(6): 1212–1216.
Botta R., Akkak A., Marinoni D., Bounous G., Kampfer S., Steinkellner H. (1999). Evaluation of microsatellite markers for characterizing chestnut cultivars. Acta Horticulture 494: 277–280. https://doi.org/10.17660/ActaHortic.1999.494.41.
Cornuet J.M., Luikart G. (1996). Description and power analysis of two tests for detecting recent population bottlenecks from allele frequency data. Genetics 144(4): 2001–2014.
Dane F., Hawkins L.K., Huang H. (1999). Genetic variation and population structure of Castanea pumila var. ozarkensis. Journal of the American Society for Horticultural Science 124(6): 666–670.
Di Rienzo A., Peterson A.C., Garza J.C, Valdes A.-M., Slatkin M., Freimer N.B. (1994). Mutational processes of simple sequence repeat loci in human populations. Proceedings of the National Academy of Sciences 91(8): 3166–3170. https://doi.org/10.1073/pnas.91.8.3166.
Earl D.A., vonHoldt B.M. (2011) STRUCTURE HARVESTER: a website and program for visualizing STRUCTURE output andimplementing the Evanno method. Conservation Genet Resour 4(2): 359–361. https://doi.org/10.1007/s12686-011-9548-7.
Estoup A., Cornuet J.M. (1999) Microsatellite evolution: inferences from population data. In: Goldstein D, Schlötterer C. (eds.). Microsatellites: evolution and applications. Oxford University Press, New York. p. 49–65.
Evanno G., Regnaut S., Goudet J. (2005) Detecting the number of clusters of individuals using the software STRUCTURE: a simulationstudy. Molecular Ecology 14(8): 2611–2620. https://doi.org/10.1111/j.1365-294X.2005.02553.x.
Fineschi S., Taurchini D., Villani F., Vendramin G.G. (2000). Chloroplast DNA polymorphism reveals little geographical structure in Castanea sativa Mill. (Fagaceae) throughout southern European countries. Molecular Ecology 9(10): 1495–1503. https://doi.org/10.1046/j.1365-294x.2000.01029.x.
Frascaroli E., Schrag T.A., Melchinger A.E. (2013). Genetic diversity analysis of elite European maize (Zea mays L.) inbred lines using AFLP, SSR, and SNP markers reveals ascertainment bias for a subset of SNPs. Theoretical and Applied Genetics 126(1): 133–141. https://doi.org/10.1007/s00122-012-1968-6.
Freeland J.R. (2005). Molecular ecology. John Wiley and Sons Press, England. p. 63–106.
Ganopoulos I., Madesis P., Tsaftaris A. (2012). Universal ITS2 barcoding DNA region coupled with high-resolution melting (HRM) analysis for seed authentication and adulteration testing in leguminous forage and pasture species. Plant Molecular Biology Reporter 30(6): 1322–1328. https://doi.org/10.1007/s11105-012-0453-3.
Gobbin D., Hohl L., Conza L., Jermini M., Gessler C., Conedera M. (2007). Microsatellite-based characterization of the Castanea sativa cultivar heritage of southern Switzerland. Genome 50(12): 1089–1103. https://doi.org/10.1139/G07-086.
Hamilton M.B, Miller J.R. (2002). Comparing relative rates of pollen and seed gene flow in the island model using nuclear and organelle measures of population structure. Genetics 162: 1897–1909.
Huang W.G., Cheng L.L., Hu G.L., Zhou Z.J. (2012). Simple sequence repeat assessment of genetic diversity among wild populations of Chinese chestnut. SHS Acta Horticulturae 1019: V International Chestnut Symposium. p. 141–145. https://doi.org/10.17660/ActaHortic.2014.1019.21.
Jalili A., Jamzad Z. (1999). Red data book of Iran. Research Institute of Forests and Rangelands (RIFR) Publication, Tehran, Iran. 748 p.
Jazireie M.H. (1961). Chestnut (a tree for Iran). Iranian forestry press. 14 p.
Joharchi M.R., Akhani H. (2006). Notes on the flora of Iran 6: eight new plant records from Iran collected from Khorasan and Golestan provinces (N.E. Iran). Rostaniha 7:131–141.
Kahilainen A., Puurtinen M., Kotiaho J.S. (2014). Conservation implications of species–genetic diversity correlations. Global Ecology and Conservation 2: 315–23. https://doi.org/10.1016/j.gecco.2014.10.013.
Karp A., Seberg O.L.E., Buiatti M. (1996). Molecular techniques in the assessment of botanical diversity. Annals of Botany 78(2): 143–149. https://doi.org/10.1006/anbo.1996.0106.
Karp A., Ingram D.S., Isaac P.G. (eds.) (2012). Molecular tools for screening biodiversity: plants and animals. Springer Science and Business Media.
Kimura M., Ohta T. (1978). Stepwise mutation model and distribution of allelic frequencies in a finite population. Proceedings of the National Academy of Sciences 75(6): 2868–2872. https://doi.org/10.1073/pnas.75.6.2868.
Lang P., Dane F., Kubisiak T.L., Huang H. (2007). Molecular evidence for an Asian origin and a unique westward migration of species in the genus Castanea via Europe to North America. Molecular Phylogenetic and Evolution 43(1): 49–59. https://doi.org/10.1016/j.ympev.2006.07.022.
Leroy A.G.S., Arpe K. (2007). Glacial refugia for summer-green trees in Europe and south-west Asia as proposed by ECHAM3 time-slice atmospheric model simulations. Journal of Biogeography 34(12): 2115–2128. https://doi.org/10.1111/j.1365-2699.2007.01754.x.
Luikart G., Sherwin W.B., Steele B.M., Allendorf F.W. (1998a). Usefulness of molecular markers for detecting population bottlenecks via monitoring genetic change. Molecular Ecology 7: 963–974. https://doi.org/10.1046/j.1365-294x.1998.00414.x.
Luikart G., Allendorf F.W., Cornuet J.M., Sherwin B.(1998b). Distortion of allele frequency distributions provides a test for recent population bottlenecks. Journal of Heredity 89: 238–247. https://doi.org/10.1093/jhered/89.3.238.
Lusini I., Velichkov I., Pollegioni P., Chiocchini F., Hinkov G., Zlatanov T., Mattioni C. (2014). Estimating the genetic diversity and spatial structure of Bulgarian Castanea sativa populations by SSRs: implications for conservation. Conservation Genetics 15(2): 283–293. https://doi.org/10.1007/s10592-013-0537-0.
Marinoni D., Akkak A., Bounous G., Edwards K.J., Botta R. (2003). Development and characterization of microsatellite markers in Castanea sativa (Mill.). Molecular Breeding 11(2): 127–136. https://doi.org/10.1023/A:1022456013692.
Mattioni C., Martin M.A., Pollegioni P., Cherubini M., Villani F. (2013). Microsatellite markers reveal a strong geographical structure in European populations of Castanea sativa (Fagaceae): evidence for multiple glacial refugia. American Journal of Botany 100(5): 951–61. https://doi.org/10.3732/ajb.1200194.
McCleary T., McAllister M., Coggeshall M., Romero-Severson J. (2013). EST-SSR markers reveal synonymies, homonymies and relationships inconsistent with putative pedigrees in chestnut cultivars. Genetic Resources and Crop Evolution 60(4): 1209–1222. https://doi.org/10.1007/s10722-012-9912-9.
Mellano M.G., Beccaro G.L., Donno D., Torello Marinoni D., Boccacci P., Canterino S., Cerutti A.K., Bounous G. (2012). Castanea spp. biodiversity conservation: collection and characterization of the genetic diversity of an endangered species. Genetic Resources and Crop Evolution 59(8): 1727–1741. https://doi.org/10.1007/s10722-012-9794-x.
Minch E. (1997). MICROSAT version 1.5d. Department of Genetics, University of Stanford, Stanford, USA.
Murray M.G., Thompson W.F. (1980). Rapid isolation of high molecular weight plant DNA. Nucleic Acids Research 8(19): 4321–4326. https://doi.org/10.1093/nar/8.19.4321.
Nei M. (1973). Analysis of gene diversity in subdivided populations. Proceedings of the National Academy of Sciences 70(12): 3321–3. https://doi.org/10.1073/pnas.70.12.3321.
Nei M. (1978). Estimation of average heterozygocity and genetic distance from a small number of individuals. Genetics 89(3): 583–90.
Nei M. (1987). Molecular evolutionary genetics. Columbia University Press.
Nelson P.T. (2009). Genetic and phenotypic characterization of maize germplasm resources: ex-PVPA inbreds, NCSU inbreds, and elite exotic inbreds. ProQuest.
Oostermeijer J.G.B., Luijten S.H., Den Nijs J.C.M. (2003). Integrating demographic and genetic approaches in plant conservation. Biological Conservation. 113(3): 389–398. https://doi.org/10.1016/S0006-3207(03)00127-7.
Payne J.A., Miller G., Johnson G.P., Senter S.D. (1994). Castanea pumila (L.) Mill.: an underused native nut tree. HortScience 29(62): 130–131.
Peakall R., Smouse P.E. (2006). GENALEX 6: genetic analysis in Excel. Population genetic software for teaching and research. Molecular Ecology Notes 6(1): 288–295. https://doi.org/10.1111/j.1471-8286.2005.01155.x.
Peakall R., Smouse P.E. (2012) GenAlEx 6.5: genetic analysis in Excel. Population genetic software for teaching and research – an update. Bioinformatics 28(19): 2537–2539. https://doi.org/10.1093/bioinformatics/bts460.
Pereira-Lorenzo S., Costa R.M.L., Ramos-Cabrer A.M, Ciordia-Ara M., Ribeiro C.A.M., Borges O., Barreneche T. (2011). Chestnut cultivar diversification process in the Iberian Peninsula, Canary Islands, and Azores. Genome 54(4): 301–315. https://doi.org/10.1139/g10-122.
Pritchard J.K., Stephens M., Donnelly P. (2000). Inference of population structure using multilocus genotype data. Genetics 155(2): 945–959.
Probst W. (1981). Zur Vegetationsgeschichte und Klimaentwicklung des SüdkaspischenWaldgebietes (Noriran). In: Frey W., Uerpman H.-P.H. Beiträgezur Umweltgeschichte des Vorderen Orients. Beiheftezum Tübinger Atlas des Vorderen Orients, Reihe A (Naturwiss.) 8: 26–39. Dr. Ludwig Reichert, Weisbaden.
Quintana J., Contreras A., Merino I., Vinuesa A., Orozco G., Ovalle F., Gomez L. (2015). Genetic characterization of chestnut (Castanea sativa Mill.) orchards and traditional nut varieties in El Bierzo, a glacial refuge and major cultivation site in northwestern Spain. Tree Genetics & Genomes 11(1): 1–12. https://doi.org/10.1007/s11295-014-0826-x.
Raymond M., Rousset F. (1995). GENEPOP (version 1.2): population genetics software for exact tests and ecumenicism. Journal of Heredity 86(3): 248–249.
Rousset F. (2008). Genepop’007: a complete re‐implementation of the genepop software for Windows and Linux. Molecular Ecology Resources 8(1): 103–106. https://doi.org/10.1111/j.1471-8286.2007.01931.x.
STATSOFT Inc (1993). STATISTICA software.
Stilwell K.L., Wilbur H.M., Werth C.R., Taylor D.R. (2003). Heterozygote advantage in the American chestnut, Castanea dentata (Fagaceae). American Journal of Botany 90(2): 207–213. https://doi.org/10.3732/ajb.90.2.207.
Tam N.M., Duy V.D., Duc N.M., Giap V.D., Xuan B.T.T. (2014). Genetic variation in and spatial structure of natural populations of Dipterocarpus alatus (Dipterocarpaceae) determined using single sequence repeat markers. Genetics and Molecular Research 13(3): 5378–5386. https://doi.org/10.4238/2014.July.24.17.
Torello Marinoni D., Akkak A., Beltramo C., Guaraldo P., Boccacci P., Bounous G., Ferrara A.M., Ebone A., Viotto E., Botta R. (2013). Genetic and morphological characterization of chestnut (Castanea sativa Mill.) germplasm in Piedmont (north-western Italy). Tree Genetics and Genomes 9(4): 1017–1030. https://doi.org/10.1007/s11295-013-0613-0.
Tralau H. (1963). Asiatic Dicotyledonous affinities in the Cainozoic flora of Europe. Kungliga svenska vetenskapsakademiens handlingar 9(3). 87 p. + 5 plate.
Villani F., Pigliucci M., Benedettelli S., Cherubini M. (1991). Genetic differentiation among Turkish chestnut (Castanea sativa Mill.) populations. Heredity 66(1): 131–136. https://doi.org/10.1038/hdy.1991.16.
Wagner H.W., Sefc K.M. (2004). IDENTITY 4.0. Centre of Applied Genetics, University of Agricultural Sciences, Vienna, Austria,.
Yamamoto S., Urano K., Nomura T. (1998). Validation of transgenic mice harboring the human prototype c-Ha-ras gene as a bioassay model for rapid carcinogenicity testing. Toxicology Letters 102: 473–478. https://doi.org/10.1016/S0378-4274(98)00341-5.
Yousefzadeh H., Colagar A.H., Akbarzadeh F., Tippery N.P. (2014). Taxonomic status and genetic differentiation of Hyrcanian Castanea based on noncoding chloroplast DNA sequences data. Tree Genetics and Genomes 10(6): 1611–1629. https://doi.org/10.1007/s11295-014-0783-4.
Zarafshar M., Akbarinia M., Bruschi P., Hosseiny S.M., Yousefzadeh H., Taieby M., Sattarian A. (2010). Phenotypic variation in chestnut (Castanea sativa Mill.) natural populations in Hyrcanian forest (north of Iran), revealed by leaf morphometrics. Folia Oecologica 37(1):113.
Zohary M. (1973). Geobotanical foundation of the Middle East. Gustav FischeVerlag, Stuttgart, Germany.
Total of 62 references.
Send to email
