Emanuel Strieder,
Sonja Vospernik 
Intra-annual diameter growth variation of six common European tree species in pure and mixed stands
Strieder E., Vospernik S. (2021). Intra-annual diameter growth variation of six common European tree species in pure and mixed stands. Silva Fennica vol. 55 no. 4 article id 10449. https://doi.org/10.14214/sf.10449
Highlights
- 244 intra-annual growth patterns of six tree species on five sites in mixed and corresponding pure stands were analyzed
- Humid sites showed a longer growing season than dry sites
- Deciduous species showed an earlier growth culmination than conifer species
- Mixture effects were both positive and negative and clearly differed between years, indicating that climate alters mixture effects.
Abstract
Studies of intra-annual growth are particularly useful for understanding tree growth because of their high temporal resolution. This study was performed in Austria and included hourly band dendrometer data of 244 annual tree recordings from six tree species (Picea abies (L.) Karst., Pinus sylvestris L., Larix decidua Mill., Abies alba Mill., Fagus sylvatica L., Quercus spp. (Quercus petraea (Matt.) Liebl., Quercus robur L.) sampled on five sites with contrasting site conditions in pure and mixed stands and on trees of different social position. Measurements encompassed 1–7 years. Cumulative diameter increment was modelled by logistic mixed-effects models with random effects at the tree and year level. The results showed large differences in seasonal growth patterns between sites, with a clearly shorter growing season at the drier sites. Species specific response on dry sites could be linked to drought characteristics, whereas response on more humid sites was related to light requirements or successional status. The deciduous trees showed earlier growth culmination and shorter growing periods than the evergreen species. Individual tree growth of Quercus spp., P. abies, and F. sylvatica was positively affected by mixture whereas L. decidua, P. sylvestris and A. alba showed no or adverse mixture effects. Mixture effects differed between years and social position. Furthermore, increment culmination was earlier in mixed stands, but shifts were minor. Tree growth differed by social position with dominant trees showing the largest increment and the longest growth duration, with shifts in tree growth patterns due to social position being as large as those between different sites.
Keywords
growing season;
climate effects;
dendrometer;
logistic model;
mixing effect;
seasonal growth;
social tree position
-
Strieder,
Boku, University of Natural Resources and Life Sciences Vienna, Department of Forest- and Soil Sciences, Institute of Forest Growth, Peter-Jordan-Str. 82, A-1190 Vienna, Austria
 https://orcid.org/0000-0001-6398-8536
E-mail
emanuel.strieder@students.boku.ac.at
https://orcid.org/0000-0001-6398-8536
E-mail
emanuel.strieder@students.boku.ac.at
-
Vospernik,
Boku, University of Natural Resources and Life Sciences Vienna, Department of Forest- and Soil Sciences, Institute of Forest Growth, Peter-Jordan-Str. 82, A-1190 Vienna, Austria
http://orcid.org/0000-0002-4201-6444
E-mail
sonja.vospernik@boku.ac.at
Received 21 December 2020 Accepted 8 September 2021 Published 28 September 2021
Views 112640
Available at https://doi.org/10.14214/sf.10449 | Download PDF

Supplementary Files
1 Introduction
Climate change and understanding tree growth in a changing environment is an important contemporary challenge. The relationship between climate and tree growth is generally acknowledged and widely documented but it is very difficult to generalize. This is because tree growth response follows distinct seasonal patterns and the response of trees to climate is site specific (Missonen et al. 2003; Moser et al. 2010; Cocozza et al. 2016; Vospernik and Nothdurft 2018), varies between species (Bouriaud and Popa 2009; Michelot et al. 2012; Vospernik and Nothdurft 2018; Lestianška et al. 2020) and years (Vospernik and Nothdurft 2018; Pukienė et al. 2020; Szymczak 2020), depends on tree species mixture (Pretzsch et al. 2013; Metz et al. 2016; Bello et al. 2019), social position of trees (Rathgeber et al. 2011; Van der Maaten 2013), and provenance (Arend et al 2011; Kalliokoski et al. 2012). It is altered by age (Rossi et al. 2008) and density (Missonen et al. 2003; Van der Maaten 2013) and disentangling these factors remains difficult. Studies on intra-annual growth increase the understanding of these complex growth factors and can help identify species-specific periods that are most influential for tree growth and can help to mitigate climate change effects by identifying appropriate management strategies.
A common approach to measure seasonal growth is dendrometers. In particular, automatic dendrometers, registering an increase in tree diameter at a high-frequency (30 min, 60 min) are a valuable tool (Vospernik 2018; Krejca 2020). The integral signal recorded, encompasses two components: (i) irreversible radial stem growth due to accumulation of new xylem and bark tissue, and (ii) reversible stem shrinking and swelling as a result of changing water potential gradients within the stem (Zweifel et al. 2001). Because it is an integral signal, critical points of growth, such as onset, starting of late-wood formation and cessation of growth cannot be measured as precisely as with histological studies (Mäkinen et al. 2008; Cruz-García et al. 2019). Comparisons between the two methods have shown that both techniques may differ in the calculation of such dates by one–two weeks (Mäkinen et al. 2008; Cruz-García et al. 2019). Dendrometers, however, are not as cost and labor-intensive and thus a larger number of trees can be monitored over a longer-time period (Vospernik and Nothdurft 2018; Krejza et al. 2020; Szymczak 2020).
In temperate forests the onset of tree growth is triggered by increasing temperatures in spring, when day length increases (Körner and Basler 2010). Tree growth in conifers and broadleaf trees is reported to start when air temperature rises above 5 °C (Begum et al. 2007; Rossi et al. 2007) and maximum growth for many species is synchronously observed in June shortly before the summer solstice (Rossi et al. 2007; Krejza et al. 2020; Pukienė et al. 2020). For many species the period of rapid growth is quite short. For example, Pukienė et al. (2020) reported for Pinus sylvestris L. that on average over a 40-year period 53% of the total annual increase in tree diameter was recorded during the period from May 11 to June 24. The subsequent decrease in growth is associated with a decrease in day length, but the physiological mechanisms involved are not yet fully understood. Trees begin to switch from cell elongation and early wood production to the formation of late-wood cells and cell wall formation, which serves the maturation and lignification of cells before winter dormancy. The biological basis of tree ring formation is well described in a mini review (Rathgeber et al. 2016).
The length of the growing season depends on the site (Moser et al. 2010; Cocozza et al. 2016). In central Europe the growing season may last from 96 days near the tree line to 200 days (Moser et al. 2010; Körner 2012) and the potential growing season is reported to increase with warming climate (Menzel and Fabian 1999; Körner and Basler 2010), whereas on warmer sites the actual growing season is increasingly limited by drought (Krejza et al. 2020).
Tree species ecophysiological traits lead to a difference in climate-growth relationships. The tree species investigated in this study, Quercus petraea (Matt.) Liebl. and Quercus robur L., Fagus sylvatica L., Larix decidua Mill., Abies alba Mill., Picea abies (L.) Karst. and Pinus sylvestris L. are widely distributed across Europe and represent different species in terms of wood anatomy (conifer, diffuse-porous, ring-porous), successional status (pioneer species, intermediate and late successional), life-form, life-strategy (iso-hydric, anisohydric) and cold and drought tolerance.
Quercus robur (pedunculated oak) and Q. petraea (sessile oak) are two naturally co-occuring species of low-mid elevation deciduous forests, which naturally hybridize. They are light-demanding trees and their deep and penetrating tap roots allow them grow on xeric sites, where they mix with other drought tolerant species such as Pinus sylvestris (Eaton et al. 2016). As ring-porous trees they do not come into leaf until relatively late in the year (late April to early May), but growth of ring-porous species starts before budburst (Suzuki et al. 1996) by re-establishing the vessels for water transport.
Fagus sylvatica (European beech) is a widespread broadleaved tree in Europe at mid elevations. At lower elevations it is limited by moisture availability and drought, but it also cannot survive in too cold climate since it needs a growing season of at least 140 days. Fagus sylvatica is a late-successional species which tolerates very shady situations and grows on a wide variety of soils (Houstan-Dourant et al. 2016a). Fagus sylvatica is a diffuse porous species and the growth of F. sylvatica starts simultaneously with leave unfolding (Michelot et al. 2012; Prislan et al. 2013).
Larix decidua (European larch) is a light-demanding, pioneer species of the mountain and subalpine regions. In the Alps it grows in continental climates, with cold, dry and snowy winters, which L. decidua is able to tolerate by shedding its needles and thus avoiding foliage desiccation. Larix decidua colonizes open terrain after natural disturbances and forms pure stands at the upper tree limit. At lower elevations it can be found in mixed forests with Picea abies and Abies alba and lower down with Fagus sylvatica (Da Ronch et al. 2016). Needles appear approximately 3–4 weeks earlier than stem growth (Moser et al. 2010).
Abies alba (silver fir): is a very shade-tolerant evergreen coniferous tree mainly distributed in montane areas in Central Europe. Abies alba is rarely planted outside its natural range and it requires relatively high moisture conditions throughout the year, with mean yearly precipitation between 700 and 1800 mm and summer temperatures ranging from approximately 14 °C to 19 °C. The main limiting factors are a lack of summer heat and adequate moisture during the growing season. With its tap-root system A. alba can access more water than Picea abies and it is classified as more drought tolerant. This tree is mostly found mixed with P. abies or Pinus sylvestris at the upper distribution limit. At lower altitudes it competes with Fagus sylvatica (Mauri et al. 2016). Increment of A. alba was reported to start at the beginning of May and last till the end of September (Knott 2004).
Pinus sylvestris (Scots pine): is a pioneer species, with a pronounced frost and drought tolerance and able to grow on very poor soils, so it can be found in many ecologically diverse habitats. The needles are adapted to deal with cold and drought, having imbedded stomata and a waxy layer on the thick-walled epidermis to protect the needle from water loss. It requires a period of winter chilling to break autumn dormancy, and starts to grow in spring when temperatures reach about 5 °C (Houstan-Douarant et al. 2016b). Several studies of Scots pine wood formation indicated the maximum daily growth rate from the second half of May in France (Michelot et al. 2012) to the second half of June in Finland (Seo et al. 2011).
Picea abies (Norway spruce), which naturally dominates the boreal forests and subalpine areas in Europe, has a long tradition in cultivation because of its high yield performance in different site conditions. It can occur in pure stands and a variety of mixed stands. It can appear in stunted form at the tree line and grows well on a variety of soils but outside its natural range it is particularly susceptible to heat and drought because of its shallow root system. It can be a pioneer and climax species, is shade-tolerant and throughout its range shows very different phenotypes and growth patterns (Caudullo et al 2016). Growth onset and cessation for this highly adaptive species varies. At lower elevation sites onset may be as early as on Day of Year (DOY) 105–121 (Vospernik and Nothdurft 2018; Krejca 2020) and cessation was shown to range DOY 140–280 with the shorter growth duration at the more drought prone site (Krejca 2020). For Finland, Kalliokoski et al. (2012) reported an onset ranging from DOY 146–169 and cessation ranging from DOY 202–230.
Summarizing, the tree species investigated represent ecophysiologically very different tree species. Growing season is thought to be longer for the conifers (Hacke and Sperry 2001), with the possible exception of Larix decidua, because of its deciduous nature. The most drought resistant species are Quercus spp. and Pinus sylvestris. Abies alba, Fagus sylvatica and L. decidua can be classified as intermediate, whereas Picea abies is classified as susceptible to drought. Quercus spp. are thermophilic, whereas A. alba, F. sylvatica, and P. sylvestris can also be found at mid-elevations. Both P. abies and L. decidua are cold tolerant and occur at the timberline, with L. decidua being better adapted to cold environments.
With climatic warming, the essence of national adaption strategies has been to change species composition towards more drought resistant species and create mixed, structurally rich forests. Multispecies forests are expected to better cope with future ecological and economic challenges. Ecological research showed, that in mixture different tree species can positively or negatively affect each other because of the species specific differences in crown and/or root morphology (Kelty et al. 1992; Canham et al. 1994; Ammer 2019) and water and nutrient use strategy (Pretzsch and Schütze 2009; Ammer 2019). Even though numerous studies investigate stand growth in pure and mixed stands, detailed dendrometer studies in mixed-stands have not been published. Tree species mixture may, however, not only influence overall growth, but also shift seasonal patterns.
At the individual level, seasonal tree growth also markedly shifted by the social position. In general, the growth rate of dominant trees is higher than for intermediate and suppressed ones, but also cambial activity started earlier, stopped later and thus lasted longer (Rathgeber et al. 2011; Van der Maaten 2013). Due to different competitive abilities, trees of differing social position may also respond differently to environmental stresses (e.g. drought) (Pretzsch and Dieler 2011; Vospernik and Nothdurft 2018).
In this study we compared the inter-annual tree growth of (i) the tree species Picea abies, Pinus sylvestris and Larix decidua on different sites and expected it to be shorter on more drought-prone sites or at colder sites, (ii) different tree species (P. abies, P. sylvestris, Abies alba, L. decidua, Quercus spp. and Fagus sylvatica) at sites where they naturally co-occur and expect the better adapted tree species (drought or cold) to have higher growth rates and a longer growing season, (iii) trees of the species P. abies, P. sylvestris, A. alba, L. decidua, Quercus spp. and F. sylvatica in pure and mixed stands of the same species, (iv) trees on different sites for specific species and mixtures in different years (v) trees with respect to differing social positions.
2 Materials and methods
2.1 Data collection
2.1.1 Sampling stand sites, tree species, mixtures and social tree positions
The dendrometer data was collected at five research sites in Austria (Maissau, Kreisbach, Nassereith, Waidring, and Aschau). A sketch of the locations of the sampling sites is given in Fig. 1. The stand coordinates in System WGS84, EPSG: 4326 are given in Table 1. The stands were located at elevations between 400 and 1530 m above sea level, and the mean annual temperature of sites varied between 6.0 and 10.1 °C, with annual precipitation sums of 490–1580 mm. Sites were not only very diverse in elevation and climate, but also with respect to soils and geology encompassing Planosols on flysch, Cambisols on granite and rendzic soils. An overview of site characteristics is given in Table 1.
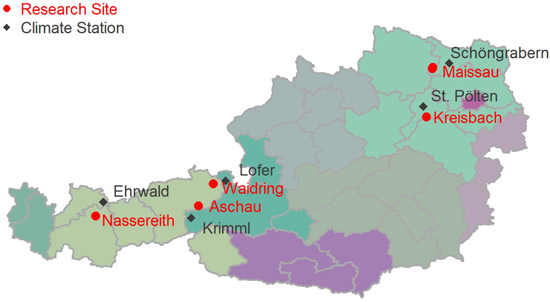
Fig. 1. Locations of intra-annual diameter growth variation research sites in Austria.
| Table 1. Site conditions and coordinates of stand sites to study intra-annual diameter growth variation. | |||||||
| Research Site | Longitude WGS84 1 | Latitude WGS84 1 | Approx. Elevation Stand (m) | Elevation Climate Station (m) | Mean Annual Temp.2 (°C) | Mean Annual Precip.2 (mm) | Geology and Soils |
| Maissau 5 | 15.81 15.80 | 48.57 48.56 | 475 | 253 | 10.1 | 490 | Granite 3 Cambisols |
| Kreisbach 1 | 15.66 | 48.09 | 500 | 274 | 9.5 | 696 | Flysch 3 Planosols |
| Kreisbach 2 | 15.66 | 48.09 | 500 | 274 | 9.5 | 696 | Flysch 3 Planosols |
| Nassereith | 10.82 | 47.27 | 880 | 982 | 6.0 | 1285 | Limestone 4 Rendzic Leptosol, Chromic Cambisols |
| Waidring | 12.51 | 47.55 | 1100 | 622 | 8.3 | 1580 | Werfen strata (Schist and dolomite) 4 |
| Aschau | 12.29 | 47.34 | 1530 | 1009 | 6.2 | 1260 | Quartz phyllit 4 Metamorphic limestone |
| 1 More precise coordinates are given in Suppl. file S8. 2 Climate data was taken from the nearest climate station. 3 Detailed soil assessment available. 4 Derived from geological maps. 5 Two sites with similar conditions were sampled. | |||||||
At each research site plots with a size of 0.15–1.75 ha were established in a mixed and the two respective monospecific stands for the studied tree species. The experiment Kreisbach 1 was established in 1998 and measurements started in 2017–2018 at the other sites. The specific mixture investigated at each site is given in Tables 2a and 2b. Note that a monospecific stand of Abies alba in Waidring and a monospecific stand of Larix decidua in Kreisbach were not sampled, because the respective stands were not present. Stands selected were mature fully stocked stands, which had not been thinned in the last 10 years. At plot establishment the following set of parameters was measured for each tree: (1) tree coordinates, (2) the initial diameter at 1.3 m (dbh), (3) the height of the tree, (4) and the height to the crown base. In Kreisbach 1 all tree characteristics were remeasured in 5-year intervals since plot establishment. In 2019 stand age, derived from increment cores sample on plots, ranged between 67 and 132 years and the standing volume was 270–860 m3 ha–1 (Tables 2a,b). Site index and mean annual volume increment at the reference age of 100 years varied considerably between different experiments with 3.9 m3 ha–1 year–1 at the least productive and 17.1 m3 ha–1 year–1 at the most productive site, but was very similar for pure and mixed stands at the same site (Tables 2a,b). Except for Picea abies in Nassereith, pure stands all had a species proportion of more than 85% of the standing volume of the respective species, in most case over 95% (Table 2b). For the mixed stands, average tree species proportions of species in mixture were between 0.13 and 0.83 but varied spatially within the comparatively large research plots. For dendrometer measurements care was taken to install dendrometers in parts with a roughly equal share of the investigated species. Dendrometers were mounted at all sites in pure and mixed stands on trees of the following social positions: (1) dominant trees (90th percentile of basal area or stem number distribution), (2) intermediate trees (50th percentile of basal area or stem number distribution) and (3) suppressed trees (10th percentile of basal area or stem number distribution). Percentiles were calculated across species in pure and mixed stands, to assure that dendrometers for both tree species present were mounted on trees with similar competitive status. Dendrometer measurements are available for all sites for the years 2018 and 2019 except Kreisbach 1 where measurements were available for the seven years 2013–2019 (Table 1). The number of trees sampled in mixed stands is given in Table 2a. In Table 2b the number of trees sampled is given for monospecific stands.
| Table 2a. Tree species sampled on mixed stands to study annual diameter growth variation. | |||||||
| Research Site | Species | Plot Area (ha) | No. of Trees sampled | Volume (m3 ha–1) | Prop Volume | MAI 2,3 (m3 ha–1 a–1) | Site Index 3 (m) |
| Maissau | Quercus spp. + | 1.75 | 12 | 301 | 0.61 | 5.8 | 24.7 |
| Pinus sylvestris | 12 | 0.31 | 4.5 | 22.6 | |||
| Kreisbach 1 | Picea abies + | 0.49 | 4 | 319 | 0.36 | 15.3 | 37.6 |
| Fagus sylvatica | 8 | 0.50 | 9.9 | 35.2 | |||
| Kreisbach 2 | Larix decidua + | 0.54 | 4 | 860 | 0.15 | 11.8 | 38.9 |
| Fagus sylvatica | 4 | 0.83 | 11.2 | 38.6 | |||
| Nassereith | Pinus sylvestris + | 0.72 | 6 | 549 | 0.35 | 8.0 | 30.0 |
| Picea abies | 6 | 0.19 | 10.0 | 31.5 | |||
| Larix decidua 1 | 6 | 0.20 | 7.5 | 29.1 | |||
| Waidring | Picea abies + | 1.30 | 6 | 467 | 0.69 | 12.6 | 35.2 |
| Abies alba | 6 | 0.13 | 14.2 | 33.7 | |||
| Aschau | Picea abies + | 0.81 | 6 | 507 | 0.37 | 8.9 | 29.6 |
| Larix decidua | 6 | 0.61 | 8.3 | 31.4 | |||
| 1 Larix decidua was sampled in mixed stands with Pinus sylvestris only. 2 MAI is the mean annual volume increment up to an age of 100 years. 3 Site index and MAI: Tree age was obtained from increment cores and 10 years to reach breast height were added. Dominant height was calculated by selecting the 100 largest trees ha–1 (Assmann 1961). In mixed stands the 100 largest trees were selected across species, which avoids underestimation of site index in mixed stands (Zingg 1994). Finally, site index was obtained from Austrian yield tables (Marshall 1975), using the respective regionally recommended yield table. | |||||||
| Table 2b. Tree species sampled on monospecific stands to study annual diameter growth variation. | |||||||
| Research Site | Species | Plot Area (ha) | No. of Trees sampled | Volume (m3 ha–1) | Prop Volume | MAI 3,4 (m3 ha–1 a–1) | Site Index 4 (m) |
| Maissau | Quercus spp. + | 1.14 | 12 | 270 | 0.96 | 5.2 | 23.2 |
| Pinus sylvestris | 0.49 | 12 | 384 | 0.91 | 3.9 | 21.2 | |
| Kreisbach 1 | Picea abies + | 0.62 | 4 | 519 | 0.90 | 17.1 | 39.6 |
| Fagus sylvatica | 0.86 | 8 | 538 | 0.96 | 10.5 | 36.4 | |
| Kreisbach 2 | Larix decidua + | - | 0 | - | - | ||
| Fagus sylvatica | 1.17 | 4 | 738 | 0.94 | 10.7 | 37.0 | |
| Nassereith | Pinus sylvestris + | 0.34 | 6 | 263 | 0.95 | 4.9 | 23.3 |
| Picea abies + | 0.15 | 6 | 544 | 0.77 | 9.16 | 30.1 | |
| Larix decidua 1 | - | 0 | - | - | |||
| Waidring | Picea abies + | 0.20 | 6 | 676 | 0.88 | 13.4 | 36.1 |
| Abies alba 2 | - | 0 | - | - | |||
| Aschau | Picea abies + | 0.42 | 6 | 700 | 0.97 | 10.4 | 32.0 |
| Larix decidua | 1.33 | 6 | 372 | 0.96 | 5.7 | 24.5 | |
| 1 Larix decidua was sampled in mixed stands with Pinus sylvestris only. 2 No samples for Abies alba in monospecific stands are available. 3 MAI is the mean annual volume increment up to an age of 100 years. 4 Site index and MAI: Tree age was obtained from increment cores and 10 years to reach breast height were added. Dominant height was calculated by selecting the 100 largest trees ha–1 (Assmann 1961). In mixed stands the 100 largest trees were selected across species, which avoids underestimation of site index in mixed stands (Zingg 1994). Finally, site index was obtained from Austrian yield tables (Marshall 1975), using the respective regionally recommended yield table. | |||||||
2.1.2 Measurement method
For this study, the dendrometer DRL 26 manufactured by EMS Brno was used. It has a rotary position sensor, a temperature sensor and a built in data logger with a precision of ≤1 µm for the dendrometer band length measurement and ±0.3 °C for the temperature sensor. According to the manufacturer’s specification there is no need to correct thermal expansion effects of the measurement tool in post processing. Depending on measurement time the batteries of the dendrometers were exchanged and a periodical adjustment of the dendrometer bands was carried out to remain within the manufacturer’s measurement range.
2.1.3 Climate data
To visualize the climate during the measurement period, a simple but effective approach is to plot climate graphs as described by Walter and Lieth (1960). Such graphs report mean annual precipitation and temperature data and frost days in one concise diagram. Details on the graph can be found in the figure caption of Fig. 2. One very useful feature of Walter and Lieth (1960) climate diagrams is that they immediately allow to identify dry and wet periods in a given year. When the blue line representing precipitation is lower than the red line representing temperature the period is considered arid (filled in dotted red vertical lines). Otherwise the period is considered wet (filled in blue vertical lines). In Fig. 2 climate graphs are plotted for two years at station “St. Pölten” using the function “diagwl” provided by the “Climatol” R-package (Guijarro 2019), showing the full climate diagram. Mini-climate diagrams from the nearest meteorological stations for all sites and measurement years are given in Fig. 3. From the climate diagrams it can be seen that for the driest site, Maissau in 2018 and 2019 there were pronounced periods of drought during the vegetation period. In Kreisbach 2013, 2014 and 2016 were moist years, whereas 2015, 2017, 2018, 2019 were comparatively dry. At all other sites monitored in 2018 and 2019, there was ample precipitation, with only a very limited dry period occurring in Waidring in 2019.
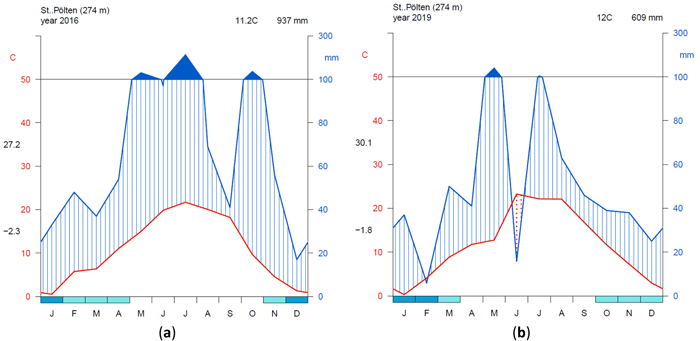
Fig. 2. Climate diagrams after Walter and Lieth (1960) using the function “diagwl” provided by the “Climatol” R-package: (a) Station St. Pölten measuring year 2016; (b) Station St. Pölten measuring year 2019. Mean monthly temperature is plotted on the y-axis and symbolized by a red line. The secondary y-axis shows mean monthly precipitation, which is symbolized by a blue line. Note that when monthly precipitation is greater than 100 mm, the scale is increased from 2 mm °C–1 to 20 mm °C–1 to avoid extremely high y-values in very wet locations. This change is indicated by a black horizontal line, and the graph over it is filled in solid blue. If the temperature line is above the precipitation line, the period is considered dry, which is indicated by red dots on the graph. If the precipitation line is above temperature line, the period is considered humid, which is indicated by blue vertical lines. The blue rectangles for each month on the x-axis indicate the likelihood of frost days. When the average daily minimum is zero or negative, frost certainly occurs and the rectangle is filled with dark blue. If it is zero or positive, the rectangle is filled with a lighter blue to indicate the probability of having frosts in that month. White rectangles indicate months with no frost days. The heading indicates the elevation of the climate station and the mean annual temperature and precipitation of the plotted year. Daily maximum average temperature of the hottest month and daily minimum average temperature of the coldest month are labeled in black at the left margin of the diagram. View larger in new window/tab.
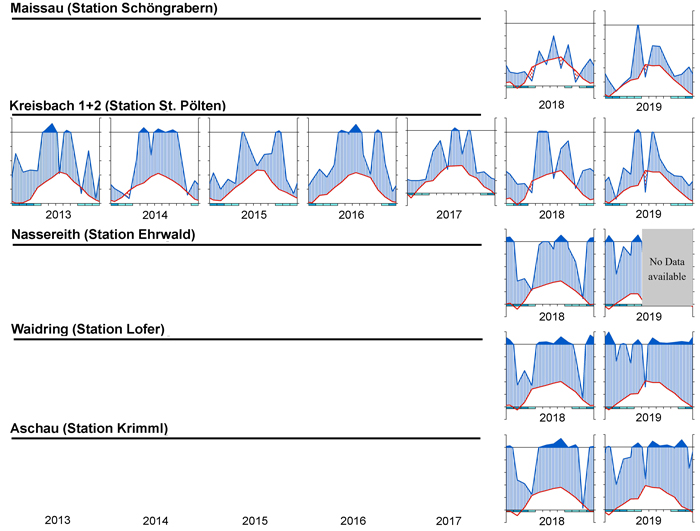
Fig. 3. Climate diagrams after Walter and Lieth (1960) for the nearest climatic station using the function “diagwl” provided by the “Climatol” R-package. Mean monthly temperature is plotted on the y-axis and symbolized by a red line. The secondary y-axis shows mean monthly precipitation, which is symbolized by a blue line. Note that when monthly precipitation is greater than 100 mm, the scale is increased from 2 mm °C–1 to 20 mm °C–1 to avoid extremely high y-values in very wet locations. This change is indicated by a black horizontal line, and the graph over it is filled in solid blue. If the temperature line is above the precipitation line, the period is considered dry, which is indicated by red dots on the graph. If the precipitation line is above the temperature line, the period is considered humid, which is indicated by blue vertical lines. The blue rectangles for each month on the x-axis indicate the likelihood for frost days. When the average daily minimum is zero or negative, frosts certainly occur and the rectangle is filled with dark blue. If it is zero or positive, the rectangle is filled with a lighter blue to indicate the probability of having frosts in that month. White rectangles indicate months with no frost days.
2.2 Model function
To model seasonal growth a three parameter logistic model which is symmetric around the inflection point was used (Eq. 1):

This model was fitted to hourly-resolution time-series data of the cumulative dbh increment starting from April 1st, which was manually set as start of the growing season. The model was chosen because it is simple and the parameters do directly describe the growth behavior of the trees. The three parameters are: The asymptote a, the time b from April 1st to the inflection point, and the scale parameter c. As can be seen from Fig. 4a the asymptote value a corresponds to the annual maximum cumulative growth in dbh. The parameter b is the time from the first of April to the inflection point. Since the curve is symmetrical, half of the cumulative growth is completed at this time. The parameter c is a time scaling parameter. At time b + c approximately 73% of the annual growth (0.73 a) is completed. At the inflection point b the curve has the highest inclination. Therefore, the mathematical derivation of Equation 1 given in Fig. 4b shows a maximum daily dbh growth rate at time b. This point is therefore the culmination point of the tree growth rate.
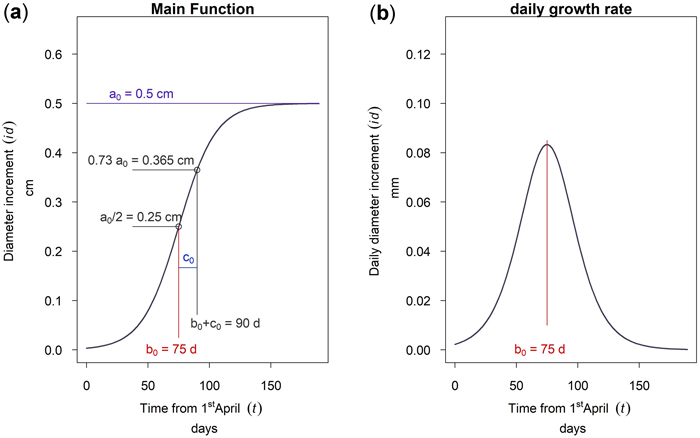
Fig. 4. Function of the 3 parameter logistic model: (a) cumulative dbh growth during the growing season; (b) daily dbh growth rate during the growing season.
As can be seen in Fig. 5a an increase of parameter a results in a vertical shift of the curve. An increasing a yields higher dbh within an unchanged growing period. A variation of parameter b shifts the growing season while the growing behavior of the tree remains unchanged, see Fig. 5b. This parameter is used to model phenological effects such as different growing seasons at different altitudes or the effect of climate variation on “early” or “late” growing years. As can be seen in Fig. 5c a variation of parameter c results in a steeper or flatter growing function, whereas the total growth in dbh and the inflection point remain unchanged. Parameter c is used to model the length of the growing period since about 23% of growth occurs within the time c and due to symmetry approximately 46% within two times c. In Fig. 6 the effect of the parameters on the daily growth rate is given. Parameter a changes the daily growth rate due to a changed maximum growth when the growing season is unchanged, see Fig. 6a. Parameter b shifts the growing period horizontally without effect to the daily growth rate, see Fig. 6b. And finally a variation in parameter c affects the daily growth rate because the growing season is varied but the cumulative dbh growth is constant, see Fig. 6c.
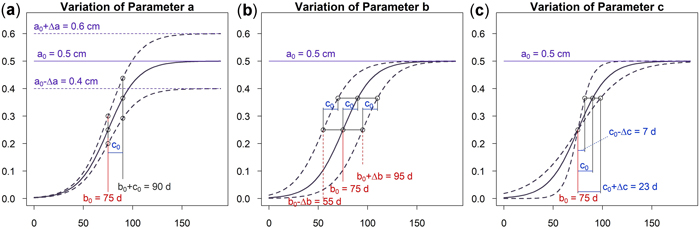
Fig. 5. Effects of the parameters on the cumulative model: (a) Parameter a changes cumulative diameter growth; (b) Parameter b to account for phenological effects; (c) Parameter c to consider the length of growth period. View larger in new window/tab.
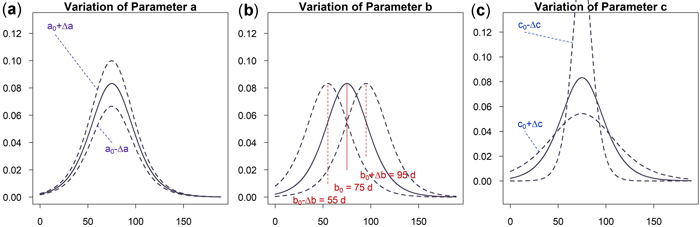
Fig. 6. Effects of the parameter on the daily growth increment: (a) Parameter a to change cumulative and incremental diameter growth; (b) Parameter b to account for phenological effects; (c) Parameter c to consider the length of growth period and vary incremental diameter growth. View larger in new window/tab.
2.2 Statistical Method
For each site a hierarchical non-linear mixed effects model was fitted because of the grouped data structure with correlations of measurements for the same tree and unknown random effects for each measurement period. The hierarchical non-linear model for the cumulative dbh increment for measurement k, in season j on tree i is:
![]()
where:
yijk = cumulative dbh increment,
f () = logistic function of a group – specific parameter vector φijk and a covariate vector vijk,
εijk = is a random variable describing additive noise.
φijk is modeled as:
![]()
where:
β = is a vector of fixed effects,
bij = is a vector of random effects associated with group ij,
Aijk = is a matrix of predictor variables,
Bijk = is the matrix for random effects.
Fitting the model was performed using the function “nlme” provided by the “Linear and Nonlinear Mixed Effects Models” R-package (Pinheiro et al. 2020). The covariates included in the model were tree species, year, mixture, social position and interactions thereof. All covariates that were significant either for asymptote parameter, inflection point or scale parameter were kept in the model.
3 Results
3.1 General results for the evaluated sites
The coefficients for the fitted models and their significance are given in the Supplementary files S1 to S6. In Suppl. file S7 model fit parameters and residuals are given.
3.2 Growth at different sites
In Fig. 7a the cumulative growth of 50th percentile Picea abies in monospecific stands is given for the year 2019 for all sites sampled. The daily dbh growth rate is given in Fig. 7b. The highest cumulative growth was found at the sites Aschau and Waidring with 0.37 and 0.32 cm, but growing season was considerably longer in Aschau. Growth in Kreisbach and Nassereith was 0.19 and 0.15 cm and thus approximately only half of that of the other sites. From Fig. 7 it can be seen that growth in Kreisbach and Aschau already started in mid-April, whereas the onset in Waidring and Nassereith was clearly later, in mid-May–June. Growth in Kreisbach culminated on DOY 150, which is the 29th of May, but only on DOY 189 in Aschau, which is the 7th of July. Growth ceased earlier in Nassereith and Kreisbach, than in Aschau and Waidring, with differences being larger than for onset and culmination of growth.
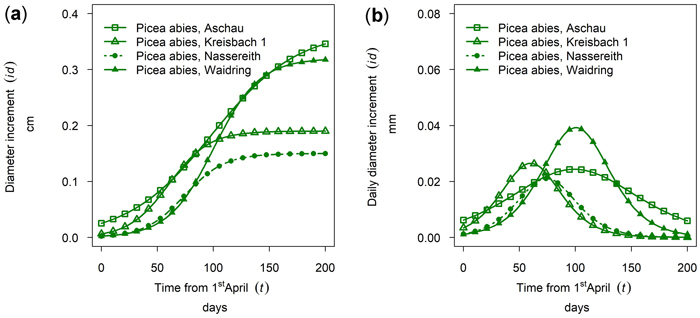
Fig. 7. Growth of mean trees of Picea abies in monospecific stands at different sites in 2019: (a) cumulative dbh growth; (b) daily dbh development. Aschau 1530 m above sea level (a.s.l.), Kreisbach 500 m a.s.l., Nassereith 880 m a.s.l., Waidring 1100 m a.s.l.
Between site differences in intra-annual growth patterns observed for Pinus sylvestris were very large. (Figs. 8a,b, cumulative growth and dbh growth rate of 50th percentile P. sylvestris in 2019). In Maissau growth of P. sylvestris started in early April, and was already completed approximately 50 days later by the end of May and maximum daily growth rates in Maissau were clearly higher than in Nassereith, where growth also started in early April but continued till October.
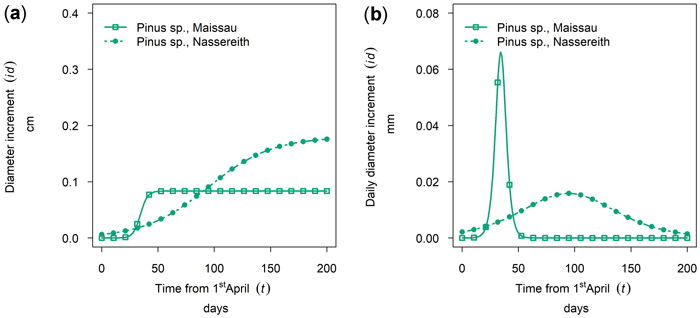
Fig. 8. Growth of Pinus sylvestris in monospecific stands at different sites in 2019: (a) cumulative dbh growth during the growing season; (b) daily dbh development rate during the growing season. Maissau: 450 m above sea level - dry site; Nassreith: 880 m above sea level - humid site.
Larix decidua showed a considerably lower cumulative growth in Aschau than in Nassereith. At both sites, tree growth started early, and in Nassereith it culminated in mid-May, whereas the culmination was at the beginning of July in Aschau (see Fig. 9). At the third Larix site, Kreisbach, the growth period of L. decidua was very short but had a high daily diameter increment with respect to the other sites.
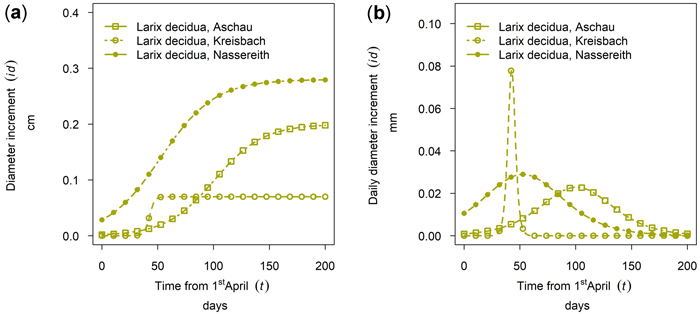
Fig. 9. Growth of Larix decidua in 2019 for 90th percentile (stem diameter) trees at different sites: (a) cumulative dbh growth during the growing season (b) daily dbh development during the growing season. Aschau 1530 m above sea level (a.s.l.), Kreisbach 500 m a.s.l., Nassereith 880 m a.s.l.
3.3 Growth of different tree species in pure and mixed stands
Tree specific differences in growth as well as mixture effects for one or both species were observed at all sites, except for Nassereith, where species specific effects were observed, but where we could not provide evidence for mixture effects.
At the driest site, Maissau, growth of Quercus spp. started in early April and the onset of growth for Pinus sylvestris was later (Fig. 10 a,b - 50th percentile of year 2019). The growing period of P. sylvestris was shorter than that of Quercus spp. but reached a higher daily growth rate. A higher cumulative growth could be measured for Quercus in mixed stands and tree growth culmination was postponed and the growing season was extended in relation to pure stocks. This shifted growing season was only observed in 2019, so there might be between yearly differences as described for several monitoring years on Fagus sylvatica and Picea abies in section 3.5. In contrast, the cumulative growth and timing and length of the growing season of Pinus was almost the same for mixed and monospecific trees.
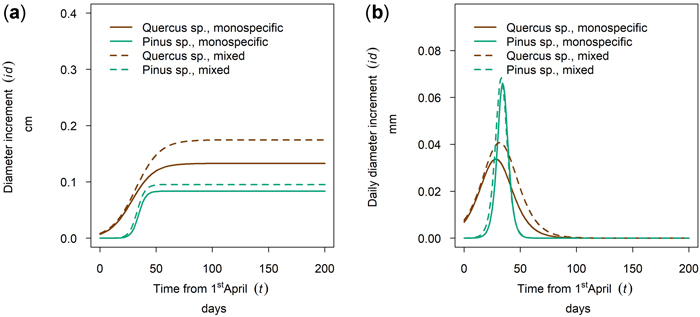
Fig. 10. Modeled growth of Pinus sylvestris and Quercus spp. in mixture and monospecific on a dry low-altitude site: (a) cumulative dbh growth during the growing season 2019; (b) daily dbh development during the growing season 2019.
In Kreisbach in 2019 a higher increment was observed for Fagus sylvatica than for Picea abies and the better growth was observed for the pure stands (Fig. 11a). Onset of growth for both species was simultaneous and occurred at the beginning of May with growth of P. abies culminating earlier than that of F. sylvatica and growth in mixed stands culminating before the pure stands. The earlier culmination of P. abies in 2019 (Fig. 11b) is rather an exception as will be shown in 3.5. This section demonstrates that species and mixture patterns vary between years in both order and magnitude.
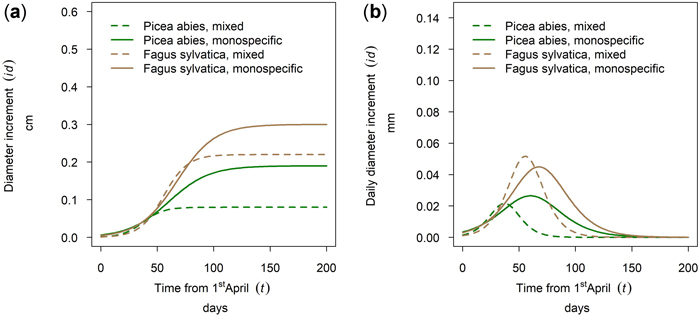
Fig. 11. Modeled growth of Picea abies and Fagus sylvatica in mixture and monospecific stands on a low-altitude site: (a) cumulative dbh growth during the growing season 2019; (b) daily dbh development during the growing season 2019.
The tree species Larix decidua and Fagus sylvatica were also sampled at the same site (Kreisbach 2). The specific annual growth of L. decidua was relatively low compared to F. sylvatica and the culmination point was reached much earlier for L. decidua than for F. sylvatica (Fig. 12b). For suppressed and intermediate F. sylvatica trees cumulative annual tree growth was highly increased in mixed stands with L. decidua, while the opposite is true for dominating F. sylvatica trees (Fig. 12a).
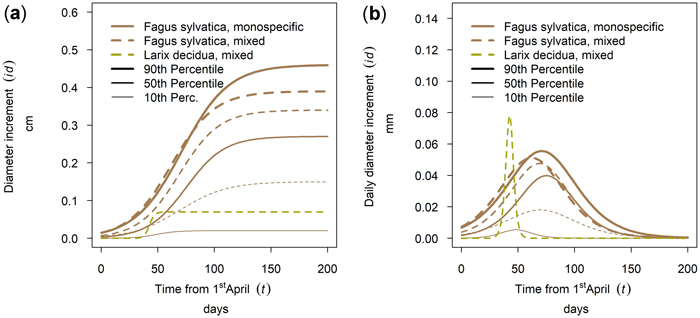
Fig. 12. Modeled growth of Fagus sylvatica in mixture with Larix decidua and in monospecific stands on the low-altitude site Kreisbach: (a) cumulative dbh growth during the growing season 2018; (b) daily dbh development during the growing season 2018.
In Fig. 9 the 50th percentile of year 2019 is plotted for Nassereith, where Pinus sylvestris, Picea abies and Larix decidua were sampled. The tree species differed in terms of cumulative growth (Fig. 13a), but also the length and timing of the growth period varied. As can be seen from Fig. 13b L. decidua grew first followed by P. abies and the longest flattest growth behavior could be seen for P. sylvestris. All three species had distinct points of increment culmination, which were DOY 142, DOY 164 and DOY 184 for L. decidua, P. abies and P. sylvestris, respectively and thus ranged between the 21st of May and the 2nd of July.
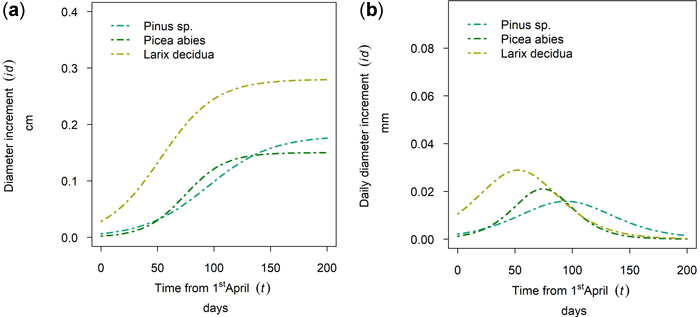
Fig. 13. Modeled growth of Pinus sylvestris, Picea abies and Larix decidua at Nassereith (880 m above sea level): (a) cumulative dbh growth during the growing season; (b) daily dbh development during the growing season.
At the site Waidring Abies alba and Picea abies were sampled. For 50th percentile trees, growth of P. abies was higher in mixed stands than in pure stands and the lowest growth was observed for A. alba. Onset, timing and length of the growing season were very similar for both tree species, with growth onset in mid-May and culmination in growth around the 5th of July (DOY 187) with minor between species differences of 5 days (Fig. 14).
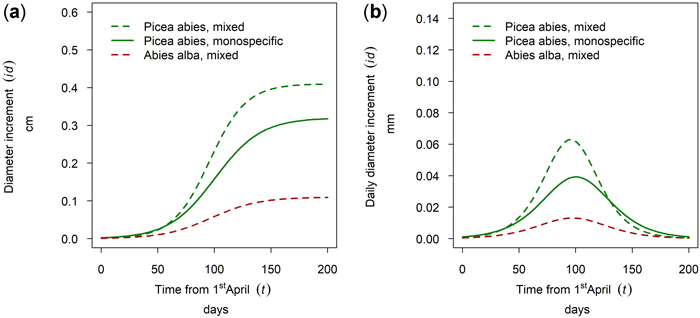
Fig. 14. Modeled growth of Picea abies and Abies alba in mixture and in monospecific stands (P. abies only) on the humid montane site Waidring: (a) cumulative dbh growth during the growing season 2019; (b) daily dbh development during the growing season 2019.
At the research site Aschau Larix decidua and Picea abies were sampled. For L. decidua no difference between mixed and monospecific stands could be found at this stand site. In contrast P. abies showed a significantly higher cumulative annual diameter growth in mixed stands than in monospecific stands whereas timing and length of the growing season was similar for both species with a late onset and culmination (Fig. 15).
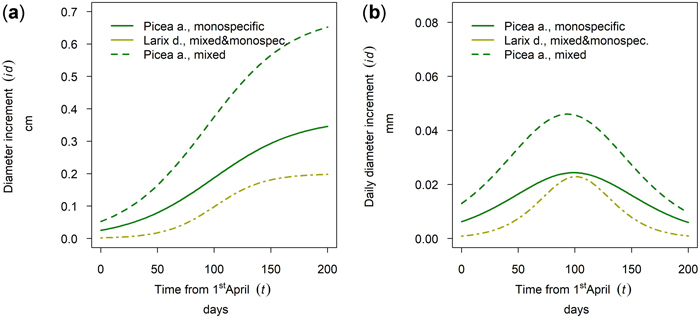
Fig. 15. Modeled growth of Picea abies in mixture and in monospecific stands and Larix decidua (joined evaluation) on the humid high elevation site Aschau: (a) cumulative dbh growth during the growing season 2019; (b) daily dbh development during the growing season 2019.
3.5 Growth in different years related to climate data
The annual growth varied for different trees species in a single stand. Also a variation between mixed and monospecific stands could be observed for different years with different climatic conditions. In Fig. 16 this phenomenon is shown. Figs. 16a–g shows the climate data as Walter and Lieth (1960) diagram. The cumulative annual growth of the 90th percentile is given in Figs. 16h–n and the daily growth increment is given in Figs. 16o–u. The horizontal time axes for Figs. 16h–u was chosen to match the climate diagram for the whole year instead of the growing season. Depending on the year, it could be seen that the highest cumulative growth (Fig. 16i) was achieved in the humid year 2014 (Fig. 16b) which also had a long growing period (Fig. 16p). The arid phases in the years 2018 and 2019 seemed to lead to a reduced cumulative growth especially in mixed stands (dashed lines). Also the growth period was shorter and earlier. There were years where Fagus sylvatica was privileged in growth (2015, 2016, 2018) and years where Picea abies was dominating due to a longer growth period (2017) on mixed and on monospecific sites.
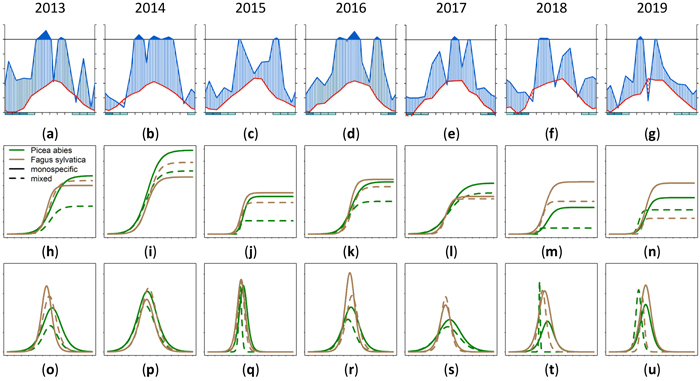
Fig. 16. Modeled growth of 90th percentile of Picea abies and Fagus sylvatica for the years 2013–2019: (a–g) climate graphs (Walter and Lieth 1960); (h–n) annual cumulative dbh growth; (o–u) daily dbh development. Climate diagrams were drawn using the function “diagwl” provided by the “Climatol” R-package. Mean monthly temperature is plotted on the y-axis and symbolized by a red line. The secondary y-axis shows mean monthly precipitation, which is symbolized by a blue line. Note that when monthly precipitation is greater than 100 mm, the scale is increased from 2 mm °C–1 to 20 mm °C–1 to avoid extremely high y-values in very wet locations. This change is indicated by a black horizontal line, and the graph over it is filled in solid blue. If the temperature line is above the precipitation line, the period is considered dry, which is indicated by red dots on the graph. If the precipitation line is above the temperature line, the period is considered humid, which is indicated by blue vertical lines. The blue rectangles for each month on the x-axis indicate the likelihood for frost days. When the average daily minimum is zero or negative, frosts certainly occur and the rectangle is filled with dark blue. If it is zero or positive, the rectangle is filled with a lighter blue to indicate the probability of having frosts in that month. White rectangles indicate months with no frost days. View larger in new window/tab.
3.6 Growth depending on the social position
The tree diameter growth within a tree species at a single site varied between trees of different social tree position. For many stands and tree species the annual growth within a tree species was ascending with tree social position, there were however exceptions for this pattern. The growth of Quercus spp. in Maissau is given in Fig. 17a. For this sample plot, the cumulative growth and the maximum daily diameter increment was ascending with the percentile and growing season length increased with increasing percentile. Whereas growth duration for dominant trees is 70 days, growth duration for suppressed trees is only 30 days (Fig. 17b).
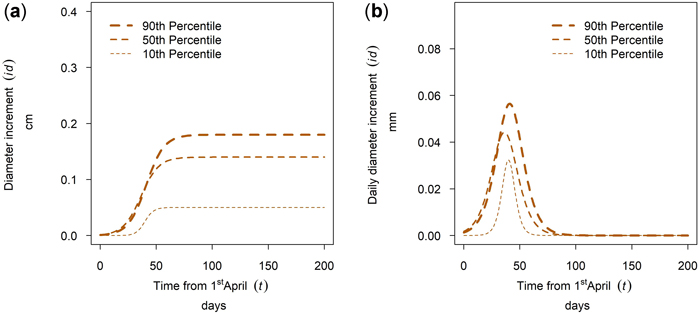
Fig. 17. Modeled intra-annual growth depending on the social position defined as the 10th, 50th and 90th percentile of the diameter distribution of the stands: (a) Cumulative growth of Quercus spp. in year 2018 for the mixed stands in Maissau; (b) Daily dbh development of Quercus spp. in year 2018 for the mixed stands in Maissau.
Fig. 18 shows intra-annual growth for Picea abies in monospecific stands at the site Kreisbach for three selected years. It can be seen that the growth of the 90th percentile and the 10th percentile behave differently in different years. The cumulative growth of the 90th percentile in year 2016 was similar to the growth in 2013. For the 10th percentile the growth of 2016 was similar to the growth in 2014. Thus, the annual climate seemed to influence the growth behavior of trees of different social positions differently.
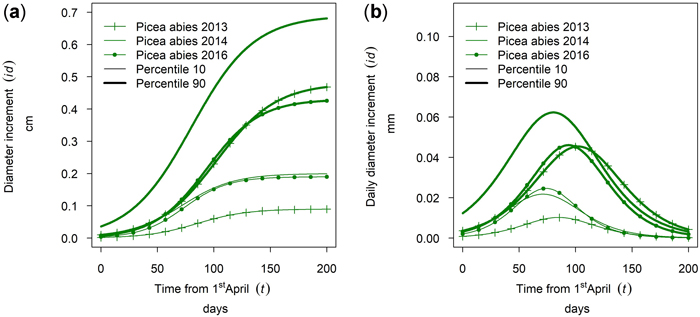
Fig. 18. Modeled intra-annual growth depending on the social position (10th and 90th percentile of the diameter distribution of the stands) and year: (a) Cumulative growth of monospecific Picea abies stands in Kreisbach; (b) Daily dbh development of P. abies in Kreisbach.
In addition, social effects varied with tree species mixture. For example, in the mixture of Picea abies and Larix decidua the effect of social position was much more pronounced in the monospecific P. abies stand, while social pressure is lower for P. abies in mixed stands with L. decidua.
4 Discussion
4.1 Growth at different sites
The period of diameter growth observed in this study is 30–200 days and is thus shorter than 100–200 days of growing season outline by Körner (2012). On dry sites, the period of actual growth, can be markedly shorter than the growing season, due to water deficit. Similarly to our observations, Krejca et al. (2020) found a decrease in growing period with increasing water deficit. Particularly dry sites in our study were Maissau and Nassereith. In Maissau, soils were deep with a good water-holding capacity, but precipitation during the growing season is scarce (Fig. 3). In Nassereith, climate was more favorable for tree growth but edaphic conditions were poor and soils were shallow rendzic soils with a poor water holding capacity. Differences between sites in onset, cessation and length of the growing season were pronounced, but similarly large differences were found when comparing results from different studies. For example, Krejza et al. (2020) reported maximum growth before the summer solstice for Picea abies in the Czech Republic, whereas for Finland a culmination past the summer solstice was reported (Jyske et al. 2014). The first pattern matches tree growth observed on the drier sites, the latter boreal pattern better matches tree growth in alpine areas. Studies of Pinus sylvestris wood formation indicated the maximum daily growth rate from the second half of May in France (Michelot et al. 2012) to the second half of June in Finland (Seo et al. 2011) showing also large between site differences. In addition, Eilmann et al. (2011) could provide evidence that nonirrigated Pinus did not only have a lower increment, but also a shorter growth period. These findings support the hypothesis of Krejza et al. (2020) that growing season is shorter on water-limited sites, even though onset of growth on these sites is early, growth at these sites slows or stops during summer because of water limitations (Krejza et al. 2020) and may be resumed in autumn but in temperate climate then temperatures start to decrease. In Mediterranean climate, however, bimodal yearly growth patterns (spring and autumn) are often observed (Szymczak et al. 2020).
Our results also show that between site differences for Picea abies and Pinus sylvestris species, are larger than within site-differences between species observed at our study sites. This shows the high adaptive potential of these two ubiquitous species also observed by Cocozza et al. (2016). Further, these results suggest it might be useful to extend the concept of species differences in life strategy (Cuny et al. 2012) to site specific life-strategies of species.
4.2 Growth of different tree species
Initiation of vessel formation in ring-porous species, such as Quercus, starts early in the year and serves water conduction. Onset of growth of Quercus in Maissau was in early April before Pinus and these results agree with findings of Michelot et al. (2012), who found that by the end of April 30% of the total ring-width was already developed by Quercus, but only 1% for Pinus. As reported by Michelot et al. (2012) growth of Quercus also culminated early and finished earlier than that of Pinus sylvestris, but the longer growing period reported for P. sylvestris than for Quercus spp. (Michelot et al. 2012), is in contrast to our findings in Maissau. The longer growth period for Quercus species in our study might be due to the better drought tolerance of Quercus in comparison to P. sylvestris (Trouvé et al. 2017; Nothdurft and Engel 2020). Quercus spp. have a deep-penetrating root system, which enables them to maintain relatively high predawn water potentials during drought (Abrams 1990). Also, Quercus spp. have thick leaves and some have relatively small stomata, both characteristics that favor high water use efficiency (Abrams 1990). Quercus is an anisohydric tree species and would maintain photosynthesis longer than the iso-hydric species P. sylvestris.
At site Kreisbach, which is the second driest site observed, Picea abies and Larix decidua are considered non-native tree species whereas Fagus sylvatica is within its natural range. Nevertheless, growth of F. sylvatica was reduced by summer drought, which was as also reported by Geßler et al. (2007) and Ježík et al. (2011). Growth reductions, however, for F. sylvatica were considerably smaller than for P. abies because of its lower drought sensitivity (Flury 1926; Schober 1951; Pretzsch et al. 2013). Picea abies was reported to show a strong response even to short term water deficit, immediately closing its stomata (Brinkmann et al. 2016). Fagus sylvatica has a deeper rooting system, with access to deeper soil layers and keeps its stomata open for a longer time (Hartl-Meier et al. 2014; Brinkmann et al. 2016). Thus with increasing climate warming, productivity of this site will be reduced and P. abies may become increasingly outcompeted by F. sylvatica. For L. decidua, the third species observed in Kreisbach, drought sensitivity is likely to be similar to that of F. sylvatica. Both F. sylvatica and L. decidua show a moderate anisohydric behavior (L. decidua: Anfodillo et al. 1998; Lévesque et al. 2013; Hartl-Meier et al. 2014; F. sylvatica: Hartl-Meier et al. 2014) and both species have a good rooting depth. These characteristics allow both species (F. sylvatica and L. decidua) to optimize photosynthetic assimilation rates in mild drought conditions. However, this response can be disadvantageous under severe drought, when cavitation of the hydraulic system can occur and it takes L. decidua long to recover from drought (Eilmann and Rigling 2012). Growing at the same site with P. abies, both species showed no response to drought when P. abies did, corroborating similar drought response for these two species as shown by Hartl-Maier (2014).
Nevertheless, Larix decidua grows less in Kreisbach than Fagus sylvatica. Larix decidua is a very light demanding pioneer species and might have a competitive disadvantage on this site in comparison to the shade-tolerant late-successional species F. sylvatica. Late successional species are more efficient in their resource utilization, which allows them to grow at higher rates and surpass early-succession species during forest closure (Cuny et al. 2012 and citations therein). As an early successional species, L. decidua also shows an earlier growth onset than F. sylvatica.
The sites Nassereith, Aschau and Waidring are in the montane and low-subalpine zone and typically for this zone, growth response to climate is weak and species specific patterns are diverse, since no single growth factor prevails (Hartl-Maier 2014; Vospernik 2020). All species observed here in our study, are within their natural distribution.
A particularly early growth onset and culmination of Larix decidua in comparison to Picea abies and Pinus sylvestris was observed at the cold and humid site Nassereith (6 °C, 1285 mm precipitation) and this early onset might be due to its better cold tolerance, early successional status or due to the deciduous nature of L. decidua. In contrast, at the very similar site Aschau (6 °C, 1260 mm), tree growth of L. decidua and P. abies was almost simultaneous, which was also observed by Rossi et al. (2008) and Oberhuber et al. (2014), but Oberhuber et al. (2014) reported a shorter growing season for L. decidua. We speculate that difference in P. abies in comparison to L. decidua between the two sites could also be due to different phenotypes/genotypes of P. abies. At the lower elevation site, P. abies grows later, whereas at the higher elevation it matches the growth pattern of L. decidua and at the latter site P. abies might be better adapted to cold environments.
At Nassereith, in the montane zone growth of Larix decidua was better than growth of Picea abies, whereas the opposite was true in Aschau at the subalpine site. The better growth of L. decidua in Nassereith on shallow rendzic soils might be due to its anisohydric nature, which allows it to maintain higher growth rates under mild drought, whereas the two iso-hydric species P. abies and Pinus sylvestris close their stomata earlier. Pinus sylvestris at this site showed a very long growing season. A similarly long yet slow growth strategy for P. sylvestris was observed by Cuny et al. (2012). At the sub-alpine site P. abies grew better than L. decidua. Shade tolerance and shallow rooting could provide a competitive advantage for this species at humid sites (Oberhuber et al. 2014).
Dominant and intermediate trees of Picea abies and Abies alba in Waidring showed rather similar growth patterns. Their long-lasting growth and their similar behavior is in line with expectations for these two late successional species on a humid site, within their overlapping natural range. Here, neither the better cold resistance of P. abies nor the higher drought tolerance of A. alba results in a competitive advantage (Lebourgeois et al. 2010; Van der Maaten-Theunissen and Bouriaud 2012), but in the future A. alba on this site might benefit from winter warming as shown by Lebourgeois et al. (2010).
4.3 Growth at mixed vs. monospecific stands
Quercus spp. and Pinus sylvestris grew better in mixture with each other at the individual tree level and this is also confirmed at the stand level, where positive mixture effects for both species were found covering a gradient of 36 sites across Europe (Steckel et al. 2020). Quercus spp. seemed to profit on poor sites, whereas P. sylvestris profited at better sites (Steckel et al. 2020). Similarly, Bello et al. (2019) reported small mixture effects for these two species. Mixture effects reported for Picea abies and Fagus sylvatica at the stand level are considerably larger (Pretzsch 2009; Pretzsch et al. 2010). In our study, at the individual tree level mainly F. sylvatica grew better in this mixture, but competitive advantages changed from year to year. This is in line with individual tree mixture effects reported for P. abies and F. sylvatica from year ring analysis at the same site (Nothdurft and Engel 2020). Picea abies in neighborhood of F. sylvatica may show tendency of higher growth of the roots compared to growth at breast height and lesser tree water deficit than P. abies in interspecific neighborhoods (Schäfer et al. 2019), but this was not reflected by better growth at this site. Both, P. abies and F. sylvatica profited from the mixture with Larix decidua, because a lot of light penetrated the crown of this tree species and because of this trait, L. decidua is seldom found in pure stands, except at the tree line, where it reaches higher elevations than other tree species because of its good frost tolerance (Da Ronch et al. 2016). Forest managers, however, add it to F. sylvatica and P. abies stands because of its valuable wood. A higher yield for P. abies in mixture with L. decidua was reported by Zöhrer (1969). Further, positive mixture effects were reported for P. abies and P. sylvestris with an increased productivity of 41% in mixtures (Bielak et al. 2014), but this could not be confirmed in Nassereith. Other research found that in mixed stands of P. abies and Abies alba at low quality sites overyielding of P. abies with high proportions is expected (Huber et al. 2014). While on high quality sites A. alba grows better in mixed stands than in pure stands (Huber et al. 2014). These results are in agreement with the positive mixture effects observed in Waidring.
The mixture results in this study largely confirm the hypothesis that mixture effects are larger for ecologically more different species, and that positive mixture effects occur due to a better utilization of site resources by two complementary species. A very interesting phenomenon is that mixture effects vary between years. The between year differences in climate shift the within-species growth, because different species have different ecological traits, which also shifts mixture effects. A similar effect is observed in studies, where mixture effects differ with site (Huber et al. 2014; Pretzsch et al. 2020), due to different climate and soil properties. In addition, in this study we could also show that mixture shifts the seasonal growth patterns, which was not demonstrated before. However, the shifts observed were rather small.
4.4 Growth in different years related to climate data
Our results showed that there is a very large variation in between year patterns. Onset and growth for different tree species are reported to vary by almost a month at the same site for all tree species observed: (Kalliokoski et al. 2012; Pukienė et al. 2020). Thus between year variation at a specific site is larger than between species variation at the same site or mixture effects. With yearly climate and due to species specific ecological traits, also the performance of different species or mixtures varies with years, which is very well illustrated in Kreisbach and confirmed by results of Lestianška et al. (2020). The detailed analysis of seasonal growth patterns gives important insight in species specific behavior and actual periods of growth, which should be refined in the future. Our study encompasses 1–7 years depending on the site, which is on some sites longer than the 1–3 (6) year observation period. The longest study on seasonal growth we found in the literature encompassed 40 years (Pukienė et al. 2020) and also showed a between-year shift of about one month at the same site. Probably observation periods of 3–5 years should be intended to capture important between year variations.
4.5 Growth depending on social position
Trees with the better social position have a higher growth rate than intermediate or suppressed trees (Franz et al. 1990; Rathgeber et al. 2011; Van der Maaten 2013) because they benefit from access to resources and larger photosynthetic capabilities (Rathgeber et al. 2011). They also have a clearly longer growing season (Linares et al. 2009; Rathgeber et al. 2011; Vospernik and Nothdurft 2018) confirmed in all studies. Such large differences in the length of the growing period should lead to important differences in many other aspects of life, functioning and adaptation capabilities of trees (Rathgeber et al. 2011) and studies on tree growth should be extended to all social classes.
5 Conclusions
This study shows that trees on different sites have a unique course of growth which depends on site, tree species, mixture, year, and social position. Largest differences were observed between sites and social position, moderate differences between years and trees species and minor shifts due to tree species mixture. The large within species differences on different sites shows the high adaptive potential of tree species and implies the importance of site specific growth analysis.
Between species reactions on the same site can help to understand response due to tree physiology and different life-strategies and helps to reveal causal relationships. Even though the present study uses a considerable amount of dendrometer measurements insight for many tree species and sites is still lacking. The knowledge about mixing effects, climate effects and their combination on growth response of tree species is even more lacking and thus dendrometer networks should be extended.
Commonly, tree growth response of dominant trees is compared in many studies. According to our results, extrapolation of their growth to the whole stand is clearly erroneous and all social classes should be taken into account, when inference on stand growth is required.
Availability of research materials and data
Both data and code are available upon reasonable request. Requests can be sent to Sonja Vospernik sonja.vospernik@boku.ac.at.
References
Abrams MD (1990) Adaptations and responses to drought in Quercus species of North America. Tree Physiol 7: 227–238. https://doi.org/10.1093/treephys/7.1-2-3-4.227.
Ammer C (2019) Diversity and forest productivity in a changing climate. New Phytol 221: 50–66. https://doi.org/10.1111/nph.15263.
Anfodillo T, Rento S, Carraro V, Furlanetto L, Urbinati C, Carrer M (1998) Tree water relations and climatic variations at the alpine timberline: seasonal changes of sap flux and xylem water potential in Larix decidua Miller, Picea abies (L.) Karst. and Pinus cembra L. Ann Forest Sci 55: 159–172. https://doi.org/10.1051/forest:19980110.
Arend M, Kuster T, Günthardt-Goerg MS, Dobbertin M (2011) Provenance-specific growth responses to drought and air warming in three European oak species (Quercus robur, Q. petraea and Q. pubescens). Tree Physiol 31: 287–297. https://doi.org/10.1093/treephys/tpr004.
Assmann E (1961) Waldertragskunde. [Forest growth and yield]. München, Bonn, Wien.
Begum S, Nakaba S, Oribe Y, Kubo T, Funada R (2007) Induction of cambial reactivation by localized heating in a deciduous hardwood hybrid poplar (Populus sieboldii × P. grandidentata). Ann Bot-London 100: 439–447. https://doi.org/10.1093/aob/mcm130.
Bello J, Vallet P, Perot T, Balandier P, Seigner V, Perreta S, Couteaua C, Korboulewsky N (2019) How do mixing tree species and stand density affect seasonal radial growth during drought events? Forest Ecol Manag 432: 436–445. https://doi.org/10.1016/j.foreco.2018.09.044.
Bielak K, Dudzinska M, Pretzsch H (2014) Mixed stands of Scots pine (Pinus sylvestris L.) and Norway spruce [Picea abies (L.) Karst] can be more productive than monocultures. Evidence from over 100 years of observation of long-term experiments. For Syst 23: 573–589. https://doi.org/10.5424/fs/2014233-06195.
Brinkmann N, Eugster W, Zweifel R, Buchmann N, Kahmen A (2016) Temperate tree species show identical response in tree water deficit but different sensitivities in sap flow to summer soil drying. Tree Physiol 36: 1508–1519. https://doi.org/10.1093/treephys/tpw062.
Bouriaud O, Popa L (2009) Comparative dendroclimatic study of Scots pine, Norway spruce and silver fir in the Vrancea Range, Eastern Carpathian Mountains. Trees 23: 95–106. https://doi.org/10.1007/s00468-008-0258-z.
Canham CD, Finzi AC, Pacala SW, Finzi AC, Pacala SW, Burbank DH (1994) Causes and consequences of resource heterogeneity in forests: interspecific variation in light transmission by canopy trees. Can J Forest Res 24: 337–349. https://doi.org/10.1139/x94-046.
Caudullo G, Tinner W, de Rigo D (2016) Picea abies in Europe: distribution, habitat, usage and threats. In: San-Miguel-Ayanz J, de Rigo D, Caudullo G, Houstan Durrant T, Mauri A (eds) European atlas of forest tree species. Publications Office of the European Union, Luxembourg, pp 114–116. https://doi.org/10.2788/4251.
Cocozza C, Palombo C, Tognetti R, La Porta N, Anichini M, Giovannelli A, Giovanni E (2016) Monitoring intra-annual dynamics of wood formation with microcores and dendrometers in Picea abies at two different altitudes. Tree Physiol 36: 832–846. https://doi.org/10.1093/treephys/tpw009.
Cruz-García R, Balzano A, Čufar K, Scharnweber T, Smiljanić M, Wilmking M (2019) Combining Dendrometer Series and Xylogenesis Imagery – DevX, a simple visualization tool to explore plant secondary growth phenology. Front For Glob Change 2, article id 60. https://doi.org/10.3389/ffgc.2019.00060.
Cuny HE, Rathgeber CBK, Lebourgeois F, Fortin M (2012) Life strategies in intra-annual dynamics of wood formation: example of three conifer species in a temperate forest in north-east France. Tree Physiol 32: 612–625. https://doi.org/10.1093/treephys/tps039.
Da Ronch F, Caudullo G, Tinner W, de Rigo D (2016) Larix decidua and other larches in Europe: distribution, habitat, usage and threats. In: San-Miguel-Ayanz J, de Rigo D, Caudullo G, Houstan Durrant T, Mauri A (eds) European atlas of forest tree species. Publications Office of the European Union, Luxembourg, pp 108–110. https://doi.org/10.2788/4251.
Eaton E, Caudullo G, Oliveira S, de Rigo D (2016) Quercus robur and Quercus petraea in Europe: distribution, habitat, usage and threats. San-Miguel-Ayanz J, de Rigo D, Caudullo G, Houstan Durrant T, Mauri A (eds) European atlas of forest tree species. Publications Office of the European Union, Luxembourg, pp 160–163. https://doi.org/10.2788/4251.
Eilmann B, Rigling A (2012) Tree-growth analyses to estimate tree species’ drought tolerance. Tree Physiol 32: 178–187. https://doi.org/10.1093/treephys/tps004.
Eilmann B, Zweifel R, Buchmann N, Graf Pannatier E, Rigling A (2011) Drought alters timing, quantity, and quality of wood formation in Scots pine. J Exp Bot 62: 2763–2771. https://doi.org/10.1093/jxb/erq443.
Flury P (1926) Über den Einfluß von Trockenperioden auf das Bestandeswachstum. [On the influence of dry periods on stand increment]. Mitt Schweiz Zentralanst Forstl Versuchswes 14: 251–292.
Franz F, Pretzsch H, Foerster W (1990) Untersuchungen zum Jahreszuwachsgang geschädigter Fichten in Südbayern. [Analysis of damaged Norway spruce in Southern Bavaria.] Forst Holz 16: 461–466.
Geßler A, Keitel C, Kreuzwieser J, Matyssek R, Seiler W, Rennenberg H (2007) Potential risks for European beech (Fagus sylvatica L.) in a changing climate. Trees 21: 1–11. https://doi.org/10.1007/s00468-006-0107-x.
Guijarro JA (2019) climatol: climate tools (series homogenization and derived products). https://cran.r-project.org/web/packages/climatol/.
Hacke UG, Sperry JS (2001) Functional and ecological xylem anatomy. Perspect Plant Ecol 4: 97–115. https://doi.org/10.1078/1433-8319-00017.
Hartl-Meier C, Zang C, Buntgen U, Esper J, Rothe A, Gottlein A, Dirnbock T, Treydte K (2014) Uniform climate sensitivity in tree-ring stable isotopes across species and sites in a mid-latitude temperate forest. Tree Physiol 35: 4–15. https://doi.org/10.1093/treephys/tpu096.
Houstan-Durrant T, de Rigo D, Caudullo G (2016a) Fagus sylvatica in Europe: distribution, habitat, usage and threats. In: San-Miguel-Ayanz J, de Rigo D, Caudullo G, Houstan Durrant T, Mauri A (eds) European atlas of forest tree species. Publications Office of the European Union, Luxembourg, pp 94–95. https://doi.org/10.2788/4251.
Houstan-Durrant T, de Rigo, D., Caudullo G (2016b) Pinus sylvestris in Europe: distribution, habitat, usage and threats. San-Miguel-Ayanz J, de Rigo D, Caudullo G, Houstan Durrant T, Mauri A (eds) European atlas of forest tree species. Publications Office of the European Union, Luxembourg, pp 132–133. https://doi.org/10.2788/4251.
Huber MO, Sterba H, Bernhard L (2014) Site conditions and definition of compositional proportion modify mixture effects in Picea abies – Abies alba stands. Can J Forest Res 44: 1281–1291. https://doi.org/10.1139/cjfr-2014-0188.
Ježík M, Blaženec M, Střelcová K, Ditmarová Ľ (2011) The impact of the 2003–2008 weather variability on intra-annual stem diameter changes of beech trees at a submontane site in central Slovakia. Dendrochronologia 29: 227–235. https://doi.org/10.1016/j.dendro.2011.01.009.
Jyske T, Mäkinen H, Kalliokoski T, Nöjda P (2014) Intra-annual tracheid production of Norway spruce and Scots pineacross a latitudinal gradient in Finland. Agr Forest Meteorol 194:241–254. https://doi.org/10.1016/j.agrformet.2014.04.015.
Kalliokoski T, Reza M, Jyske T, Mäkinen H, Nöjd P (2012) Intra-annual tracheid formation of Norway spruce provenances in southern Finland. Trees 26: 543–555. https://doi.org/10.1007/s00468-011-0616-0.
Kelty MJ, Larson BC, Oliver CD (1992) The ecology and silviculture of mixed-species forests: a festschrift for David M. Smith. Springer Netherlands, Dordrecht. https://doi.org/10.1007/978-94-015-8052-6.
Knott R (2004). Seasonal dynamics of the diameter increment of fir (Abies alba Mill.) and beech (Fagus sylvatica L.) in a mixed stand. J For Sci 50: 149–160. https://doi.org/10.17221/4610-JFS.
Körner C (2012) Alpine treelines: functional ecology of global high elevation tree limits. Springer, Basel. https://doi.org/10.1007/978-3-0348-0396-0.
Körner C, Basler D (2010) Phenology under global warming. Science 327: 1461–1462. https://doi.org/10.1126/science.1186473.
Krejza J, Cienciala E, Světlík J, Bellan M, Noyer E, Horáček P, Štěpánek P, Marek MV (2020) Evidence of climate-induced stress of Norway spruce along elevation gradient preceding the current dieback in Central Europe. Trees 35: 103–119. https://doi.org/10.1007/s00468-020-02022-6.
Lebourgeois F, Rathgeber CBK, Ulrich E (2010) Sensitivity of French temperate coniferous forests to climate variability and extreme events (Abies alba, Picea abies and Pinus sylvestris). Journal Veg Sci 21: 364–376. https://doi.org/10.1111/j.1654-1103.2009.01148.x.
Leštianska A, Fleischer P jr., Fleischer P, Merganičová K, Střelcová K, (2020) Interspecific variation in growth and tree water status of conifers under water-limited condition. J Hydrol Hydromech 68: 368–381. https://doi.org/10.2478/johh-2020-0028.
Lévesque M, Saurer M, Siegwolf R, Eilmann B, Brang B, Bugmann H, Rigling A (2013) Drought response of five conifer species under contrasting water availability suggests high vulnerability of Norway spruce and European larch. Glob Change Biol 19: 3184–3199. https://doi.org/10.1111/gcb.12268.
Linares JC, Camarero JJ, Carreira JA (2009) Plastic responses of Abies pinsapo xylogenesis to drought and competition. Tree Physiol 29: 1525–1536. https://doi.org/10.1093/treephys/tpp084.
Mäkinen H, Seo J-W, Nöjd P, Schmitt U, Jalkanen R (2008) Seasonal dynamics of wood formation: a comparison between pinning, microcoring and dendrometer measurements. Eur J of For Res 127: 235–245. https://doi.org/10.1007/s10342-007-0199-x.
Marschall J (1975) Hilfstafeln für die Forsteinrichtung.[Tables for forest inventory]. Österreichischen Agrarverlag, Wien.
Mauri A, de Rigo D, Caudullo G (2016) Abies alba in Europe: distribution, habitat, usage and threats. In: San-Miguel-Ayanz J, de Rigo D, Caudullo G, Houstan Durrant T, Mauri A (eds) Publications Office of the European Union, Luxembourg, pp 48–49. https://doi.org/10.2788/4251.
Menzel A, Fabian P (1999) Growing season extended in Europe. Nature 397, article id 659. https://doi.org/10.1038/17709.
Metz J, Annighöfer P, Schall P, Zimmermann J, Kahl T, Schulze E-D, Ammer C (2016) Site‐adapted admixed tree species reduce drought susceptibility of mature European beech. Glob Change Biol 22: 903–920. https://doi.org/10.1111/gcb.13113.
Michelot A, Simard S, Rathgeber C, Dufrêne E, Damesin C (2012) Comparing the intra-annual wood formation of three European species (Fagus sylvatica, Quercus petraea and Pinus sylvestris) as related to leaf phenology and non-structural carbohydrate dynamics. Tree Physiol 32: 1033–1045. https://doi.org/10.1093/treephys/tps052.
Misson L, Antoine N, Joel G (2003) Effects of different thinning intensities on drought response in Norway spruce (Picea abies (L.) Karst.). Forest Ecol Manag 183: 47–60. https://doi.org/10.1016/S0378-1127(03)00098-7.
Moser L, Fonti P, Büntgen U, Esper J, Luterbacher J, Franzen J, Frank D (2010) Timing and duration of European larch growing season along altitudinal gradients in the Swiss Alps. Tree Physiol 30: 225–233. https://doi.org/10.1093/treephys/tpp108.
Nothdurft A, Engel M (2020) Climate sensitivity and resistance under pure- and mixed-stand scenarios in Lower Austria evaluated with distributed lag models and penalized regression splines for tree-ring time series. Eur J For Res 139: 189–211. https://doi.org/10.1007/s10342-019-01234-x.
Oberhuber W, Gruber A, Kofler W, Swidrak I (2014) Radial stem growth in response to microclimate and soil moisture in a drought-prone mixed coniferous forest at an inner Alpine site. Eur J For Res 133: 467–479. https://doi.org/10.1007/s10342-013-0777-z.
Pinheiro J, Bates D, DebRoy S, Sarkar D, Heisterkamp S, Van Willigen B, Ranke J (2020) nlme: linear and nonlinear mixed effects models. https://cran.r-project.org/web/packages/nlme/.
Pretzsch H (2009) Forest dynamics, growth and yield: from measurement to model. Springer Berlin Heidelberg, Berlin. https://doi.org/10.1007/978-3-540-88307-4.
Pretzsch H, Dieler J (2011) The dependency of the size-growth relationship of Norway spruce (Picea abies [L.] Karst.) and European beech (Fagus sylvatica [L.]) in forest stands on long-term site conditions, drought events, and ozone stress. Trees 25: 355–369. https://doi.org/10.1007/s00468-010-0510-1.
Pretzsch H, Schütze G (2009) Transgressive overyielding in mixed compared with pure stands of Norway spruce and European beech in Central Europe: evidence on stand level and explanation on individual tree level. Eur J For Res 128: 183–204. https://doi.org/10.1007/s10342-008-0215-9.
Pretzsch H, Block J, Dieler J, Dong PH, Kohnle U, Nagel J, Spellmann H, Zingg A (2010) Comparison between the productivity of pure and mixed stands of Norway spruce and European beech along an ecological gradient. Ann Forest Sci 67: 712–712. https://doi.org/10.1051/forest/2010037.
Pretzsch H, Schütze G, Uhl E (2013) Resistance of European tree species to drought stress in mixed versus pure forests: evidence of stress release by inter-specific facilitation. Plant Biol 15: 483–495. https://doi.org/10.1111/j.1438-8677.2012.00670.x.
Pretzsch H, Grams T, Häberle KH, Pritsch K, Bauerle T, Rötzer T (2020) Growth and mortality of Norway spruce and European beech in monospecific and mixed-species stands under natural episodic and experimentally extended drought. Results of the KROOF throughfall exclusion experiment. Trees 34: 957–970. https://doi.org/10.1007/s00468-020-01973-0.
Prislan P, Gričar J, de Luis M, Smith KT, Čufar K (2013) Phenological variation in xylem and phloem formation in Fagus sylvatica from two contrasting sites. Agr Forest Meteorol 180: 142–151. https://doi.org/10.1016/j.agrformet.2013.06.001.
Pukienė R, Vitas A, Kažys J, Rimkus E (2020) Four-decadal series of dendrometer measurements reveals trends in Pinus sylvestris L. inter- and intra- annual growth response to climatic conditions. Can J Forest Res 51: 445–454. https://doi.org/10.1139/cjfr-2020-0211.
Rathgeber CBK, Rossi S, Bontemps J-D (2011) Cambial activity related to tree size in a mature silver-fir plantation. Ann Bot-London 108: 429–438. https://doi.org/10.1093/aob/mcr168.
Rathgeber CBK, Cuny HE, Fonti P (2016) Biological basis of tree-ring formation: a crash course. Front Plant Sci 7, article id 734. https://doi.org/10.3389/fpls.2016.00734.
Rossi S, Deslauriers A, Anfodillo T (2007) Evidence of threshold temperatures for xylogenesis in conifers at high altitudes. Oecologia 152: 1–12. https://doi.org/10.1007/s00442-006-0625-7.
Rossi S, Deslauriers A, Gricar J, Seo J, Rathgeber CB, Anfodillo T, Morin H, Levanic T, Oven P, Jalkanen R (2008). Critical temperatures for xylogenesis in conifers of cold climates. Global Ecol Biogeogr 17: 696–707. https://doi.org/10.1111/j.1466-8238.2008.00417.x.
Schäfer C, Rötzer T, Thurm EA, Biber P, Kallenbach C, Pretzsch H (2019) Growth and tree water deficit of mixed norway spruce and European beech at different heights in a tree and under heavy drought. Forests 10, article id 577. https://doi.org/10.3390/f10070577.
Schober R (1951) Zum Einfluß der letzten Dürrejahre auf den Dickenzuwachs. [On the influence of drought on diameter increment]. Forstwissenschaftliches Centralblatt 70: 204–228. https://doi.org/10.1007/BF01821554.
Seo J-W, Eckstein D, Jalken R, Schmitt U (2011) Climatic control of intra- and inter-annual wood-formation dynamics of Scots pine in northern Finland. Environ Exp Bot 72: 422–431. https://doi.org/10.1016/j.envexpbot.2011.01.003.
Steckel M, del Río M, Heym M, Aldea J, Bielak K, Braizaitis G, Černý J, Coll L, Collet C, Ehbrecht M, Jansons A, Nothdurft A, Pach M, Pardos M, Ponette Q, Reventlow DOJ, Sitko R, Svoboda M, Vallet P, Wolff B, Pretzsch H (2020) Species mixing reduces drought susceptibility of Scots pine (Pinus sylvestris L.) and oak (Quercus robur L., Quercus petraea (Matt.) Liebl.) – site water supply and fertility modify the mixing effect. Forest Ecol Manag 461, article id 117908. https://doi.org/10.1016/j.foreco.2020.117908.
Suzuki M, Yoda K, Suzuki H (1996) Phenological comparison of the onset of vessel formation between ring-porous and diffuse porous deciduous trees in a Japanese temperate forest. IAWA J 17: 431–44. https://doi.org/10.1163/22941932-90000641.
Szymczak S, Häusser M, Garel E, Santoni S, Huneau F, Knerr I, Trachte K, Bendix J, Bräuning A (2020) How do Mediterranean pine trees respond to drought and precipitation events along an elevation gradient? Forests 11, article id 758. https://doi.org/10.3390/f11070758.
Trouvé R, Bontemps J-D, Collet C, Seynave I, Lebourgeois F (2017) Radial growth resilience of sessile oak after drought is affected by site water status, stand density, and social status. Trees 31: 517–529. https://doi.org/10.1007/s00468-016-1479-1.
Van der Maaten E (2013) Thinning prolongs growth duration of European beech (Fagus sylvatica L.) across a valley in southwestern Germany. Forest Ecol Manag 306: 135–141. https://doi.org/10.1016/j.foreco.2013.06.030.
Van der Maaten-Theunissen M, Bouriaud O (2012) Climate–growth relationships at different stem heights in silver fir and Norway spruce. Can J Forest Res 42: 958–969. https://doi.org/10.1139/x2012-046.
Vospernik S (2021) Basal area increment models accounting for climate and mixture for Austrian tree species. Forest Ecol Manage 480, article id 118725. https://doi.org/10.1016/j.foreco.2020.118725.
Vospernik S, Nothdurft A (2018) Can trees at high elevations compensate for growth reductions at low elevations due to climate warming? Can J Forest Res 48: 650–662. https://doi.org/10.1139/cjfr-2017-0326.
Vospernik S, Nothdurft A, Mehtätalo L (2020) Seasonal, medium-term and daily patterns of tree diameter growth in response to climate. Forestry 93: 133–149. https://doi.org/10.1093/foresj/cpz059.
Walter H, Lieth H (1960) Klimadiagramm. [Climate diagram]. Weltatlas, Fischer, Jena
Zingg A (1994) Top heights in mixed stands: their definition and calculation. In: Pinto da Costa ME, Preuhsler T (eds) Mixed stands. Research plots, measurements and results, models. Proceedings from the Symposium of the IUFRO working groups S4.01-03: Design, performance and evaluation of experiments, and S4.01-04: Growth models for tree and stand simulation. April 25-29, 1994 in Lousa/Coimbra, Portugal. Lisboa, Instituto Superior Agronomia, Universidade de Lisboa, pp 67–79.
Zöhrer F (1969) Bestandeszuwachs und Leistungsvergleich montan-subalpiner Lärchen-Fichten-Mischbestände. [Stand increment and comparison of productivity of montane and subalpine mixed species stands of European larch and Norway spruce]. Forstwissenschaftliches Centralblatt 88: 41–63. https://doi.org/10.1007/BF02741762.
Zweifel R, Item H, Häsler R (2000) Stem radius changes and their relation to stored water in stems of young Norway spruce trees. Trees 15: 50–57. https://doi.org/10.1007/s004680000072.
Total of 79 references.
