Pentti Niemistö  ,
Harri Kilpeläinen,
Eero Poutiainen
,
Harri Kilpeläinen,
Eero Poutiainen
Effect of first thinning type and age on growth, stem quality and financial performance of a Scots pine stand in Finland
Niemistö P., Kilpeläinen H., Poutiainen E. (2018). Effect of first thinning type and age on growth, stem quality and financial performance of a Scots pine stand in Finland. Silva Fennica vol. 52 no. 2 article id 7816. https://doi.org/10.14214/sf.7816
Highlights
- Early commercial first thinning at the top height of 11 m with tree selection targeting high quality of remaining stems was more profitable in a Scots pine stand than thinning from below at similar time or delayed thinning 10 years later
- After early first thinning only one intermediate thinning was needed, but a late thinning at age of 60 years was feasible in connection with increased amount of high quality butt logs after artificial pruning
- The optimal rotation period for a Scots pine stand using a lower interest rate of 1% was 80–85 years depending on the thinning pattern. With a higher rate of 4%, the optimal rotation took only 60 years.
Abstract
The objective of the study was to ascertain the effects of tree selection (thinning from below, from above and according to stem quality) and timing of first commercial thinning (early and delayed) on the growth, yield and quality of trees in a Scots pine (Pinus sylvestris L.) stand. A long-term field experiment (25 years) was measured in 5-year periods and the further development was simulated with growth and yield models to final cuttings using alternative rotation periods of 55–85 years. The measurements included also the exact location and type of technical defects detected on all trees in the experimental plots. The measured volume increment per unit area during the study period, 25 years after the early thinning stage was the lowest in the plots thinned from below, and the highest in the plots thinned from above or in the delayed thinning plots. However, the largest volume of saw logs during the whole rotation of 80 years was yielded after early first thinning according to the quality. The largest volume of very high-quality butt logs was produced by pruning connected with early thinning from above, and a smaller volume after early thinning according to stem quality but no after thinning from below or delayed first thinning. Without pruning an early quality thinning with one intermediate thinning was the most profitable thinning treatment in the Scots pine stand regardless the rotation length or the interest rate used. By interest rates of 1% and 2%, the optimal rotations were 80–85 years and 70 years respectively. A late thinning at the age of 60 year with long rotation was profitable only for the pruned pine stands with a low interest rate.
Keywords
bucking;
growth and yield;
external stem quality;
profitability;
Pinus silvestris;
tree selection;
saw log
-
Niemistö,
Natural Resources Institute Finland (Luke), Natural resources, Kampusranta 9 C, FI-60320 Seinäjoki, Finland
E-mail
pentti.niemisto@luke.fi
- Kilpeläinen, Natural Resources Institute Finland (Luke), Production systems, Yliopistokatu 6, FI-80100 Joensuu, Finland E-mail harri.kilpelainen@luke.fi
- Poutiainen, Oulu E-mail eero1.poutiainen@dnainternet.net
Received 28 September 2017 Accepted 6 February 2018 Published 14 February 2018
Views 118968
Available at https://doi.org/10.14214/sf.7816 | Download PDF

1 Introduction
The forest regeneration via planting or direct seeding of Scots pine was common, yearly 75 000–125 000 ha, during the years 1970–1990 in Finland (Finnish Statistical Yearbook of Forestry 2004). Therefore, the total area of Scots pine stands reaching the first thinning phase is currently high. In 2005–2014 the annual area of first thinnings was on average 189 000 ha, but due to neglected and delayed operations the need for first thinnings is still larger, annually 250 000 ha according to the National Forest Programme 2015 (Ministry of Agriculture and Forestry 2011; Finnish Statistical Yearbook of Forestry 2013). About 75% of these areas are nowadays Scots pine dominated.
The control of the stand density through thinnings has been a tool frequently used in increasing growth of remaining trees and improving stem quality by removing low-quality stems. While thinning from below may increase merchantable stem volume (saw logs and pulpwood), it has usually decreased the total volume increment per unit area compared to an unthinned stand (Assmann 1970; Zeide 2001; Mäkinen and Isomäki 2004a,b). In many studies, the merchantable volume increment has not declined with decreasing stand density, over a wide range of stand densities (Eriksson and Karlsson 1997).
The stem quality in planted Scots pine stands has often been low due to fertile sites and low stand density during sapling stage (Varmola 1980; Uusvaara 1983; Lämsä et al. 1990; Uusvaara 1991; Varmola and Salminen 2004; Huuskonen et al. 2008; Huuskonen et al. 2014). On site of medium fertility typical for Scots pine, the variation in stem quality is large (Kärkkäinen and Uusvaara 1982; Varmola 1996; Huuskonen et al. 2008). The amount and diameter of branches, the major determinants of log grading, are highly correlated with stem diameter (Kärkkäinen and Uusvaara 1982; Varmola 1996). Because thinning from below directs growth to larger trees, it may not be the best thinning type in first thinnings in terms of stem quality (Huuskonen et al. 2014), although the tallest trees with thick branches, so called “wolf trees”, are usually removed.
Trees slightly smaller than the dominant ones, so-called codominant trees, with narrow crowns and thin branches have usually the best quality among the stems of a stand (Lämsä et al. 1990; Huuskonen et al. 2014). Retaining codominant trees and removing dominant ones have increased volume increments in Scots pine stands (Mielikäinen and Valkonen 1991). Thinning from above aims at increasing immediate harvesting incomes and increasing number of saw log sized trees during a rotation. In Scots pine stands the volume increment was slightly greater; +3% (Vuokila 1977) and +7.6% (Mielikäinen and Valkonen 1991) or at the same level as after thinnings from below (Eriksson and Karlsson 1997; Nilsson et al. 2010). However, Pettersson (2008) has found lower volume increments (–10%) after thinning from above and quality thinning compared with thinning from below. In Norway spruce stands thinnings from above has been resulted in slightly lower volume increments; –4% (Mielikäinen and Valkonen 1991), –6% (Eriksson and Karlsson 1997), or not significant difference between thinnings from above and from below (Vuokila 1977; Nilsson et al. 2010).
The shortage of high quality timber in future has increased the conversation about better growing guidelines to produce high quality stems. The possibilities to develop the quality of trees by thinning are better at late pre-commercial thinning than earlier (Ruha and Varmola 1997; Varmola and Salminen 2004), and tree selection according to stem quality and size is flexible at this stage (Huuskonen 2008). Stem quality can be increased also by artificial pruning. The pruning is not suitable for trees with thick branches and must be done in young pine stands (Uusvaara 1991; Uusvaara 1993) and can be, therefore, poorly connected with delayed first thinning. So the new experimental approach to compare early and late commercial first thinnings with different tree selection principles is needed. Thinnings from above are mostly studied older pine stands (Mielikäinen and Valkonen 1991; Eriksson and Karlsson 1997) and the entirety including the timing, number and style of thinnings as well as different rotations are mostly based on simulations with growth models (Hyytiäinen and Tahvonen 2002; Huuskonen et al. 2004), not on measured permanent experiment as it was partly done in this study.
The aim of this study was to compare the effects of different thinning types in early and delayed commercial first thinnings on the growth and quality of a Scots pine stand. The stand growth and yield as well as profitability of the treatments over the whole stand rotation were compared using alternative rotation periods. The study was based on a long-term permanent experiment (25 years) and its further development was simulated with growth and yield models (Motti-simulator) for the rest of the rotation period. Niemistö (1994) has reported the initial five-year development of the same experiment.
2 Materials and methods
2.1 Study stand and thinning treatments
The material was collected from a thinning experiment in Kajaani (64°27´N, 27°97´E, temperature sum = 1025 d.d.) established in 1987 to a Scots pine stand at the age of 30 years, regenerated by direct seeding in 1957. The stand located on a medium fertility site classified as Vaccinium myrtillus forest site type (Cajander 1926), typical for Scots pine in the region, with a site index (H100) of 26 m (Vuokila and Väliaho 1980). Precommercial thinning to the density of 1800–2000 pines ha–1 was taken place at the seedling stage with the top height of 3.1–3.5 m in 1972. All broadleaved trees were cleaned out in 1968. At the beginning of the experiment in 1987, the mean values (min–max in brackets) were 2034 stems ha–1 (1716−2210 stems ha–1) in stand density, 108 m3 ha–1 (96−136 m3 ha–1) in stem volume, 12.9 cm (11.9−14.0 cm) in mean diameter at breast height and 11.1 m (10.6−11.7 m) in dominant height.
The experiment included 12 plots á 1000 m2 (surrounded at least by a 5 m buffer zone of the same treatment) for four first thinning treatments with three replicates which were randomly placed in the plots. Three different early first thinning treatments were thinning from below, thinning from above and quality thinning at the stand age of 30 years and a delayed first thinning treatment ten years later with one plot per each thinning type above (Fig. 1). In the plots of early first thinnings, stands were thinned again (named here second thinning) at the age of 45 years. When the rotation period was 70 years or longer, an alternative intermediate thinning (named simulated late thinning) was simulated at the stand age of 60 years according to the previous thinning method in each sample plot. The randomly selected initial thinning type in each plot was repeated in the later treatments.
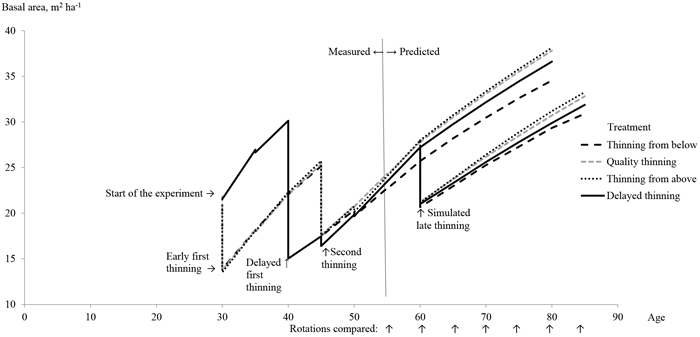
Fig. 1. Development of stand basal areas in the four thinning treatments including the effect of mortality. View larger in new window/tab.
Thinning intensities were determined according to the general recommendations for stand basal areas after thinnings (Fig. 1) used in private owned forests in Finland (Metsänhoitosuositukset 1989). In all thinning treatments, small suppressed or sick trees incapable of surviving, as well as all of the clearly damaged trees (crooked, forked etc.), were removed in first thinnings. In the subsequent selection, thinning from below removed smaller trees and thinning from above removed mostly dominant trees, but a regular spatial distribution of the trees was maintained throughout the plots. In quality thinning, the technical quality of the trees was the most important selection criteria, i.e., remaining stems were straight with small branches and vital crowns.
In the plots of thinning from above 400 high quality stems per hectare were pruned to the height of 5 meters in early spring 1988, i.e., one year after first thinning, when the base of living crown was at the height of 3.8 m on average. The treatment is named “thinning from above with pruning”.
2.2 Field measurements and stand simulations
After the establishment, the plots were re-measured 5 times in five-year periods from 1987 to 2012 when the stand age was 55 years. Tree species, stem diameter at breast height (DBH), damage and mortality were recorded for each tree on the plots. In the selection of sample trees, the probability of a tree being selected was proportional to its diameter, but the sample trees were randomly distributed over a plot. In the first measurement, extra sample trees were selected to ensure that the number of sample trees was sufficient (20–40 per plot) after the thinning. If a sample tree was removed in the second thinning, it was substituted by a similar one. Tree height (h), height of the living crown base and stem diameter at the height of 6 m (d6.0) were measured on the sample trees. The crown base was defined as the lowest whorl with at least one living branch that is separated from other living whorls above it by no more than one dead whorl. The mean annual increment (MAI) was calculated as a net volume increment per year (m3 ha–1 a–1) for each 5-year period.
The external quality of each tree was measured and recorded in the first and last measurement. Every tree on each plot was visually assessed for the stem quality, with particular attention to technical defects (sweep, crooks, branchiness, and scars) affecting log grading according to the bucking rules of saw logs (Airaksinen 1994). The type, starting point and length of each defect were recorded. Dead branches thicker than 40 mm in diameter were classified as technical defects. Also all branches over 15 mm in diameter from the stump up to the height of 6 m were noticed.
After the last measurement the stand development was simulated with growth models up until the end of the rotation period using the Motti simulator in which individual tree-level models of cross-sectional area increment and height growth were used (Hynynen et al. 2002; Salminen et al. 2005). For the calibration of the stand growth, the development of the plots was predicted also for the last measurement period from the stand age of 50 years to the age of 55 years (calibration period). The measured increments were systematically higher than the predicted ones. Therefore, the growth models in the Motti simulator were calibrated to correspond with the mean growth level of the whole experiment during the calibration period. Corrections to the growth models of tree height and DBH were 30% and 35% respectively in all treatments. To avoid the overestimation of differences between the treatments, separate calibrations in different treatments or plots were not used.
Thereafter, the calibrated Motti simulator was used to predicting the growth of all the standing trees in 5-year periods to the end of the rotation. Without the simulated late thinning, alternative rotation periods were 55, 60, 65, 70, 75 and 80 years (Fig. 1). Alternatively, a late thinning was simulated at the age of 60 years with the predicted dominant height of 21.4 m (Fig. 1). The harvested trees in the simulated late thinnings were selected manually at the age of 55 years with the similar principle as in previous thinnings. According to the predicted height and diameter increment and prevailing thinning recommendations in Finland (Hyvän metsänhoidon suositukset 2006), the final number of trees to be removed was adjusted to correspond with the stand basal area of 21 m2 ha–1 on each plot after thinning. With the late thinning, final cuttings were simulated at the stand ages of 70, 75, 80 and 85 years.
2.3 Timber volumes and financial performance
The heights of tally trees were predicted using Näslund’s (1937) height curve, fitted for each plot with the help of the tree heights measured on the sample trees on each plot. Mean stand characteristics and volumes of different timber assortments were calculated in two stages. Cutting removals of different timber assortments from first and second thinnings were calculated using the KPL software without exact stem quality data (Heinonen 1994) and stem volumes were estimated by volume functions (Laasasenaho 1982) based on measured DBH, h and d6.0.
In simulated late thinnings and final cuttings, the harvested trees were bucked into different timber assortments using the more sophisticated bucking-to-value simulator (Kilpeläinen 2002) based on the dynamic programming approach (Pnevmaticos and Mann 1972; Näsberg 1995). This simulator takes account of stem dimensions estimated by polynomial taper curve models (Laasasenaho 1982) and detected defects on all trees measured at the age of 55 years.
Possible timber assortments in thinnings and final cuttings were saw logs, high quality (grade A) butt logs, small-diameter saw logs and pulpwood with allowable log lengths and top diameters (over bark) presented in Table 1. Saw logs were cut to the fixed lengths in 3-dm modules, except pulpwood which was able to cut using free lengths between 2.8 m and 5.5 m. The unit prices (in euro per solid cubic meter over bark) for different timber assortments were based on the average stumpage prices in thinnings and final cuttings during the years 2011–2014 in Finland (Luke’s statistical services 2015).
| Table 1. Minimum top diameters (D, over bark), log lengths (L), and stumpage prices of different timber assortments used in thinnings and final cuttings according to the mean unit prices during the years 2011–2014 in Finland (Luke’s statistical services 2015). | ||||||
| Early first thinning | Delayed first thinning | Second thinning | Simulated late thinning | Final cutting | ||
| Timber assortment | Diameter and log length | Stumpage prices (€ m–3) | ||||
| Grade A butt log | D ≥ 22 cm, L = 28−58 dm | 65 | 65 | 65 | ||
| Conventional saw log | D ≥ 15 cm, L = 37−58 dm | 40 | 47.5 | 47.5 | 55 | |
| Small-diam. saw log | D ≥ 12 cm, L = 31−43 dm | 20 | 20 | 20 | 25 | |
| Pulpwood | D ≥ 6 cm, L = 28−55 dm | 12.5 | 13.5 | 14.5 | 14.5 | 17.5 |
Other defects than thin branches, like sweep over 1 cm m–1, crook, multiple vertical branches, decay and stem scars, were not allowed for conventional saw logs, grade A butt logs and small-diameter saw logs. Small dead branches (diameter < 40 mm) were allowed for saw logs and small-diameter saw logs, but not for grade A butt logs. However, single thin living or dead branches (diameter < 15 mm) in grade A butt logs were accepted. The stem parts that contained defects were bucked as pulpwood or waste wood including jump butts, off-cuts and top-cuts.
For financial comparisons the net present values (NPV) of the plots were calculated at the time of the experiment established using the interest rates of 1%, 2%, 3% and 4%. Because of alternative rotation periods, the “Bare Land Value, BLV” at the timing of final cutting was taken into account using the formula of Faustman (1849). The future tree generations were grown and managed equally to the ongoing rotation. The costs of different operations were average unit costs during the year 2012 in Finland as follows: 380 € ha–1 for soil preparation, 700 € ha–1 for planting, 400 € ha–1 for early tending five years after the regeneration and 350 € ha–1 for pre-commercial thinning 15 years after the regeneration (Finnish Statistical Yearbook of Forestry 2013). Because of high uncertainty in pruning costs and in additional prices of pruned, high quality stems, we presupposed in our case, that the cost of pruning and the extra price for pruned stems would equally compensate each other. The final criterion for comparing the profitability of thinning treatments was the sum of NPV (= ongoing rotation) and BLV (= future generations) discounted to the stand age of 30 years at the beginning of the experiment. Further this criterion is called combined net present value CNPV1…CNPV4 with the interest rates of 1…4%.
The statistical differences among the treatments were analysed through one-way covariance analysis. The pairwise comparisons were performed through computing of generalised least-square means of the treatment effects. Differences were denoted significant with the p-values under 0.05 and nearly significant with the p-values between 0.05 and 0.10. Restricted maximum likelihood (REML) estimation in “Anova” procedure was used in the analysis (IBM SPSS Statistics Version 22.0, PASW Statistics).
3 Results
3.1 Measured stand characteristics
After early first thinnings at the age of 30 years, when the plots were thinned to the equal basal areas of 13.7 m2 ha–1 (Fig. 1), the stand densities in the plots of quality thinning or in the plots of thinning from below were 1300 or 1000 stems ha–1, the mean DBH 12.3 or 13.8 cm and the average diameter of the thickest branch 22.2 or 25.3 mm, respectively. In the plots of thinning from above these stand characteristics were close to them in quality thinning. In the plots of delayed first thinning, 2070 stems ha–1 with the mean DBH of 12.7 cm were stayed to be thinned 10 years later.
The thinning types were compared with each other using thinning quotients expressed as ratios between the stem basal area weighted mean diameters of harvested trees and all trees before thinning. In early thinnings at the age of 30 years the average thinning quotients were 0.81 for thinning from below, 1.07 for quality thinning and 1.08 for thinning from above. In second thinnings, ten years later, the respective quotients were 0.89, 1.00 and 1.07. In simulated late thinnings at the age of 60 years these quotients were 0.91–0.95 for thinning from below and quality thinning, but over 1.00 for thinning from above.
According to the latest measurements at the age of 55 years, the basal area and total stem volume were close to each other in all the first thinning treatments (Table 2). The stand density was the lowest (593 trees ha–1 on average) in the plots of thinning from below and the highest (792 trees ha–1) in the plots of thinning from above with pruning. A slightly lower total stem volume (212 m3 ha–1 on average) in the plots of thinning from below was caused by windfalls, but the differences between the treatments were not statistically significant. The mean height of sample trees was not statistically lower in the treatments of quality thinning and thinning from above compared to the other treatments. The dominant heights were almost equal regardless the treatment. Accordingly, the mean DBH was the highest, 22.1 cm, in the plots of thinning from below and the lowest, 19.5 cm, in the plots of thinning from above with pruning.
| Table 2. Mean characteristics of the growing stock at the stand age of 55 years in the plots of four different thinning treatments. | ||||||||
| Thinning from below | Quality thinning | Thinning from above + pruning | Delayed thinning | |||||
| Variable | Mean | SD | Mean | SD | Mean | SD | Mean | SD |
| Stem number, ha–1 | (a)593 | 93 | 753 | 55 | (a)792 | 97 | 663 | 119 |
| Mean DBH, cm | (a)22.1 | 1.8 | 20.1 | 0.9 | (a)19.5 | 1.1 | 21.2 | 2.1 |
| Mean height, m | 19.3 | 0.7 | 18.6 | 0.7 | 18.6 | 0.7 | 19.1 | 0.9 |
| Basal area, m2 ha–1 | 22.7 | 0.8 | 24.2 | 0.7 | 24.0 | 1.4 | 23.4 | 0.6 |
| Total volume, m3 ha–1 | 211.6 | 3.8 | 218.0 | 9.2 | 220.5 | 18.0 | 219.3 | 8.6 |
| Saw log-sized volume, m3 ha–1 | 167.7 | 19.4 | 151.5 | 20.4 | 144.2 | 26.3 | 164.8 | 29.3 |
| Saw logs (b), m3 ha–1 | 105.3 | 15.1 | 118.3 | 29.2 | 96.0 | 28.1 | 92.9 | 15.8 |
| Reduction in saw log volume, % (c) | 37% | 23% | 33% | 43% | ||||
| Grade A butt logs, m3 ha–1 | 0.7 | 1.2 | 0.6 | 1.1 | 3.9 | 4.1 | 0.0 | 0.0 |
| Small-diameter saw logs, m3 ha–1 | 28.1 | 10.5 | 46.9 | 10.1 | 46.3 | 9.5 | 34.6 | 12.6 |
| Pulpwood, m3 ha–1 | 70.8 | 17.4 | 50.3 | 14.3 | 72.6 | 8.0 | 84.3 | 5.1 |
| Cumulative mortality, m3 ha–1 during 25 yrs | 15.2 | 10.8 | 6.7 | 2.4 | 11.6 | 5.7 | 12.2 | 1.4 |
| (a) nearly significant difference (0.05 < p <0.10) between these two treatments, (b) includes grade A butt logs, (c) quality reduction in the saw log volume due to the defects according to the bucking simulation, as a percentage of the total saw log-sized volume. | ||||||||
Moreover, the diameter distributions at the stand age of 55 years indicated systematic differences between the thinning treatments (Fig. 2). The smallest DBH-variation in the diameters of the sample trees was in the plots of quality thinning, i.e., most stems were middle-sized, 16–24 cm thick in DBH. The number of stems below the minimum diameter of saw logs was the highest in the plots of thinning from above with pruning. During the measurement period of 25 years, mortality varied a lot between individual plots and between 5-year periods, but the differences in mortalities between the thinning treatments were not statistically significant (Table 2).
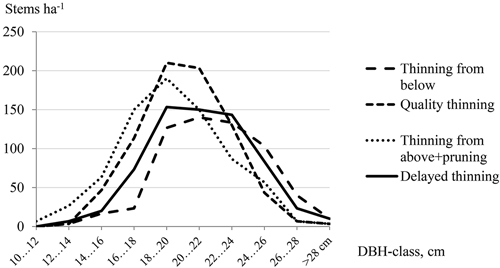
Fig. 2. DBH distributions for the four thinning treatments at the stand age of 55 years.
3.2 Growth
During the 15-year period after early first thinnings, the measured annual volume increment did not differ among the plots of thinning from below, thinning from above with pruning and quality thinning (Fig. 3). No significant difference was found during the first 5-year period after the second thinning as well. However during the next period at the stand ages of 50–55 years thinning from above with pruning resulted in the higher volume increment (10.1 m3 ha–1 a–1) than thinning from below and quality thinning (9.6 m3 ha–1 a–1).
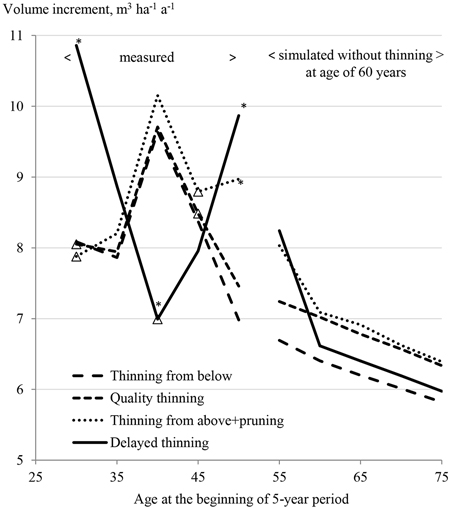
Fig. 3. Current annual volume increment in the coming 5-year period (m3 ha–1 a–1) from the establishment of the experiment to the end of the stand rotation in the four thinning treatments. Stand development was measured from the age of 30 years to 55 years and simulated thereafter. ∆ indicates the thinning realised at the beginning of the targeted growth period and * indicates a significant difference (p < 0.05) compared with the other treatments.
The annual volume increments in the plots of delayed first thinning differed periodically from those in the plots of other thinning treatments (Fig. 3). During the first 5-year period at the stand ages between 31–35 years, the volume increment in the plots of delayed first thinning was on average 2.9 m3 ha–1 a–1 higher than in the plots of early first thinnings, but during the second 5-year period no difference was found between the treatments. During the third 5-year period, in the delayed first thinning plots just thinned at the beginning of the period, the increment was significantly lower than in the other thinning treatments. Later the volume increment in the plots of delayed thinning recovered, and was significantly higher than after second thinning in the plots of quality thinning and thinning from below. The volume increments decrease typically 0–5 years after thinning and increased over 5 years after thinning (Fig. 3).
During 25 years at the stand ages between 31–55 years, the measured volume increments were, on the average, 8.2–8.3 m3 ha–1 a–1 in the plots of thinning from below and quality thinning, but 8.8–8.9 m3 ha–1 a–1 in the plots of thinning from above with pruning and delayed thinning (Fig. 4). The differences in volume increments between the treatments were not statistically significant. The simulated annual volume increments after the stand age of 55 years were lower than the measured increments at the ages between 31–55 years and the annual volume increments continued to decrease after the stand ages over 55 years (Fig. 3 and 4). The volume increments after the stand age of 55 years were the highest in the plots of thinning from above with pruning and quality thinning due to the higher number of stems and the lowest in the plots of thinning from below regardless the simulated late thinning which at the stand age of 60 years decreased remarkably increments after that thinning (Fig. 4).
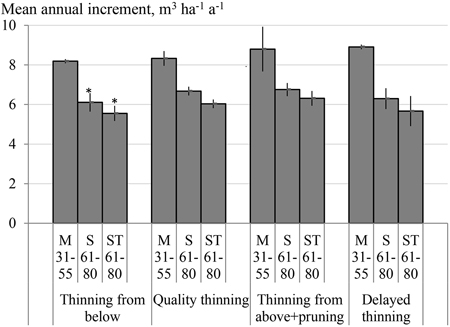
Fig. 4. Mean annual volume increment (m3 ha–1 a–1) with standard deviation in the four thinning treatments during the measurement period (M 31–55 years) and during the simulated period without a late thinning at the age of 60 years (S 61–80 years) and with that thinning (ST 61–80 years). * indicated a significant difference (p < 0.05) between the treatments during the corresponding period.
3.3 Cutting removal
3.3.1 Thinning removals
In early first thinnings at the age of 30 years only pulpwood and small sized waste wood were bucked, but in second thinnings 15 years later a little amount of conventional saw logs and small-diameter saw logs (on average 20–22 m3 ha–1 depending on the treatment) were also harvested (Table 3). In early first thinnings, the pulpwood removal was the lowest in the plots of thinning from below, as it was also in second thinnings 15 years later, when the total commercial roundwood removal (incl. saw logs and pulpwood) was 50–58 m3 ha–1 depending to the thinning treatment. The differences in the total removals from first and second thinnings between the plots of alternative selection principles (thinning from below, thinning from above with pruning and quality thinning) were not significant.
| Table 3. Thinning and final cutting removals (m3 ha–1) by timber assortments using alternative rotation lengths of 55–85 years in the four different treatments without and with the simulated late thinning at the age of 60 years. * indicates significantly (p < 0.05) higher volume of saw logs (incl. grade A butt logs) in the plots of quality thinning compared with the other treatments using the same rotation period. View in new window/tab. |
In delayed first thinning at the age of 40 years, the removal of saw logs and pulpwood was substantially higher than in early first thinnings at the age of 30 years, over 100 m3 ha–1 including 9 m3 ha–1 of conventional saw logs and 22 m3 ha–1 of small-diameter saw logs (Table 3). The total commercial roundwood removals in first and second thinnings were the lowest in the plots of thinning from below (81 m3 ha–1 in two thinnings) and the highest in the plots of delayed thinning (103 m3 ha–1 in one thinning).
The saw log removals were 23–32 m3 ha–1 in simulated late thinnings at the age of 60 years (Table 3), the lowest in the plots of thinning from below and the highest in the plots of thinning from above with pruning. The pulpwood removal was the lowest (18 m3 ha–1) in plots of quality thinning and the highest (27 m3 ha–1) in the plots of delayed thinning. The differences between the treatments in the total cumulative removal from all thinnings to the age of 60 years were not significant. Even though the total cumulative thinning removal was high in the plots of delayed thinning, conventional saw log removal was low.
3.3.2 Final cutting removals
The removals of grade A butt logs in final cuttings increased rapidly at the rotation ages over 60 years in the plots of thinning from above with pruning and more slowly in the plots of quality thinning (Table 3). The simulated late thinning increased the removals of grade A butt logs in final cuttings up to 71 m3 ha–1 in the plots of thinning from above with pruning and up to 23 m3 ha–1 in the plots of quality thinning at the rotation of 85 years. In the other treatments, the removals of grade A butt logs were negligible.
Regardless of the rotation period, the saw log removals (incl. grade A butt logs) in final cuttings were significantly higher in the plots of quality thinning compared with the other treatments (Table 3). In quality thinning, the saw log removals reached 300 m3 ha–1 at the rotation age of 80–85 years and were on average 35 m3 ha–1 higher than in the other treatments. The plots of thinning from above with pruning also resulted in high saw log volumes but the difference compared with the other treatments was not significant.
The removal of small-diameter saw logs in final cuttings decreased with increasing rotation periods due to larger-sized stems and higher proportions of saw logs (Table 3). In final cuttings at the age of 55 years, the removal of small-diameter saw logs was 28–47 m3 ha–1 and correspondingly at the age of 80 years 12–31 m3 ha–1 depending on the treatment. In final cuttings, the pulpwood removal slowly increased with increasing rotation periods (Table 3).
3.3.3 Total removals
The total commercial roundwood removals from all cuttings were 20–50 m3 ha–1 lower in the plots of thinning from below compared with the other treatments which produced the commercial roundwood on average 357, 420 and 487 m3 ha–1 during the rotations of 60, 70 and 80 years respectively (Table 3). The simulated late thinning at the age of 60 years decreased the total yield by 5–10 m3 ha–1 depending on the rotation period and treatment.
The total removal of saw logs (incl. grade A butt logs) was the lowest in the plots of thinning from below and delayed thinning (Table 3). Compared with these two treatments, the saw log removals in the plots of thinning from above with pruning were 6–41 m3 ha–1 higher and in the plots of quality thinning 11–56 m3 ha–1 higher depending on the rotation length. The total removal of small-diameter saw logs was 7–18 m3 ha–1 lower in the plots of thinning from below than in the other treatments (Table 3).
The total removal of pulpwood was the highest in the plots of delayed thinning and the lowest in the plots of quality thinning (Table 3). The total removal of pulpwood and small-diameter saw logs together was almost independent of the rotation length. Only in the plots of quality thinning there was a weak trend downwards when final cutting age was increasing.
3.4 Financial performance of treatments and rotations
3.4.1 Cutting incomes
The incomes from early first thinnings at the age of 30 years were low, on average 400−440 € ha–1, but the incomes from delayed first thinnings at the age of 40 years were considerably higher, 1765 € ha–1 (Fig. 5). Until the age of 45 years, the average cumulative income (1410 € ha–1) from two thinnings at the ages of 30 and 45 years was lower than the income from one delayed first thinning at the age of 40 years. In the simulated late thinning at the age of 60 years, the incomes were ca. 2000 € ha–1 in the plots of thinning from above with pruning and quality thinning, but in the plots of delayed thinning and thinning from below, the corresponding incomes were lower.
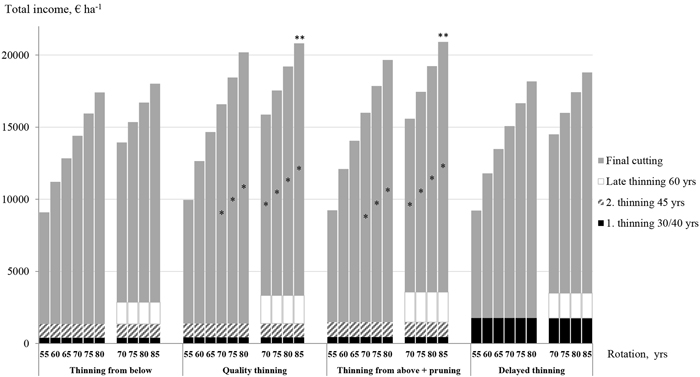
Fig. 5. Total incomes (€ ha–1) from all thinnings and final cuttings using alternative rotation lengths of 55–85 years in the four different treatments without and with the late thinning at the age of 60 years. * indicated a significant difference (p < 0.05) between the plots of quality thinning and thinning from above with pruning vs. the other treatments in the final cutting incomes and ** in the total incomes. View larger in new window/tab.
The total thinning incomes were the lowest in the plots of thinning from below, but the difference with the other thinning treatments was statistically significant only when the late thinning at the age of 60 years was simulated. In that case, the total thinning incomes were 2860 and 3560 € ha–1 in the plots of thinning from below and thinning from above with pruning, respectively.
Without the simulated late thinning, the final cutting incomes increased linearly from the age of 60 years to 80 years (Fig. 5), from 10 000 € ha–1 to 16 000 € ha–1 in the plots of thinning from below and delayed thinning. In the plots of quality thinning, the final cutting incomes were 14–16% higher but the difference was only significant with the rotations of 70 years and longer. The final cutting incomes in the plots of thinning from above with pruning were 600–700 € ha–1 lower than those in the plots of quality thinning without extra price for pruned logs.
3.4.2 Financial superiority of treatments
The final financial profitability consists of the net present values (NPV) of the ongoing tree stand with several rotations and the bare land values (BLV) at each moment of the final cutting for all treatments. The BLV’s were positive by the interest rates of 1%, 2% and 3%, when the given regeneration costs and the incomes above were used (Table 4). However, when the interest rate of 4% was used, the BLV’s were negative for all treatments. This means that it will not be feasible to grow similar Scots pine generations in future on this site, if the interest rate is 4% or more, but apply some other forest management regime. Instead of BLV-calculation for any other management regime we appointed a low positive BLV for the interest rate of 4%, 250 € ha–1, equally for all treatments and plots.
| Table 4. Bare land values (BLV, € ha–1) at the moment of final cutting calculated from cutting incomes and given regeneration costs for the four different thinning treatments with alternative rotation lengths of 60, 70 and 80 years with and without the late thinning at the age of 60 years. | ||||||
| Bare land values, € ha–1 | ||||||
| Simulated late thinning at the age of 60 years excluded | Simulated late thinning at the age of 60 years included | |||||
| Interest rate | Thinning treatment | Rotation length, yrs. | Rotation length, yrs. | |||
| 60 | 70 | 80 | 70 | 80 | ||
| 1% | Below | 10167 | 11253 | 11636 | 10948 | 11329 |
| Quality | 11932 | 13441 | 13939 | 12931 | 13486 | |
| Above + pruning | 11293 | 12882 | 13538 | 12696 | 13564 | |
| Delayed | 11003 | 12070 | 12434 | 11683 | 12131 | |
| 2% | Below | 2753 | 2895 | 2771 | 2850 | 2777 |
| Quality | 3392 | 3638 | 3503 | 3541 | 3494 | |
| Above + pruning | 3173 | 3463 | 3393 | 3480 | 3544 | |
| Delayed | 3100 | 3233 | 3097 | 3169 | 3121 | |
| 3% | Below | 530 | 474 | 304 | 482 | 357 |
| Quality | 832 | 802 | 605 | 795 | 665 | |
| Above + pruning | 735 | 734 | 570 | 778 | 699 | |
| Delayed | 716 | 655 | 478 | 658 | 545 | |
| 4% | (appointment) | 250 | 250 | 250 | 250 | 250 |
The average BLV’s for compared treatments and rotations were 12 000 € ha–1 by the interest rate of 1%, 3150 € ha–1 by 2% and 600 € ha–1 by 3%. The highest BLV’s were 14 000, 3640 and 850 € ha–1 respectively.
When an interest rate of 1% was used, the highest combined net present value (CNPV = NPV of ongoing stand + discounted BLV from the end of ongoing rotation) was reached with the rotation period of 80 years without the late thinning (Fig. 6A). This was found for all other treatments but for the plots of thinning from above with pruning the best rotation was 85 years with the late thinning at the age of 60 years. Regardless the final cutting age the CNPV-order from the lowest to the highest for different thinning treatments was: from below – delayed – from above with pruning – quality. For most treatments the simulated late thinning decreased the CNPV’s by 400–600 € ha–1, but not for the plots of thinning from above with pruning. In addition, the CNPV for this treatment surpassed the CNPV for quality thinning when the late thinning at the stand age of 60 years was simulated.
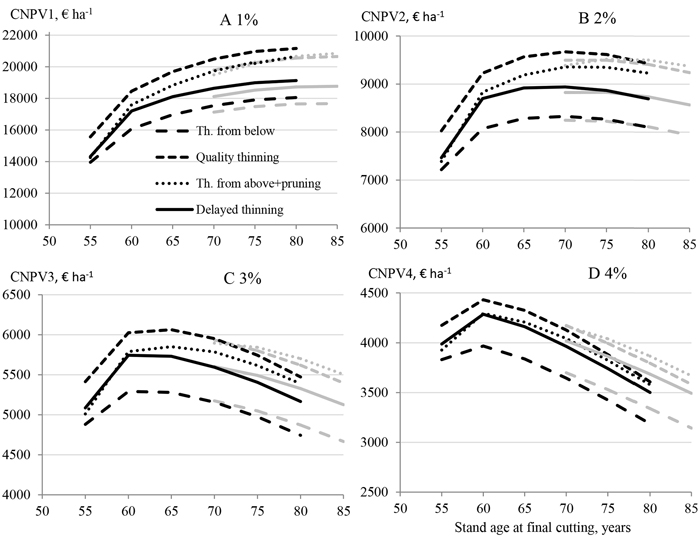
Fig. 6. Combined net present values (CNPV, € ha–1) discounted to the stand age of 30 years using alternative stand ages of 55–85 years at final cutting in the four treatments when interest rates of 1% (A), 2% (B), 3% (C) and 4% (D) were applied. Bare land values discounted from the final cutting date are included. Grey lines mean the CNPVs after simulated late thinnings at the age of 60 years.
Raising the interest rate from 1% to 2%, the CNPV-order and differences between the treatments were not changed (Fig. 6B). Now the highest CNPV was reached at the rotation of 70 years without the simulated late thinning. However, the decrease in CNPV caused by the late thinning was very low, only 1–2%. The CNPV for thinning from above with pruning deviated again from the CNPV’s for the other treatments and an optional late thinning at the age of 60 was profitable and the most profitable rotation period was 75 years.
When interest rates of 3% and 4% were used, the CNPV-order of the treatments was still similar to the order with the lower rates (Fig. 6C–D). Now an optional late thinning increased the CNPV for longer rotations (≥ 70 years) but was not profitable, because the highest CNPV was reached already with the rotations of 60–65 years using the interest rate of 3% and with the rotation of 60 years using the interest rate of 4%.
3.4.3 Effect of bucking options and prices
The economic response of bucking options was studied by using only two timber assortments: pulpwood and saw logs. The profitability naturally lowered by 3–5%, but the optimal rotation lengths didn’t change compared with the advanced bucking in which also small-diameter saw logs and grade A butt logs were harvested. Furthermore, the status of the delayed thinning improved and the status of pruning declined, especially with higher interest rates. The quality thinning was still the most profitable method and the sequence of thinning treatments didn’t change, even if the unit price for conventional saw logs were dropped to 45 € m–3. In this case the raising the interest rate (to the level of 4%) resulted in equal profitability for all other thinning treatments except for thinning from below being lower.
The better response for quality-based timber prices was studied by increasing the unit price for high quality grade A butt logs from 65 € m–3 to 100 € m–3, or in the other case decreasing the unit price for conventional saw logs from 55 € m–3 to 45 € m–3. The higher price for grade A butt logs improved the status of pruning connected with thinning from above. This treatment was now the most profitable when the rotation period was 75 years or longer and the late thinning at the stand age of 60 years was simulated. In the other case, the reduction in profitability caused by the lower unit price for saw logs was the smallest in the plots of delayed thinning and the largest in the plots of quality thinning, and that’s why the thinning treatments came closer to parity, especially with the higher interest rates.
4 Discussion
4.1 Growth and yield
A lot of empirical research about the effect of first and intermediate thinnings on the growth and yield on pine stands has been published in Northern Europe (Mielikäinen and Valkonen 1991; Eriksson and Karlsson 1997; Hynynen and Arola 1999; Mäkinen and Isomäki 2004b; Nilsson et al. 2010). In this study, the special attention was paid to the external quality of individual pine stems when the stand development and economic performance after different first thinnings were compared with each other. Similar empirical growth and yield studies according to detailed quality identifiers on pine stands have not been published in Finland, especially because the quality measurements (i.e., type and location of each defect) on standing trees are very expensive. Consequently only a single experimental stand was included in this study.
The volume increment in the plots of early first thinning from below was lower than the increments in the other treatments. One reason for this could be a higher amount of trees that has fallen due to strong wind, which can be occasional in this case. According to the study of Niemistö et al. (2018), the amount of wind damages didn’t differ between thinnings from below and from above in pine stands. The highest volume increments were achieved in the plots of delayed thinning and early thinning from above. Similar results of delayed first thinning in pine stands have been found in Finland by Hynynen and Arola (1999) and Huuskonen and Ahtikoski (2005), and of thinning from above by Mielikäinen and Valkonen (1991).
The volume increment after thinning from above and delayed thinning in pine stands differed slightly from the volume increment after thinning from below in Sweden according to Eriksson and Karlsson (1997). In our study the highest average increment in the plots of delayed thinning is partly explained by temporarily lower volume increments in the other treatments after early first thinning (12 m3 ha–1 per 10-year period at the ages of 30−40 years). According to Mäkinen and Isomäki (2004b) the volume increment in moderately thinned pine stands during the 25-year period after first thinning was decreased only by 6–9 m3 ha–1 compared with the unthinned control. In this study the highest total stem wood productions for the whole rotation were reached by the plots of early thinning from above or delayed first thinning. According to growth simulations in central Finland, the delaying of first thinning by ten years resulted in a 32 m3 ha–1 higher yield of merchantable wood, mostly of pulpwood (Huuskonen and Ahtikoski 2005).
The saw log yield was the highest with the quality thinning. This can be explained by larger number of high quality stems grown to the end of alternative rotation times without increment losses. The early stage is an advantageous time of first thinning to leave high-quality co-dominant trees to grow further and to harvest low-quality trees. A small volume of high quality butt logs were produced by the quality thinning but not any by thinning from below or delayed first thinning. However, a remarkable volume of high quality butt logs was reached only by the treatment with pruning connected with early thinning from above. The generalisation of the differences in the saw log yield above must be careful because of large variation in external quality between stands and stems (Huuskonen et al. 2008).
4.2 Economic performance
75–90% of the total incomes during the rotation period came from final cuttings, depending on the thinning treatment and rotations lengths used. The total incomes were the highest in the plots of quality thinning and thinning from above with pruning, and the lowest in the plots of thinning from below and delayed thinning.
The most profitable rotation time using the interest rate of 1% was not passed in this study, but is seems to be 85 years or more. By the interest rate of 2%, the most profitable rotation was 70 years without a late thinning at the age of 60 years, but for pruned stands it was 5–10 years longer with that late thinning. By the higher rate of 3%, the length of the most profitable rotation was 60–65 years without pruning. Applying the rate of 4% the best rotation time seems to be only 60 years for all thinning treatments.
However, in shorter rotation periods the average size of saw logs harvested in final cuttings was small, and that’s why the stumpage price used (55 € m–3) can be unrealistic high for shorter rotations. The average volume of saw logs bucked from a single stem increased from 220 dm3 to 356 dm3 when final cutting delayed from the stand age of 60 years to the age of 75 years. For example, the mean annual yields of saw logs in the plots of quality thinning were 2.9 m3 ha–1 and 3.8 m3 ha–1 over the rotations of 60 and 75 years respectively. Applying the fifteen years shorter rotation decreased the saw log yield in the long run by 24%.
If the pruning was not carried out, the early quality thinning with one intermediate thinning was the most profitable thinning treatment in Scots pine stands regardless the interest rate. We can’t have generalised economics of pruning connected with early thinning in this study, because we presupposed, that the cost of pruning and the extra price for pruned stems would equally compensate each other. According to our assumption, the pruning was competitive, with lower interest rates (1–2%) when the rotation period was long and an additional late thinning carried out. A similar trend towards longer rotations was not found with quality thinning in this study, obviously because of smaller volume of high quality butt logs.
In practice the higher additional price for high quality saw logs makes the pruning more profitable as said above (Uusvaara 1993), also by shorter rotation periods or higher interest rates. If the cost of pruning is 500 € ha–1, which was the average unit cost in 2012 in Finland (Finnish Statistical Yearbook of Forestry 2013), the compensatory price addition for high quality butt logs in final cuttings at the age of 80 years should be 11 € m–3 and 29 € m–3 with the interest rates of 2% and 4% respectively. The change of 100 € ha–1 in pruning costs means that the price change of grade A butt logs should be 2.2–5.9 € m–3 respectively with the interest rates of 2–4%.
4.3 Thinning treatments in forest practice
Four different first thinning treatments was studied and their further development predicted using nine alternative combinations of rotation lengths and number of thinnings, each of them repeated three times in the experiment (Fig. 1). Early quality first thinning with one intermediate thinning was the most profitable thinning treatment with high saw log production compared with respective first thinnings from below or one delayed first thinning regardless the rotation length or interest rate used. Early thinning from above connected to pruning was competitive with the late thinning on longer rotations using the higher price for high quality saw logs.
According to the study, the quality and value of the pine stand was increased when the stand was thinned according to the quality at the dominant height of 11 m. At this stage, the selection range, on other words the trees alternatively able to grow or remove in thinning, comprised of over 50% of standing trees before thinning. Later on this range will be narrowed because of the competition between trees and suppression of smaller trees by the tallest ones. That’s why the quality thinning does not achieve the advantages if the stand is thinned too late.
The technical quality of a pine stand can be similarly improved in a late pre-commercial thinning as in an early commercial thinning (Salminen and Varmola 1990; Varmola 1996; Huuskonen and Hynynen 2006; Huuskonen et al. 2014). However young stands at this stage are expensive to harvest (Laitila 2008; Laitila et al. 2010; Karttunen et al. 2016) and the opposite is mostly recommended for forestry practise i.e., the combination of one heavy pre-commercial thinning at the seedling stage and one late first thinning with high pulp wood removal (Hyvän metsänhoidon suositukset 2006). Our results contest this recommendation, although the current pricing system and high harvesting costs favour the treatment regime with delayed first thinning. The price difference between saw logs and pulpwood of Scots pine has increased over the last decades (Finnish Statistical Yearbook of Forestry 2013). In contrast, only minor or non-existent price differences prevail between different quality classes of individual logs (Malinen et al. 2010).
4.4 Methodological considerations
Although the study was based on one experimental stand, the results from homogenous and well-managed tree population in the onset of well-designed and well-accomplished large experiment are trustable. The methods and models used were also reliable because of common site type and stand structure, well-represented in the growth modelling data (Hynynen et al. 2002). Despite a relatively northern location of the experiment, the overall volume growth level of 8–9 m3 ha–1 corresponded to a typical increment in even-aged pine stands on Vaccinium (VT) and Myrtillus (MT) forest site types (Cajander 1926) frequent in southern and central Finland (Vuokila and Väliaho 1980; Mäkinen and Isomäki 2004b; Hynynen et al. 2005). According to the calibration period at the ages of 50–55 years, the oncoming volume growth was elevated 30% above the average growth in the respective location and site type. This relatively high correction was made equally for all plots, thus being conservative as to differences between the treatments – not at least overestimating their effect. The other argument for the equal calibration was almost even basal area throughout the experiment (Fig. 1) during the calibration period and more than five years passed after a previous thinning.
Because of all above mentioned characteristics, our results are able to generalise with wide scale in the southern and central Finland despite the narrow study material. The results of this study can be applied in well managed, homogenous pine stands on the sites of medium fertility. However, the technical quality of an individual stand must be considered, because the stem quality varies a lot between and within young Scots pine stands (Huuskonen et al. 2008).
It can be expected that the external quality of saw logs gets better with longer rotations. Probably this effect is smaller in the treatments of quality thinning and thinning from above because of initially better stem quality compared with the other treatments. So the external quality of pine stems at late final cuttings in the plots of thinning from below and delayed thinning can be underestimated. On the other hand the quality measurements at the stand age of 55 years can better indicate the internal quality of saw logs compared with measurements carried out later because the defects, especially thick knots, are still visible, or only covered by narrow woody layers.
More future research is needed from growth responses and damage risks of trees after different selection principles in thinnings of young stands and from the availability to remove the biggest trees in first thinnings with alternative top heights and stand densities. More detailed studies on the end use value and pricing of stems with different quality and size are needed as well.
Acknowledgements
Anssi Ahtikoski (advice in economics), Jukka Malinen (help and advices in data collection and stem quality), Saija Huuskonen (text revision) and Harri Mäkinen (text revision).
References
Airaksinen P. (1994). Puutavaralajien laatuvaatimukset. [Quality requirements for timber assortments]. In: Tapion taskukirja, 22. uudistettu painos. Kustannusosakeyhtiö Metsälehti, Helsinki. p. 451–453. [In Finnish].
Assman E. (1970). The principles of forest yield study – studies in the organic production, structure, increment and yield of forest stands. Pergamon Press, Oxford. 506 p.
Cajander A.K. (1926). The theory of forest types. Acta Forestalia Fennica 29(3). 108 p. https://doi.org/10.14214/aff.7193.
Eriksson H., Karlsson K. (1997). Effects of different thinning and fertilization regimes on the development of Scots pine (Pinus sylvestris (L.)) and Norway spruce (Picea abies (L.) Karst.) stands in long-term silvicultural trials in Sweden. Swedish University of Agricultural Sciences, Department of Forest Yield Research, Report 42. 135 p. [In Swedish with English summary].
Faustmann M. (1849). Berechnung des Werthes, welchen Waldboden, sowie noch nicht haubare Holzbestände für die Waldwirtschaft besitzen. [Calculation of the value which forest land and immature stands possess for forestry]. Allgemeine Forst und Jagd Zeitung 15: 441–455.
Finnish Statistical Yearbook of Forestry (2004). [Metsätilastollinen vuosikirja 2004]. SVT Maa-, metsä-ja kalatalous 2005. Finnish Forest Research Institute. [Metsäntutkimuslaitos]. 422 p. [English summary: p. 405–412].
Finnish Statistical Yearbook of Forestry (2013). [Metsätilastollinen vuosikirja 2013]. Finnish Forest Research Institute. [Metsäntutkimuslaitos]. 448 p. http://www.metla.fi/metinfo/tilasto/julkaisut/vsk/2013/.
Heinonen J. (1994). Koealojen puu- ja puustotunnusten laskentaohjelma KPL – käyttöohje. [Computer programme package for computing stand and single tree characteristics from sample plot measurements]. The Finnish Forest Research Institute, Research Papers 504. 80 p. http://urn.fi/URN:ISBN:951-40-1369-7. [In Finnish with English summary].
Huuskonen S. (2008). Nuorten männiköiden kehitys – taimikonhoito ja ensiharvennus. [The development of young Scots pine stands – precommercial and first commercial thinning]. Dissertationes Forestales 62. 61 p. [In Finnish with English abstract]. https://doi.org/10.14214/df.62.
Huuskonen S., Ahtikoski A. (2005). Ensiharvennuksen ajoituksen ja voimakkuuden vaikutus kuivahkon kankaan männiköiden tuotokseen ja tuottoon. [Impact of timing and intensity of the first thinning on the yield and profitability of dryish heath pine stands]. Metsätieteen aikakauskirja 2/2005: 99–115. https://doi.org/10.14214/ma.5790. [In Finnish].
Huuskonen S., Hynynen J. (2006). Timing and intensity of precommercial thinning and their effects on the first commercial thinning in Scots pine stands. Silva Fennica 40(4): 645–662. https://doi.org/10.14214/sf.320.
Huuskonen S., Ojansuu R., Hynynen J. (2004). Ensiharvennuksen toteutuksen vaikutus metsikön tuotokseen ja tuottoon. [The effect of first thinning operations on the stand level yield and incomes]. Metsähallituksen metsätalouden julkaisuja 53. 56 p. [In Finnish].
Huuskonen S., Hynynen J., Ojansuu R. (2008). Stand characteristics and external quality of young Scots pine stands in Finland. Silva Fennica 42(3): 397–412. https://doi.org/10.14214/sf.245.
Huuskonen S., Hakala S., Mäkinen H., Hynynen J., Varmola M. (2014). Factors influencing the branchiness of young Scots pine trees. Forestry 87(2): 257–265. https://doi.org/10.1093/forestry/cpt057.
Hynynen J., Arola M. (1999). Ensiharvennusajankohdan vaikutus hoidetun männikön kehitykseen ja harvennuksen kannattavuuteen. [Impact of timing of the first thinning on the development of managed Scots pine stands and on the profitability of thinning]. Metsätieteen aikauskirja 1/1999: 5–23. https://doi.org/10.14214/ma.6436. [In Finnish].
Hynynen J., Ojansuu R., Hökkä H., Siipilehto J., Salminen H., Haapala P. (2002). Models for predicting stand development in MELA System. The Finnish Forest Research Institute, Research Papers 835. 116 p. http://urn.fi/URN:ISBN:951-40-1815-X.
Hynynen J., Ahtikoski A., Siitonen J., Sievänen R., Liski J. (2005). Applying the MOTTI simulator to analyse the effects of alternative management schedules on timber and non-timber production. Forest Ecology and Management 207(1–2): 5–18. https://doi.org/10.1016/j.foreco.2004.10.015.
Hyvän metsänhoidon suositukset. [Silvicultural recommendations for appropriate forest management]. (2006). Metsätalouden kehittämiskeskus Tapio. [Forestry Development Centre Tapio]. Metsäkustannus Oy, Helsinki. 100 p. [In Finnish].
Hyytiäinen K., Tahvonen O. (2002). Economics of forest thinnings and rotation periods for finnish conifer cultures. Scandinavian Journal of Forest Research 17(3): 274–288. https://doi.org/10.1080/028275802753742945.
Kärkkäinen M., Uusvaara O. (1982). Nuorten mäntyjen laatuun vaikuttavia tekijöitä. [Factors affecting the quality of young pines]. Folia Forestalia 515. 28 p. http://urn.fi/URN:ISBN:951-40-0567-8. [In Finnish].
Karttunen K., Laitila J., Ranta T. (2016). First-thinning harvesting alternatives for industrial or energy purposes based on regional Scots pine stand simulations in Finland. Silva Fennica 50(2) article 1521. https://doi.org/10.14214/sf.1521.
Kilpeläinen H. (2002). Apteeraussimulaattorin käyttöohje. [User instructions for bucking simulator]. The Finnish Forest Research Institute, Joensuu Research Unit. 24 p. [In Finnish].
Laasasenaho J. (1982). Taper curve and volume functions for pine, spruce and birch. Communicationes Instituti Forestalis Fenniae 108. 74 p. http://urn.fi/URN:ISBN:951-40-0589-9.
Laitila J. (2008). Harvesting technology and the cost of fuel chips from early thinnings. Silva Fennica 42(2): 267–283. https://doi.org/10.14214/sf.256.
Laitila J., Heikkilä J., Anttila P. (2010). Harvesting alternatives, accumulation and procurement cost of small-diameter thinning wood for fuel in Central Finland. Silva Fennica 44(3): 465–480. https://doi.org/10.14214/sf.143.
Lämsä P., Kellomäki S., Väisänen H. (1990). Nuorten mäntyjen oksikkuuden riippuvuus puuston rakenteesta ja kasvupaikan viljavuudesta. [Branchiness of young Scots pines as related to stand structure and site fertility.] Folia Forestalia 746. 22 p. http://urn.fi/URN:ISBN:951-40-1092-2. [In Finnish with English summary].
Luke’s statistical services. (2015). Natural Resources Institute Finland (Luke). http://stat.luke.fi/en/volumes-and-prices-roundwood-trade. [Cited 1 June 2015].
Mäkinen H., Isomäki A. (2004a). Thinning intensity and growth of Norway spruce stands in Finland. Forestry 77(4): 349–364. https://doi.org/10.1093/forestry/77.4.349.
Mäkinen H., Isomäki A. (2004b). Thinning intensity and growth of Scots pine stands in Finland. Forest Ecology and Management 201(2–3): 311–325. https://doi.org/10.1016/j.foreco.2004.07.016.
Malinen J., Berg V., Kilpeläinen H. (2010). Roundwood pricing mechanisms and their performance in Scots pine roundwood markets. Metlan työraportteja / Working Papers of the Finnish Forest Research Institute 174. 35 p. http://urn.fi/URN:ISBN:978-951-40-2256-2.
Metsänhoitosuositukset. [Recommendations for silviculture]. (1989). Keskusmetsälautakunta Tapio. [Central Forestry Board Tapio]. 55 p. [In Finnish].
Mielikäinen K., Valkonen S. (1991). Harvennustavan vaikutus varttuneen metsikön tuotokseen ja tuottoihin Etelä-Suomessa. [Effect of thinning method on the yield of middle-aged stands in southern Finland]. Folia Forestalia 776. 22 p. http://urn.fi/URN:ISBN:951-40-1167-8. [In Finnish with English summary].
Ministry of Agriculture and Forestry (2011). Kansallinen metsäohjelma 2015. Metsäalasta biotalouden vastuullinen edelläkävijä. [National Forest Program 2015. Forest sector as the responsible actor of bioeconomy]. Maa- ja metsätalousministeriö. ISBN 978-952-453-630-1. [In Finnish].
Näsberg M. (1985). Mathematical programming models for optimal log bucking. Linköping Studies in Science and Technology, dissertation, no 132. Department of Mathematic, Linköping University, Sweden. 198 p.
Näslund M. (1937). Skogsförsöksanstaltens gallringsförsök i tallskog. [Forest Research Intitute’s thinning experiments in Scots pine forests]. Meddelanden från Statens Skogsförsöksanstalt, Hälte 29. 169 p. [In Swedish with German summary].
Niemistö P. (1994). Nuoren männikön ensiharvennus ala-, ylä- tai laatuharvennusta käyttäen. [Thinning pine stand using thinning from below, from above, or quality thinning]. Metsätieteen aikakauskirja 1/1994: 19–32. https://doi.org/10.14214/ma.6044. [In Finnish].
Niemistö P., Huuskonen S., Hynynen J., Siipilehto J. (2018). Intensive intermediate thinnings and the effect of thinning method on growth on Scots pine and Norway spruce stands. Manuscript 23.1.2018.
Nilsson U., Agestam E., Ekö P.-M., Elfving B., Fahlvik N., Johansson U., Karlsson K., Lundmark T., Wallentin C. (2010). Thinning of Scots pine and Norway spruce monocultures in Sweden – effects of different thinning programmes on stand level gross- and net stem volume production. Studia Forestalia Suecica 219. 46 p.
Pettersson F. (2008). Effekt av gallaringsform i tallförsöket Kolfallet – ett underlag för utformningen av olika gallringsstrategier. [The influence of thinning form in the Kolfallet pine trials – an aid to the formulation of different thinning strategier]. Skogforsk. Redogörelse 4/2008: 1–48. [In Swedish].
Pnevmaticos S.M., Mann S.H. (1972). Dynamic programming in tree bucking. Forest Products Journal 22(2): 26–30.
Ruha T., Varmola M. (1997). Precommercial thinning in naturally regenerated Scots pine stands in northern Finland. Silva Fennica 31(4): 401–415. https://doi.org/10.14214/sf.a8537.
Salminen H., Varmola M. (1990). Puolukkatyypin kylvömänniköiden kehitys taimikon myöhäisestä harvennuksesta nuoren metsän ensiharvennukseen. [Development of seeded Scots pine stands from precommercial thinning to first commercial thinning]. Folia Forestalia 752. 29 p. http://urn.fi/URN:ISBN:951-40-1109-0. [In Finnish with English summary].
Salminen H., Lehtonen M., Hynynen J. (2005). Reusing legacy FORTRAN in the MOTTI growth and yield simulator. Computers and Electronics in Agriculture 49(1): 103–113. https://doi.org/10.1016/j.compag.2005.02.005.
Uusvaara O. (1983). Viljelymänniköistä saadun sahatavaran laatu ja arvo. [The quality and value of sawn goods obtained from plantation-grown Scots pine]. The Finnish Forest Research Institute, Research Papers 122. 106 p. http://urn.fi/URN:NBN:fi-metla-201207201917. [In Finnish].
Uusvaara O. (1991). Havaintoja nuorten istutusmänniköiden oksikkuudesta ja puuaineen laadusta. [Observations about the branchiness and the wood quality of young plantation-grown Scots pine]. The Finnish Forest Research Institute, Research Papers 377. 56 p. http://urn.fi/URN:ISBN:951-40-1148-1. [In Finnish with English summary].
Uusvaara O. (1993). Pystykarsituista männiköistä valmistetun sahatavaran laatu ja arvo. [Quality and value of sawn goods from pruned Scots pine stands]. Folia Forestalia 816. 26 p. http://urn.fi/URN:ISBN:951-40-1332-8. [In Finnish with English summary].
Varmola M. (1980). Männyn istutustaimistojen ulkoinen laatu. [The external quality of pine plantations]. Folia Forestalia 451. 21 p. http://urn.fi/URN:ISBN:951-40-0475-2. [In Finnish with English abstract].
Varmola M. (1996). Nuorten viljelymänniköiden tuotos ja laatu. [Yield and quality of young Scots pine cultivations]. The Finnish Forest Research Institute, Research Papers 585. 70 p.+ 6 app. http://urn.fi/URN:ISBN:951-40-1493-6. [In Finnish with English summary].
Varmola M., Salminen H. (2004). Timing and intensity of precommercial thinning in Pinus sylvestris stands. Scandinavian Journal of Forest Research 19(2): 142–151. https://doi.org/10.1080/02827580310019545.
Vuokila Y. (1977). Harsintaharvennus puuntuotantoon vaikuttavana tekijänä. [Selective thinning from above as a factor of growth and yield]. Folia Forestalia 298. 17 p. http://urn.fi/URN:ISBN:951-40-0259-8. [In Finnish with English summary].
Vuokila Y., Väliaho H. (1980). Viljeltyjen havumetsiköiden kasvatusmallit. [Growth and yield models for conifer cultures in Finland]. Communicationes Instituti Forestalis Fenniae 99(2): 1–271. http://urn.fi/URN:NBN:fi-metla-201207171129. [In Finnish with English summary].
Zeide B. (2001). Thinning and growth: a full turnaround. Journal of Forestry 99: 20–25.
Total of 52 references.
