Hamed Yousefzadeh  ,
Abasalt Hosseinzadeh Colagar,
Fatemeh Fallah
,
Abasalt Hosseinzadeh Colagar,
Fatemeh Fallah
Genetic diversity of geographically isolated Iranian populations of Betula pendula Roth: implications for conservation
Yousefzadeh H., Hosseinzadeh Colagar A., Fallah F. (2016). Genetic diversity of geographically isolated Iranian populations of Betula pendula Roth: implications for conservation. Silva Fennica vol. 50 no. 3 article id 1516. https://doi.org/10.14214/sf.1516
Highlights
- The Iranian populations of birches exhibited high levels of genetic diversity, population differentiation, and the presence of unique haplotypes
- The high genetic differentiation amongst the populations may contribute to the local geographical structure and poor gene flow amongst individuals
- The results can potentially be used to adopt appropriate strategies for the conservation and management of isolated tree populations.
Abstract
The effects of long-term habitat fragmentations on genetic and population differentiation of Betula pendula Roth were investigated using chloroplast DNA (cpDNA) variations. Leaf samples were collected from four small remnant populations across the north of Iran. Three pairs of universal primers were used to amplify cpDNA, large single copy regions of trnC-trnD, trnK1-trnK2 and trnD-trnT. A total of 18 of the cpDNA haplotypes in the four populations were identified, however, no clear phylogeographic structuring of haplotypes could be detected. The total genetic diversity (HT) for all populations was high (0.932). Average intra-population genetic diversity was estimated as HS = 0.729 and average differentiation of populations GST = 0.218. Mantel tests of isolation by distance revealed a significant relationship between Wright’s inbreeding coefficient (Fst) and geographical distances for the four populations in Iran (r = 0.77, p < 0.05). The results of the hierarchical analysis of molecular variance (AMOVA) indicated that a 66% variation was partitioned within populations, whilst the variance amongst the four populations was only 34%. We suggest that significant genetic differentiation amongst populations can likely be attributed to reduced gene flow as a result of habitat fragmentation.
Keywords
genetic differentiation;
habitat isolation;
haplotype diversity;
genetic drift;
long-term isolation
-
Yousefzadeh,
Department of Forestry, Faculty of Natural Resources, Tarbiat Modares University, Nour, Mazandaran, Iran
E-mail
h.yousefzadeh@modares.ac.ir
- Hosseinzadeh Colagar, Department of Molecular and Cell Biology; Faculty of Basic Sciences, University of Mazandaran, 47416-95447 Babolsar, Iran E-mail ahcolagar@umz.ac.ir
- Fallah, Department of Molecular and Cell Biology; Faculty of Basic Sciences, University of Mazandaran, 47416-95447 Babolsar, Iran E-mail fatemehfalah69@yahoo.com
Received 29 October 2015 Accepted 24 May 2016 Published 15 June 2016
Views 137608
Available at https://doi.org/10.14214/sf.1516 | Download PDF

1 Introduction
Recurrent climatic oscillations associated with glacial cycles throughout the late Tertiary and the Quaternary period have been associated with extreme changes in the patterns of species distributions and population structures in the northern hemisphere (Liu et al. 2002; Petit et al. 2003; Hewitt 2004). Aitken et al. (2008) expressed that there are three possible fates for forest tree populations in a rapidly changing environment: persistence through migration to track ecological niches spatially; persistence through adaptation to new conditions in current locations; and extirpation. Other factors, such as limited connectivity due to habitat fragmentation, may also influence the genetic structure of populations by restricting gene flow and pollinator activity (Hewitt 2000).
During recent years, chloroplast DNA (cpDNA) has traditionally been the marker of choice due to its ease of amplification and uniparental inheritance in determining the phylogeography or migratory footprints of species (Wang et al. 2012; Fan et al. 2013; Meng and Zhang 2011; Yu and Nason 2011). The chloroplast DNA is generally maternally inherited in most angiosperms (Rajora and Dancik 1992; Dumolin et al. 1995) including Betula pendula Roth.
This uniparental mode of inheritance also means that cpDNA haplotypes (as haploid markers) are only dispersed by seeds. On the other hand, in comparison to the nuclear genome, cpDNA has a smaller effective population size (1/4 in dioecious species and 1/2 in monoecious species, such as silver birch), therefore revealing a clearer picture of the genealogical history of a species (Vettori et al. 2004).
In plant populations seed flow is typically considered to be more limited than pollen flow, therefore, cpDNA based markers are extremely useful for studying the route of seed migration and to identify the locations of major refugia during the Last Glacial Maximum (LGM). Mutation rates are also typically low in chloroplast-DNA, and it is not influenced by recombination (Palme et al. 2003; Heuertz et al. 2004). As a result these features make cpDNA a useful marker for molecular phylogeographic studies (Petit et al. 1993; Newton et al. 1999). Many reports have successfully applied cpDNA markers to identify the locations of glacial refugia and postglacial colonization routes in various plant species including Alnus glutinosa (L.) Gaertn. (King and Ferris 1998), Betula pendula (Palme et al. 2003; Maliouchenko et al. 2007), Quercus alba L. (Csaikl et al. 2002) and Populus nigra L. (Cottrell et al. 2005; Fussi et al. 2010) .
The birch family, Betulaceae, contains trees and shrubs that are an ecologically and economically important component of temperate and boreal forests of the northern Hemisphere (Schenk et al. 2008). The silver birch, Betula pendula, is widely distributed in Europe and Asia Minor, including eastern Turkey, northern Iraq and northern Iran (Krussmann 1984). Betula pendula is a diploid (2n = 28), monoecious, wind-pollinated tree with small seeds that rapidly recolonizes open areas disturbed by forest fire or logging (Fischer et al. 2002; Jonsell 2000). Birches are an important source of timber production and are also important in the pharmacological industry (Martin et al. 2008). In Iran, the natural distribution of B. pendula is limited to the northwestern part of the country in Marmisho valley, Shahrestanak, valley of Lar and Shahrood and the easternmost part of the southern slopes of the Elburz Mountains. Currently the scattered and low-density distribution of B. pendula in Iran has led to its listing as an endangered species in the Red List of plants of Iran (Jalil and Jamzad 1999).
Knowledge of the genetic diversity and population structure of threatened or endangered plant species is critical to their conservation and management (Holsinger and Gottlieb 1991). Currently there are no existing studies of the genetic diversity of B. pendula in Iran. The main objective of this study was to investigate the effect of long-term geographical isolation on the level of genetic variation and to quantify the extent of genetic population differentiation and phylogeographical structure of Iranian populations of B. pendula.
2 Material and methods
2.1 Sampling, DNA extraction and PCR-RFLP analysis
All leaf materials were collected from four out of the five B. pendula populations in the northern part of Iran. The names of populations, geographical positions, size of populations and the number of individuals sampled per population are given in Table 1. In order to avoid investigating clones or close relatives, sampled individuals within a population were separated by at least 100 m.
| Table 1. The geographical characteristics of four isolated populations of Betula pendula in Iran and the sample size (N) in each population. | |||||
| Populations | N | Population area (Hectare) | Latitude (°N) | Longitude (°E) | Altitude (Meter Above sea level) |
| Syahmarzkouh | 6 | 5 | 36° 38´ | 55° 10´ | 2344 |
| Sangedeh | 5 | 100 | 36° 58´ | 53° 10´ | 2579 |
| Shahrestanak | 6 | 5 | 35° 44´ | 51° 23´ | 2404 |
| Marmisho | 5 | 1 | 37° 34´ | 44° 35´ | 1741 |
The leaves were frozen in liquid nitrogen and ground to a fine powder using a pestle and mortar. Total genomic DNA was isolated from the ground powder using a protocol adapted from Porebski et al. (1997). Three pairs of universal primers that were reported by Demesure et al. 1995 and Grivet et al. 2001, were used for the amplification of trnC-trnD (CD), trnK1-trnK2 (K1K2), and trnD-trnT (DT) the chloroplast regions. The names and sequences of these six primers included: trnC-forward (5’-CCAGTTCAAATCTGGGTGTC) and trnD- reverse (5’-GGGATTGTAGTTCAATTGGT); trnK1-forward (5’-GGGTTGCCCGGGACTCGAAC) and trnK2- reverse (5’- CAACGGTAGAGTACTCGGCTTTTA); and trnD-forward (5’-ACCAATTGAACTACAATCCC) and trnT- reverse (5’-CTACCACTGAGTTAAAAGGG). They were used to amplify CD, K1K2, and DT chloroplast regions respectively. PCR reactions were carried out in a total volume of 25 µl consisting: 2.5 µl of 10 X PCR buffer; 0.2 mM dNTPs; 2 mM MgCl2; 0.1 mg. ml–1 Bovine serum albumin (BSA) per double-distilled water filtrated by 0.2 Millipore; 0.2 mM of each of the forward and reverse primers; 1 unit of Taq DNA polymerase and 1.5 µl of genomic DNA. A touch-down PCR program was used for the amplification: 4 min at 94 °C, 14–20 cycles of 45 s at 94 °C, 45 s at 60–48 °C decreasing 0.5 °C with each cycle of 53–40 °C, 3–6 min at 68–72 °C, then 15–20 cycles of 45 s at 94 °C, 45 s at 53–40 °C, 3–6 min at 68–72 °C and finally 10 min at 68–72 °C. Annealing temperatures and cycling time were dependent on the fragment of interest and were obtained from Palme et al. (2003).
For the PCR-RFLP analysis, each of the PCR products were digested with three restriction enzymes: TaqI, HinfI and EcoRI, except the CD amplification products which were digested using only HinfI. The restriction reactions were carried out in a total volume of 10 μl containing: 5.5 μl PCR product (~100 ng); 2.5μl H2O; 1 μl 10X buffer and 1 μl (~3 units) of the restriction enzymes. After mixing these components, the tubes were incubated overnight at temperatures optimal for each restriction enzyme (37 °C for HinfI and EcoRI and 65° C for Taq I).
Restriction fragments were run on an 8% polyacrylamide gel electrophoresis (PAGE) using general Tris-Borate-EDTA buffer at 225 V for 150 min, visualized by silver (AgNo3) staining (Green and Sambrook 2012) and then scanned. Bands were scored as presence (1) vs. absence (0) of the band (Table 2). In order to establish the size of the individual fragments, digested fragments were run alongside a 50 or 100-bp DNA size standard.
| Table 2. The PCR-RFLP chloroplast DNA haplotypes in four isolated populations of Betula pendula in Iran. | |||||||
| Haplotypes | CD-HinfI (NPB = 7) | K1K2-HinfI (NPB = 3) | K1K2-TaqI (NPB = 4) | K1K2-EcoRI (NPB = 3) | DT-HinfI (NPB = 2) | DT-TaqI (NPB = 2) | DT-EcoRI (NPB = 3) |
| A | 0000000 | 001 | 1001 | 111 | 11 | 11 | 011 |
| B | 0010000 | 001 | 1001 | 100 | 00 | 11 | 011 |
| C | 0011111 | 101 | 1001 | 111 | 01 | 01 | 011 |
| D | 0111111 | 001 | 1001 | 101 | 01 | 01 | 011 |
| E | 0111111 | 001 | 1111 | 101 | 01 | 11 | 011 |
| F | 0111111 | 001 | 1111 | 111 | 00 | 11 | 011 |
| G | 0111111 | 101 | 1001 | 111 | 11 | 11 | 011 |
| H | 1010000 | 001 | 1001 | 111 | 00 | 11 | 011 |
| I | 1010000 | 001 | 1001 | 111 | 00 | 11 | 111 |
| J | 1010000 | 011 | 1011 | 111 | 00 | 11 | 011 |
| K | 1110000 | 001 | 1001 | 111 | 00 | 11 | 011 |
| L | 1110000 | 101 | 1001 | 111 | 00 | 11 | 011 |
| M | 1111111 | 001 | 1001 | 100 | 11 | 01 | 111 |
| N | 1111111 | 001 | 1001 | 101 | 01 | 11 | 011 |
| O | 1111111 | 001 | 1001 | 111 | 01 | 11 | 011 |
| P | 1111111 | 001 | 1111 | 101 | 01 | 11 | 011 |
| Q | 1111111 | 011 | 1101 | 100 | 00 | 01 | 011 |
| R | 1111111 | 101 | 1001 | 101 | 11 | 01 | 011 |
| NPB = Number of the polymorphic bands were shown by digestion of the PCR fragments; Only fragment polymorphism associated with each haplotype is represented. | |||||||
Agarose and polyacrylamide gel electrophoresis and gel stain performed by Green and Sambrook (2012) methods. All of the PCR and restriction enzyme reactants were prepared from Fermentas Co. (Leon-Rot, Germany).
2.2 Data analysis
Haplotype diversity and population differentiation was investigated using PCR-RFLP haplotype frequencies obtained from combined analysis of the three chloroplast regions. The mean intra-population gene diversity (HS), the total genetic diversity (HT) and the genetic differentiation amongst populations (GST or Wright’s FST) were calculated. The analysis of molecular variance (AMOVA) was carried out to evaluate variance components and their significance in the levels of variation amongst populations and the individuals within those populations of B. pendula using the GenAlEx v6.5 software (Peakall and Smouse 2006). In order to identify the presence of a phylogeographic structure, comparisons of GST and NST were tested according to Pons and Petit (1996) using PERMUT software. To assess isolation-by-distance (IBD), the Mantel test was used to examine the correlation between pairwise Fst and the corresponding matrix of geographical distances. Estimating the significance of correlation coefficients between geographical and genetic distances amongst the populations was performed using Mantel’s test (Mantel 1967) with PopTools software Ver. 2.5.5. We examined the genetic structure amongst populations using the Bayesian approach and the Markov chain Monte Carlo (MCMC) algorithm implemented in STRUCTURE version 2.2 (Pritchard et al. 2000). The optimum number of subpopulations (K) was confirmed after 10 independent runs for each value of K between 1 and 10. The length of the burn-in period and number of MCMC reps after burn-in were set to 5000 and 50 000, respectively.
3 Results
The average lengths of the three cpDNA regions were approximately 1800 bp for DT; 3800 bp for CD and 2700 bp for K1K2. All seven analyzed primer-enzyme combinations (CD-HinfI, DT-HinfI, DT-TaqI, DT-EcoRI, K1K2-HinfI, K1K2-TaqI and K1K2-EcoRI) revealed genetic variations. Amongst these variable regions, The CD-HinfI fragments were the most varied, displaying seven polymorphic fragments (Table 2). In total, 18 of the cpDNA haplotypes were identified in the four populations (Table 3). The main characteristics of the haplotype distribution are a high number of unique haplotypes and the absence of a clear geographic structuring of the haplotypes, with each of the four populations possessing one or more private haplotypes. Haplotype C had the highest frequency (60%) and was found in Marmishoo. Haplotypes K and N were the next most frequent (33%) and appeared in Shahrestanak and Siahmarzkoh, respectively (Fig. 1). The remaining 15 haplotypes were the least frequent haplotypes with frequencies ranging from 16% to 20%.
| Table 3. The location and distribution of PCR-RFLP chloroplast haplotypes over populations. The Haplotype frequency (Hf) and the total number of haplotypes (tN) found in each of the populations are also given. | ||||||||||||||||||||
| Populations | Haplotypes | tN | Hf | |||||||||||||||||
| A | B | C | D | E | F | G | H | I | J | K | L | M | N | O | P | Q | R | |||
| Siahmarzkoh | 0 | 0 | 0 | 1 | 1 | 0 | 0 | 0 | 0 | 0 | 0 | 0 | 1 | 2 | 0 | 1 | 0 | 0 | 6 | 0.942 |
| Sangdeh | 1 | 0 | 1 | 0 | 0 | 0 | 1 | 0 | 0 | 0 | 0 | 0 | 0 | 0 | 1 | 0 | 1 | 0 | 5 | 0.946 |
| Shahrestanak | 0 | 1 | 0 | 0 | 0 | 1 | 0 | 0 | 0 | 0 | 2 | 1 | 0 | 0 | 0 | 0 | 0 | 1 | 6 | 0.942 |
| Marmishoo | 0 | 0 | 0 | 0 | 0 | 0 | 0 | 3 | 1 | 1 | 0 | 0 | 0 | 0 | 0 | 0 | 0 | 0 | 5 | 0.901 |
| (Hf)% | 20 | 16 | 20 | 16 | 16 | 16 | 20 | 60 | 20 | 20 | 33 | 16 | 16 | 33 | 20 | 16 | 20 | 16 | - | - |
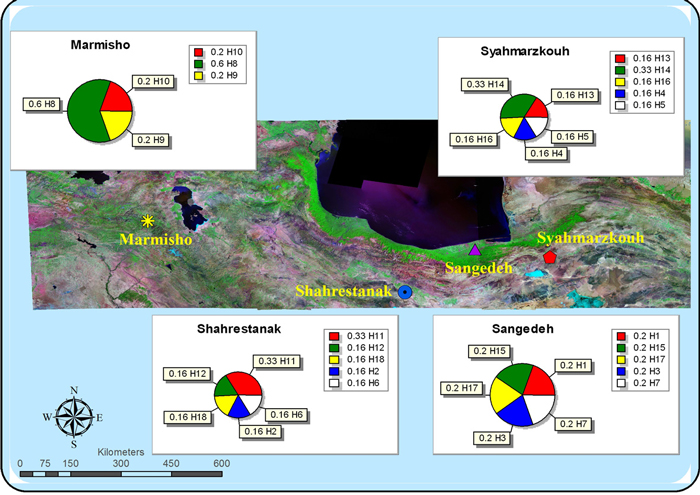
Fig. 1. The geographical distribution of cpDNA haplotypes of four isolated populations of Betula pendula in Iran. View larger in new window/tab.
The parameters obtained from the analysis of genetic diversity and population differentiation of the four populations are shown in Table 4. The total genetic diversity in all populations (HT) was high (0.932, Table 4). Average intra-population genetic diversity was estimated as HS = 0.729, and average differentiation of populations (GST) was 0.218 (Table 4). The highest HT was observed in Sangedeh (0.946). The IBD test revealed a significant relationship between Fst and geographical distances for the four populations (r = 0.77, p < 0.05). The results of the hierarchical AMOVA of cpDNA indicated that 66% variation was partitioned within populations, whilst the variance amongst the four populations was only 34% (all partitions were significant at p < 0.01) (Table 5). The population genetic structure amongst the four populations is shown in Fig. 2 and Table 6. Two major groups of B. pendula were supported by the STRUCTURE analysis. The Sharestanak and Sangedeh populations (1 and 2) formed one group, whereas the Siahmarzkoh and Marmisho (3 and 4), formed the other group.
| Table 4. Estimates of average gene diversity within four isolated populations of Betula pendula in Iran (HS), total gene diversity (HT), inter-population differentiation (GST), and the number of substitution types (NST), with permut, using a permutation test with 1000 permutations. | ||||
| Populations | HS | HT | GST | NST |
| Syahmarzkouh | 0.776 | 0.942 | 0.197 | - |
| Sangedeh | 0.800 | 0.946 | 0.188 | - |
| Shahrestanak | 0.776 | 0.942 | 0.197 | - |
| Marmisho | 0.560 | 0.901 | 0.305 | - |
| Total | 0.729 | 0.932 | 0.218 | 0.281 |
| Table 5. Analyses of molecular variance (AMOVA) for four isolated populations of Betula pendula in Iran by PCR-RFLP: Statistics include sums of squared deviations (SSD); mean squared deviations (MSD), variance component estimates, the percentage of the total variance contributed by each component and the probability of obtaining a more extreme component estimate by chance alone. | ||||||||
| Source | df | SSD | MSD | Est. Var. | Pvar | p-value | ||
| Among population | 3 | 31.997 | 10.666 | 1.429 | 34% | 0.010 | ||
| Within population | 18 | 50.867 | 2.826 | 2.826 | 66% | 0.010 | ||
| Total | 21 | 82.864 | 4.255 | 100% | ||||
| df = degree of freedom; Est. Var. = Estimates variance; Pvar = Percentage of variance. | ||||||||
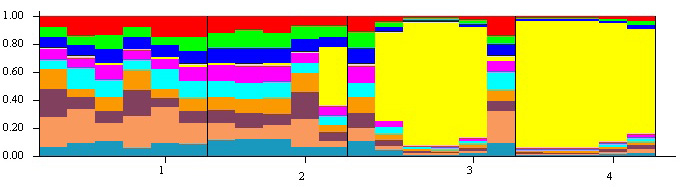
Fig. 2. The population structure of four isolated populations of Betula pendula in Iran estimated by STRUCTURE. In the figure, the individuals were categorized by population (1- Syahmarzkouh; 2- Sangedeh; 3- Shahrestanak; and 4- Marmisho).
| Table 6. The proportion of membership of each pre-defined population (Four isolated populations of Betula pendula in Iran) in each of the four clusters. | ||||
| Cluster | 1 | 2 | 3 | 4 |
| 1 | 0.013 | 0.269 | 0.384 | 0.334 |
| 2 | 0.113 | 0.294 | 0.296 | 0.296 |
| 3 | 0.597 | 0.104 | 0.161 | 0.138 |
| 4 | 0.940 | 0.019 | 0.020 | 0.021 |
| AD | 0.0242 | 0.1741 | 0.1510 | 0.1618 |
| AD = Average distances between individuals in same cluster. | ||||
4 Discussion
Understanding the genetic structure and diversity of endangered plant species is the first step to developing an appropriate management policy (Holsinger and Gottlieb 1991).
It is expected that species with limited geographical ranges should possess relatively lower genetic diversity than species with wide distributions (Luan et al. 2006; Wang et al. 2012; Zhao et al. 2012). As expected from birch and woody species, the Iranian birch populations are genetically diverse (HT = 0.932) because the species in general has a wide distribution. Other hand, we did identify significant differences amongst the four birch populations from Iran. Thus, even the small populations in Iran carry some of the general diversity of the species. This result is in accordance with the studies of other Betula species (Maliouchenko et al. 2007; Palme et al. 2003). The level of genetic diversity was reported high in the B. pendula subsp. fontqueri populations from the Iberian Peninsula (Martin et al. 2008). Zeng et al. (2003), in their study of Betula alnoides populations, found a high genetic diversity and reported that 64.1% of the RAPD markers were polymorphic. Life history characteristics, including seed and pollen dispersal mechanisms, and geographical distribution are important in influencing the pattern of genetic diversity (Hamrick et al. 1992).
Despite the destruction of birch habitats in Iran, we found that the genetic diversity of B. pendula populations was surprisingly high. Similar results have been reported for Betula humilis (Jadwiszczak et al. 2012), Prunus spinosa and Nouelia insignis (Luan et al. 2006; Zhao et al. 2012). It has been suggested that such high levels of genetic diversity may reflect only recent (post-establishment) population size reductions, especially in the last two generations. In such cases, the genetic diversity of the remaining trees is attributed to the large size and allelic richness of the original population (Luan et al. 2006; Qiao et al. 2010; Zhao et al. 2012). Also different environmental conditions can affect the amount of genetic differentiation. Xie et al. (2009) expressed the close relationship that exists between genetic diversity and geographical conditions. They stated that bottleneck is the main cause of the genetic diversity of Betula luminifera H.J.P.Winkl in China. Esmaeilpour et al. (2014) have demonstrated that the two studied populations (Sharestanak and Marmishoo) are currently undergoing a population bottleneck.
Gene flow is a vital element in local adaptation and bears a particularly strong influence against speciation in evolutionary processes (Slatkin 1985; Kronforst 2008; Shen et al. 2014). The high genetic differentiation amongst Iranian B. pendula populations (GST = 0.206) may contribute to the local geographical structure and poor gene flow amongst individuals. A geographical barrier increases the probability of extinction or local adaptation of Iranian birch populations and it may cause these populations to evolve into a different types of populations with a unique genetic structure (Shen et al. 2014).
On the other hand, the amount of gene flow, being less than one, indicates the occurrence of genetic drift in Iranian birch populations. In fact, the long-term isolation has led to genetic differentiation due to drift. Lee et al. (2013) expressed that high levels of variation are expected in areas where migration waves from different refugia meet. In these areas, however, the levels of unique alleles should be low.
Iranian populations exhibited high levels of genetic diversity, population differentiation, and the presence of unique haplotypes. According to the basic expansion and contraction model (Hewitt 1996), populations of B. pendula in Iran can be considered as refugial because they possess the main characteristics of refugia, including high levels of genetic diversity, genetic differentiation, and a high number of unique haplotypes. Elevation gradients in Iran should have facilitated the persistence of B. pendula in Iran during the Pleistocene seeing as only short altitudinal shifts across the steep topography would have been required to track suitable niches during the LGM (Feliner 2011). We believe that the Iranian refugia could have possessed sufficient moisture to remain as a temperate forest during drier climatic phases of the Pleistocene. These regions are located within mountainous areas, elevations of around 2000 meters, and contain old forests recognized as important floristic areas with high species diversity and endemism for many plant taxa (Zare et al. 2010). For example, Sangedeh population is particularly one of the alpine habitats in Hyrcanian forest where 33 species out of 181 are endemic (18%), which alone makes up 9% of the endemic flora of Iran (Zare et al. 2010).
5 Conclusion
Due to more susceptible and greater risk of extinction of small isolated populations, conservation biologists advocate the comprehensive researches on isolated populations of a species. Despite the destruction of birch habitats in Iran, our results showed the unexpectedly high genetic diversity within small population of Iranian birch. As one of the main characteristics of glacial refugia is a high genetic diversity within populations and high genetic differentiation between populations (Hampe and Petit 2005; Hewitt 1996), it seems plausible that the Iranian populations of birch are remnants of formerly large populations that have recolonized northwards to higher latitudes during the post-glacial era. Based on our findings, we suggest that habitat fragmentation has led to significant genetic differentiation that may be attributed to low levels of gene flow due to geographic isolation. On the other hand, high genetic diversity and high population genetic differentiation within Iranian’s Betula populations is somewhat surprising. We proposed that conservation efforts should focus on preserving the genetic material from a large number of individuals from all remaining populations in order to facilitate future restoration efforts.
Acknowledgements
We thank Dr. Mohammad Esmailpour for sampling help and Dr. Ashley M. Thomson for technical comments. We also thank Dr. Mehdi Gholamalifard for assistance in providing images for this manuscript.
References
Aitken S.N., Yeaman S., Holliday J.A., Wang T., Curtis-McLane. S. (2008). Adaptation, migration or extirpation: climate change outcomes for tree populations. Evolutionary Application 1(1): 95–111. http://dx.doi.org/10.1111/j.1752-4571.2007.00013.x.
Cottrell J.E., Krystufek V., Tabbener H.E., Milner A.D., Connolly T., Sing L., Fluch S., Burg K., Lefèvre F., Achard P., Bordács S., Gebhardt K., Vornam B., Smulders M.J.M., VandenBroeck A.H., Slycken JV., Storme V., Boerjan W., Castiglione S., Fossati T., Alba N., Agundez D., Maestro C., Notivol E., Bovenschen J., van Dam B.C. (2005). Postglacial migration of Populus nigra L.: lessons learnt from chloroplast DNA. Forest Ecology and Managements 206(1): 71–90. http://dx.doi.org/10.1016/j.foreco.2004.10.052.
Csaikl U.M., Glaz I., Baliuckas V., Petit R.J., Jensen J.S. (2002). Chloroplast DNA variation of white oak in the Baltic countries and Poland. Forest ecology and management 156(1): 211–222. http://dx.doi.org/10.1016/S0378-1127(01)00644-2.
Demesure B., Sodzi N., Petit R.J. (1995). A set of universal primers for amplification of polymorphic non-coding regions of mitochondrial and chloroplast DNA in plants. Molecular Ecology 4(1): 129–134. http://dx.doi.org/10.1111/j.1365-294X.1995.tb00201.x.
Dumolin S., Demesure B., Petit R.J. (1995). Inheritance of chloroplast and mitochondrial genomes in pedunculate oak investigated with an efficient PCR method. Theoretical and Applied Genetics 91(8): 1253–1256. http://dx.doi.org/10.1007/BF00220937.
Esmaeilpour M., Taheri Abkenar K., Aalami A., Eslam Bonyad A. (2014). Genetic diversity in white birch (Betula pendula Roth) stands using microsatellite marker. Genetic Novin 4: 501–510.
Fan D.M., Yue J.P., Nie ZL., Li Z.M., Comes H.P., Sun H. (2013). Phylogeography of Sophora davidii (Leguminosae) across the ‘Tanaka-Kaiyong Line’, an important phytogeographic boundary in Southwest China. Molecular Ecology 22(16): 4270–4288. http://dx.doi.org/10.1111/mec.12388.
Feliner G.N. (2011). Southern European glacial refugia: a tale of tales. Taxon 60(2): 365–372.
Fischer A., Lindner M., Abs C., Lasch P. (2002). Vegetation dynamics in central European forest ecosystems (near-natural as well as managed) after storm events. Folia Geobotanica 37(1): 17–32. http://dx.doi.org/10.1007/BF02803188.
Fussi B., Lexer C., Heinze B. (2010). Phylogeography of Populus alba (L.) and Populus tremula (L.) in Central Europe: secondary contact and hybridization during recolonisation from disconnected refugia. Tree Genetic and Genomes 6(3): 439–450. http://dx.doi.org/10.1007/s11295-009-0262-5.
Green M.R., Sambrook J. (2012). Molecular cloning: a laboratory manual, 4th edn. Cold Spring Harbor Laboratory Pres.
Grivet D., Heinze B., Vendramin G.G., Petit R.J. (2001). Genome walking with consensus primers: application to the large single copy region of chloroplast DNA. Molecular Ecology Notes 1(4): 345–349. http://dx.doi.org/10.1046/j.1471-8278.2001.00107.x.
Hampe A., Petit R.J. (2005). Conserving biodiversity under climate change: the rear edge matters. Ecology Letters 8(5): 461–467. http://dx.doi.org/10.1111/j.1461-0248.2005.00739.x.
Hamrick J.L., Godt M.J.W., Sherman-Broyles S.L. (1992). Factors influencing levels of genetic diversity in woody plant species. In Population genetics of forest trees. Springer Netherlands. p. 95–124. http://dx.doi.org/10.1007/978-94-011-2815-5_7.
Heuertz M., Fineschi S., Anzidei M., Pastorelli R., Salvini D., Paule L., Frascaria-Lacoste N., Hardy O.J., Vekemans X., Vendramin G.G. (2004). Chloroplast DNA variation and postglacial recolonization of common ash (Fraxinus excelsior L.) in Europe. Molecular Ecology 13(11): 3437–3452. http://dx.doi.org/10.1111/j.1365-294X.2004.02333.x.
Hewitt G. (2000). The genetic legacy of the Quaternary ice ages. Nature 405(6789): 907–913. http://dx.doi.org/10.1038/35016000.
Hewitt G.M. (1996). Some genetic consequences of ice ages, and their role in divergence and speciation. Biological Journal of the Linnean Society 58(3): 247–276. http://dx.doi.org/10.1111/j.1095-8312.1996.tb01434.x.
Hewitt G.M. (2004). Genetic consequences of climatic oscillations in the Quaternary. Philosophical Transactions of the Royal Society B, Biological 359(1442): 183–195.
Holsinger K.E., Gottlieb L.D. (1991). Conservation of rare and endangered plants: principles and prospects. Genetics and conservation of rare plants. Oxford University Press, New York. p. 195–208.
Jadwiszczak K.A., Banaszek A., Jabłońska E., Sozinov O.V. (2012). Chloroplast DNA variation of Betula humilis Schrk. in Poland and Belarus. Tree Genetic and Genomes 8(5): 1017–1030. http://dx.doi.org/10.1007/s11295-012-0482-y.
Jalil A., Jamzad Z. (1999). Red data book of Iran: a preliminary survey of endemic, rare and endangered plant species in Iran. Research Institute of Forests and Rangelands, Tehran, Iran. 748 p.
Jonsell B. (2000). Flora Nordica. Volume 1. Lycopodiaceae to Polygonaceae. The Bergius Foundation, the Royal Swedish Academy of Sciences, Stockholm, Sweden. 344 p.
King R.A., Ferris C. (1998). Chloroplast DNA phylogeography of Alnus glutinosa (L.) Gaertn. Molecular Ecology 7(9): 1151–1161. http://dx.doi.org/10.1046/j.1365-294x.1998.00432.x.
Kronforst M.R. (2008). Gene flow persists millions of years after speciation in Heliconiusbutterflies. BMC Evolutionary Biology 8(1): 98. http://dx.doi.org/10.1186/1471-2148-8-98.
Krussmann G. (1984). Manual of cultivated broad-leaved trees and shrubs. Vol. 1: A–D. Translated by Epp M. Timber Press, London. p. 220–232. .
Lee J.H., Lee D.H., Choi B.H. (2013). Phylogeography and genetic diversity of East Asian Neolitsea sericea (Lauraceae) based on variations in chloroplast DNA sequences. Journal of Plant Research 126(2): 193–202. http://dx.doi.org/10.1007/s10265-012-0519-1.
Liu J.Q., Gao T.G., Chen ZD., Lu A.M. (2002). Molecular phylogeny and biogeography of the Qinghai-Tibet Plateau endemic Nannoglottis (Asteraceae). Molecular Phylogenetics and Evolution 23(3): 307–325. http://dx.doi.org/10.1016/S1055-7903(02)00039-8.
Luan S., Chiang T.Y., Gong X. (2006). High genetic diversity vs. low genetic differentiation in Nouelia insignis (Asteraceae), a narrowly distributed and endemic species in China, revealed by ISSR fingerprinting. Annals of Botany 98(3): 583–589.
Maliouchenko O., Palmé AE., Buonamici A., Vendramin G.G., Lascoux M. (2007). Comparative phylogeography and population structure of European Betula species, with particular focus on B. pendula and B. pubescens. Journal of Biogeography 34(9): 1601–1610. http://dx.doi.org/10.1111/j.1365-2699.2007.01729.x .
Mantel N. (1967). The detection of disease clustering and a generalized regression approach. Cancer Research 27(2 Part 1): 209–220.
Martín C., Parra T., Clemente-Muñoz M., Hernandez-Bermejo J.E. (2008). Genetic diversity and structure of the endangered Betula pendula subsp. fontqueri populations in the south of Spain. Silva Fennica 42(4): 487–498. http://dx.doi.org/10.14214/sf.229.
Meng H.H., Zhang M.L. (2011). Phylogeography of Lagochilus ilicifolius (Lamiaceae) in relation to Quaternary climatic oscillation and aridification in northern China. Biochemical Systematics and Ecology 39(4): 787–796. http://dx.doi.org/10.1016/j.bse.2011.07.015.
Newton A.C., Allnutt T.R., Gillies A.C.M., Lowe A.J., Ennos R.A. (1999). Molecular phylogeography, intraspecific variation and the conservation of tree species. Trends in Ecology and Evolution 14(4): 140–145. http://dx.doi.org/10.1016/S0169-5347(98)01555-9.
Palmé A.E., Su Q., Rautenberg A., Manni F., Lascoux M. (2003). Postglacial recolonization and cpDNA variation of silver birch, Betula pendula. Molecular Ecology 12(1): 201–212. http://dx.doi.org/10.1046/j.1365-294X.2003.01724.x.
Peakall R.O.D., Smouse P.E. (2006). GENALEX 6: genetic analysis in Excel. Population genetic software for teaching and research. Molecular Ecology Notes 6(1): 288–295. http://dx.doi.org/10.1111/j.1471-8286.2005.01155.x.
Petit R.J., Kremer A., Wagner D.B. (1993). Finite island model for organelle and nuclear genes in plants. Heredity 71(6): 630–641. http://dx.doi.org/10.1038/hdy.1993.188.
Petit R.J., Aguinagalde I., de Beaulieu J.L., Bittkau C., Brewer S., Cheddadi R., Ennos R., Fineschi S., Grivet D., Lascoux M., Mohanty A., Muller-Starck G., Demesure-Musch B., Palme A., Martin J.P., Rendell S., Vendramin G.G. (2003). Glacial refugia: hotspots but not melting pots of genetic diversity. Science 300: 1563–1565. http://dx.doi.org/10.1126/science.1083264.
Pons O., Petit R.J. (1996). Measuring and testing genetic differentiation with ordered versus unordered alleles. Genetics 144(3): 1237–1245.
Porebski S., Bailey L.G., Baum B.R. (1997). Modification of a CTAB DNA extraction protocol for plants containing high polysaccharide and polyphenol components. Plant Molecular Biology Reporter 15(1): 8–15. http://dx.doi.org/10.1007/BF02772108.
Pritchard J.K., Stephens M., Donnelly P. (2000). Inference of population structure using multilocus genotype data. Genetics 155(2): 945–959.
Qiao Q., Zhang C.Q., Milne R.I. (2010). Population genetics and breeding system of Tupistra pingbianensis (Liliaceae), a naturally rare plant endemic to SW China. Journal of Systematics and Evolution 48(1): 47–57. http://dx.doi.org/10.1111/j.1759-6831.2009.00064.x.
Rajora O.P., Dancik B.P. (1992). Chloroplast DNA inheritance in Populus. Theoretical and Applied Genetics 84(3–4): 280–285. http://dx.doi.org/10.1007/bf00229483.
Schenk M.F., Thienpont C.N., Koopman W.J., Gilissen L.J., Smulders M.J. (2008). Phylogenetic relationships in Betula (Betulaceae) based on AFLP markers. Tree Genetics and Genomes 4(4): 911–924. http://dx.doi.org/10.1007/s11295-008-0162-0.
Shen D., Bo W., Xu F., Wu R. (2014). Genetic diversity and population structure of the Tibetan poplar (Populus szechuanica var. tibetica) along an altitude gradient. BMC Genetics 15 (Suppl. 1). http://dx.doi.org/10.1186/1471-2156-15-S1-S11.
Slatkin M. (1985). Gene flow in natural populations. Annual Review of Ecology and Systematics 16. 393–430. http://dx.doi.org/10.1146/annurev.es.16.110185.002141.
Thorsson A. E. Th., Pálsson S, Lascoux M, Anamthawat-Jónsson K (2010). Introgression and phylogeography of Betula nana (diploid), B. pubescens (tetraploid) and their triploid hybrids in Iceland inferred from cpDNA haplotype variation. Journal of Biogeography 37(11): 2098–2110. http://dx.doi.org/10.1111/j.1365-2699.2010.02353.x.
Vettori C., Vendramin G.G., Anzidei M., Pastorelli R., Paffetti D., Giannini R. (2004). Geographic distribution of chloroplast variation in Italian populations of beech (Fagus sylvatica L.). Theoretical and Applied Genetics 109(1): 1–9. http://dx.doi.org/10.1007/s00122-004-1609-9.
Wang X.M., Hou X.Q., Zhang Y.Q., Yang R., Feng S.F., Li Y., Ren Y. (2012). Genetic diversity of the endemic and medicinally important plant Rheum officinale as revealed by inter-simpe sequence repeat (ISSR) markers. International Journal of Molecular Science 13(3): 3900–3915. http://dx.doi.org/10.3390/ijms13033900.
Xie Y., Li Z., Huang R., Xiao X., Huang Y. (2009). Genetic diversity of Betula luminifera populations at different elevations in Wuyi Mountain and its association with ecological factors. Front Forestry China 4(1): 90–95. http://dx.doi.org/10.1007/s11461-009-0010-x.
Yu H., Nason J.D. (2013). Nuclear and chloroplast DNA phylogeography of Ficus hirta: obligate pollination mutualism and constraints on range expansion in response to climate change. New Phytologist 197(1): 276–289. http://dx.doi.org/10.1111/j.1469-8137.2012.04383.x.
Zare H., Akbarinia M., Hosseini S.M., Ejtehadi H., Amini E.T. (2010). A new record of Betula litwinowii (Betulaceae) and a review of the geographical distribution of the genus Betula L. in Iran. Iranian Journal of Botany 16: 237–241.
Zeng J., Zou Y., Bai J., Zheng H. (2003). RAPD analysis of genetic variation in natural populations of Betula alnoides from Guangxi, China. Euphytica 134: 33–41. http://dx.doi.org/10.1023/A:1026113506563.
Zhao X., Ma Y., Sun W., Wen X., Milne R. (2012). High genetic diversity and low differentiation of Michelia coriacea (Magnoliaceae), a critically endangered endemic in southeast Yunnan, China. International Journal of Molecular Science 13(4): 4396–4411. http://dx.doi.org/10.3390/ijms13044396.
Total of 53 references.
