Paul N. Katjutin  ,
Natalia I. Stavrova,
Vadim V. Gorshkov,
Andrew Yu. Lyanguzov,
Irina Ju. Bakkal,
Sergey A. Mikhailov
,
Natalia I. Stavrova,
Vadim V. Gorshkov,
Andrew Yu. Lyanguzov,
Irina Ju. Bakkal,
Sergey A. Mikhailov
Radial growth of trees differing in their vitality in the middle-aged Scots pine forests in the Kola peninsula
Katjutin P. N., Stavrova N. I., Gorshkov V. V., Lyanguzov A. Yu., Bakkal I. Ju., Mikhailov S. A. (2020). Radial growth of trees differing in their vitality in the middle-aged Scots pine forests in the Kola peninsula. Silva Fennica vol. 54 no. 3 article id 10263. https://doi.org/10.14214/sf.10263
Highlights
- Unmanaged middle-aged boreal Scots pine forests in the Kola peninsula are characterised by the prevalence of moderately and strongly weakened trees (65–70%)
- Radial increment and basal area increment differ greatly (70–75% and 85–90%, respectively) between Scots pine trees differing in their vitality
- The trends of annual ring width in Scots pine trees aged from 15–35 to 65–85 years in green moss and green moss-lichen type pine forests are similar
- the dynamics of basal area increment differs substantially in relation to forest site type.
Abstract
The research was carried out in unmanaged middle-aged (75–85 years) Northern taiga Scots pine (Pinus sylvestris L.) forests in the Kola peninsula. It was established that forests of green moss-lichen and green moss site types are characterised by a predominance (65–70% by stand volume) of moderately and strongly weakened trees. Trees of differing vitality have significant differences in annual increment. Healthy trees had a radial increment (RI) 70–75% greater than that of dying trees, and a basal area increment (BAI) 85–90% greater. The dynamics of the RI and BAI of Scots pine trees for the 70-year period (from 1945 to 2015) is different. The RI of all individuals in the communities studied decreases consistently. The decrease is expressed more strongly in green moss Scots pine forests (80–95% from 1945 to 2015) compared to green moss-lichen forests (60–80%); it manifests itself more in strongly weakened and dying individuals (75–95%) than in healthy and moderately weakened ones (60–80%). Annual basal area increment in green moss Scots pine forests increases by 45–65% from stand establishment until the trees are 25 to 35 years old and subsequently decreases by 50–80% to 70–80 years of age. In green moss-lichen pine forests the BAI of Scots pine remains rather stable in healthy and moderately weakened trees and decreases in strongly weakened and dying individuals by 45% and 75–80%, respectively throughout the studied period.
Keywords
Pinus sylvestris;
northern taiga;
radial increment;
basal area increment
-
Katjutin,
Komarov Botanical Institute of the Russian Academy of Sciences, Professora Popova str. 2, 197376, Saint-Petersburg, Russia
E-mail
paurussia@binran.ru
- Stavrova, Komarov Botanical Institute of the Russian Academy of Sciences, Professora Popova str. 2, 197376, Saint-Petersburg, Russia E-mail nstavrova@binran.ru
- Gorshkov, Komarov Botanical Institute of the Russian Academy of Sciences, Professora Popova str. 2, 197376, Saint-Petersburg, Russia; Saint-Petersburg State Forest Technical University, letter U, 5, Institutsky per., 194021, Saint-Petersburg, Russia E-mail vgorshkov@binran.ru
- Lyanguzov, Saint-Petersburg State University, 7/9 Universitetskaya Emb., 199034, Saint-Petersburg, Russia E-mail andrewlyanguzov@gmail.com
- Bakkal, Komarov Botanical Institute of the Russian Academy of Sciences, Professora Popova str. 2, 197376, Saint-Petersburg, Russia E-mail bakkal@binran.ru
- Mikhailov, Komarov Botanical Institute of the Russian Academy of Sciences, Professora Popova str. 2, 197376, Saint-Petersburg, Russia E-mail smikhailov@binran.ru
Received 24 October 2019 Accepted 9 July 2020 Published 21 July 2020
Views 59915
Available at https://doi.org/10.14214/sf.10263 | Download PDF

1 Introduction
The research concerning the radial growth of trees primarily analyse climatic and anthropogenic factors external to the forest community (Vaganov et al. 2006; Juknys et al. 2014; Vacek et al. 2017). The radial increment of forest-forming conifer trees shows a high (r = –0.5–0.8) air pollution sensitivity (Juknys et al. 2014; Yarmishko 2015). Some studies have identified significant relationships (r = |0.3–0.6|) between annual ring width and weather in the growing season (Pichler and Oberhuber 2007; Hordo et al. 2011; Helama et al 2012; Vacek et al. 2017). Precipitation deficit and high temperature in spring-summer period result in lowered Scots pine (Pinus sylvestris L.) and Picea abies (L.) Karst. radial growth in Central Europe, while in Northern Europe the tree rings and the temperature correlate positively. Intracoenotic factors connected with intra- and inter-specific competition between trees are also important resulting in the differentiation of individuals in terms of growth rate and vitality status (Demidko et al. 2010; Das 2012; Hereş et al. 2018). Several authors found a significant correlation between stem radial growth and main indicators of vitality status of conifer trees such as crown density (Demidko 2011; Cortini et al. 2016; Donnelly et al. 2017) and needle mass (Vanninen 2004). Using Pinus sibirica Du Tour as an example, Demidko et al. (2010) showed that the radial increment in strongly weakened individuals at the age of 60 and 140 years is 35% and 65% lower than in healthy ones. The study of the vitality state–radial growth relationships make it possible to predict the loss of tree productivity in relation to healthy trees based on visual assessment. However, this relationship may vary between species and regions. We are currently aware of very few studies, which have examined radial growth of trees differing in their vitality status.
The main objectives of this research are (1) to characterize the vitality structure of middle-aged Northern taiga Scots pine stands; (2) to compare the radial increment and basal area increment in Scots pine trees of differing vitality; (3) to detect the difference in dynamics of radial increment and basal area increment in Scots pine forests in different site types.
2 Materials and methods
2.1 Study area
The research was carried out in the Kola peninsula in Scots pine forests of the green moss-lichen site type Pinetum hylocomioso-cladinosum and the green moss site type Pinetum empetroso-myrtillosum (Neshatayev and Neshatayeva 1993), corresponding to Empetrum-Vaccinium and Hylocomium-Myrtillus site types of the Finnish site type classification system (Cajander 1949). The forests were formed after stand-replacing fires between 1920 and 1930. There have been no forestry activities in the study area.
The green moss-lichen and green moss Scots pine forests grow on central and lower hill slopes and on the plains formed by sandy, glacial and aqueoglacial deposits. Typical soil type is Albic Rustic Podzol (Arenic) (World reference base… 2015).
In the study area, the tree stratum includes Pinus sylvestris and Betula pubescens Ehrh. of post-fire origin with a diameter over 4 cm at breast height (Table 1). The dwarf shrub herb layer is dominated by Vaccinium vitis-idea L., Vaccinium myrtillus L. and Empetrum hermaphroditum Hagerup. The green moss-lichen cover consists primarily of mosses Pleurozium schreberi (Brid.) Mitt. and Dicranum polysetum Sw., and lichens – Cladonia stellaris (Opiz) Pouzar & Vezda, Cladonia rangiferina (L.) F. H. Wigg. and Cladonia mitis Sandst.
| Table 1. Stand characteristics on the permanent study areas (PSA) in the Kola peninsula. | |||||||||
| PSA number | PSA size, ha | PSA coordinates | Species | Age, years | DBH, cm | Н, m | N, ind. ha–1 | S, m2 ha–1 | V, m3 ha–1 |
| Green moss-lichen type | |||||||||
| 1 (75) | 0.10 | 67°51´N, 31°23´E | P | 70 | 11.9 | 11.5 | 1156 | 12.9 | 74.2 |
| B | no data | 7.9 | 7.7 | 478 | 2.3 | 8.9 | |||
| 2 (90) | 0.20 | 67°51´N, 31°23´E | P | 81 | 17.6 | 15.0 | 420 | 10.2 | 76.5 |
| B | no data | 4.5 | 3.6 | 32 | 0.05 | 0.1 | |||
| 3 (91) | 0.10 | 67°51´N, 31°25´E | P | 69 | 15.9 | 12.0 | 655 | 13.1 | 78.6 |
| B | no data | 7.7 | 8.2 | 273 | 1.3 | 5.3 | |||
| Mean value | P | 74 | 15.1 | 12.8 | 744 | 12.1 | 76.4 | ||
| B | no data | 6.7 | 6.5 | 261 | 1.2 | 3.9 | |||
| Green moss type | |||||||||
| 4 (93) | 0.20 | 67°49´N, 31°19´E | P | 69 | 10.9 | 10.5 | 3100 | 29.0 | 152.3 |
| B | no data | 5.3 | 6.1 | 120 | 0.26 | 0.8 | |||
| 5 (94) | 0.10 | 67°49´N, 31°19´E | P | 70 | 14.5 | 14.6 | 1480 | 24.6 | 179.6 |
| B | no data | 6.1 | 8.4 | 140 | 0.41 | 1.7 | |||
| 6 (99) | 0.20 | 67°49´N, 33°19´E | P | 75 | 15.0 | 14.2 | 1420 | 25.1 | 178.2 |
| B | no data | 7.3 | 7.9 | 320 | 1.3 | 5.1 | |||
| Mean value | P | 71 | 13.5 | 13.1 | 2000 | 26.3 | 172.3 | ||
| B | no data | 6.2 | 7.5 | 193 | 0.66 | 2.5 | |||
| P – Scots pine; B – pubescent birch; H – height; N – number of individuals; S – basal area; V – volume. | |||||||||
2.2 Measurements
The research was carried out in 6 permanent study areas (PSA), 0.10–0.20 ha of size (3 PSA in the green moss-lichen pine forest and 3 PSA in the green moss pine forest). Core samples were selected from 30–100 Scots pine trees aged 50–85 years (several post-fire generations that form the basis of the stand) at the height of 1.3 m using a Pressler increment borer. Radial increment was measured following standard techniques using a MBS-10 microscope and a semi-automated unit LINTAB-6 accurate to 0.01 mm.
The vitality status of the Scots pine trees was determined in according to recommended practices (Alexeyev 1989; Yarmishko et al. 2003), based on the comparison of crown density with a reference individual assigned the value of 100%. The reference individual is an unsuppressed tree growing under equivalent ecological conditions. The crown density was estimated visually. The final grade was the average of the two definitions. Tree vitality state was evaluated using 5 categories: I – healthy (non-oppressed) trees – relative crown density (CD) >75–100%; II – moderately weakened (moderately oppressed) trees – CD >50–75%; III – strongly weakened (strongly oppressed) trees – CD >25–50%; IV – dying trees – CD >0–25%; V – dry trees.
Vitality distributions of Scots pine were calculated, both by the number of trees and by volume. The volume proportion (%) of trees of any vitality state (Pv) was estimated using the equations:
![]()
![]()
where Vi is the volume of trees of any vitality state; V is stand volume, m3 ha–1; S is stand basal area, m2 ha–1; H is average height, m; f is the coefficient equal to 0.5.
Mean values for radial increment (RI) and basal area increment (BAI) in live P. sylvestris trees were calculated according to the method developed by the authors (Lyanguzov et al. 2017), on the basis of the measured values of tree ring widths.
The sequence of annual RI of every tree was presented by a numerical series P1... Pn (mm) for the period starting from the conditional first year (the first radius R1) up to the last year. The radii (R) of the rings were calculated by consecutive summarisation R1 = P1, R2 = R1 + P2, R3 = R2 + P3, …, Rn = Rn–1 + Pn (or a reverse procedure of subtraction from the full radius of the trunk Rn–1 = Rn – Pn …). The area of the circles was calculated consecutively using the formula:
![]()
To calculate the BAI value (dSi), the smaller circle area was consistently subtracted from the larger circle area:
![]()
For processing and presentation of the results, a script developed by the authors on the basis of free programming language R (R Core Team 2013…) was used. The script handled the following objectives: data presorting; calculation of BAI values of individual trees; grouping of values by the vitality status of trees and time intervals; estimation of parameters for distribution of characteristics with the help of the bootstrap method and construction of graphs.
The dynamics of the radial growth of trees for the 70-year period from 1945 to 2015 was analysed. To reveal the main patterns of change of the explored variables, the dataset values were split to six time intervals (1945–1966–1976–1986–1996–2006–2015). To analyse the results, the bootstrap method was used to estimate the median (nonparametric mean) value of the variable (RI and BAI) and percentiles (2.5, 17, 83, 97.5) in every group. The obtained values were presented graphically in the “box-and-whisker” form. The significance of differences in the variables was evaluated for different groups using the median test (Gibbons and Chakraborti 2011).
3 Results
3.1 The vitality structure of forest stands
In the green moss-lichen and green moss Scots pine forests moderately and strongly weakened individuals predominate by number of stems and volume; the share of strongly weakened trees (38 and 31% by number in green moss-lichen and green moss sites, respectively) is somewhat higher than those of moderately weakened ones (30 and 22%) (Fig. 1). In green moss-lichen forests the proportion of moderately weakened trees in terms of volume (47%) is twice as high as the strongly weakened ones. In the green moss pine forests, most of the stand volume (65%) is equally distributed between moderately and strongly weakened trees. The share of healthy trees in both community types does not exceed 10% by number of stems, but is twice as high in terms of volume. The contribution of dying and dry individuals is 2–2.5 times higher in the green moss Scots pine forests than in the green moss-lichen sites.
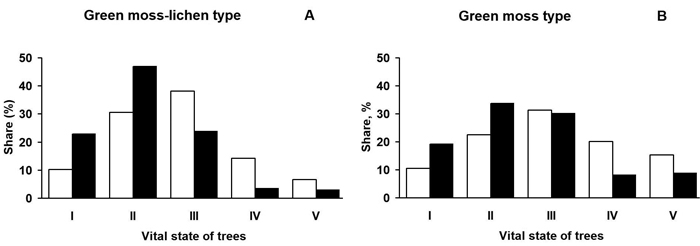
Fig. 1. The vitality distribution of Scots pine trees in the studied communities in the Kola peninsula. White bars – by the number of individuals, black bars – by volume. I – non-oppressed (healthy) trees; II – moderately oppressed
(moderately weakened) trees; III – strongly oppressed (strongly weakened) trees; IV – dying trees; V – dry trees.
3.2 Radial increment
In the green moss-lichen forests, the RI of trees of different vitality did not differ significantly, averaging 1.80 mm year–1 (Fig. 2A) at the beginning of the study period. From 1976 to 1986, two groups were distinctly different: the age group 35–55 years consisted of healthy and weakened trees and the group 20–45 years consisted of strongly weakened and dying trees. Subsequently, the difference increased due to the decrease in the RI of weakened trees compared to healthy ones, and after the 2000s, because of differences in the RI of strongly weakened and dying trees.
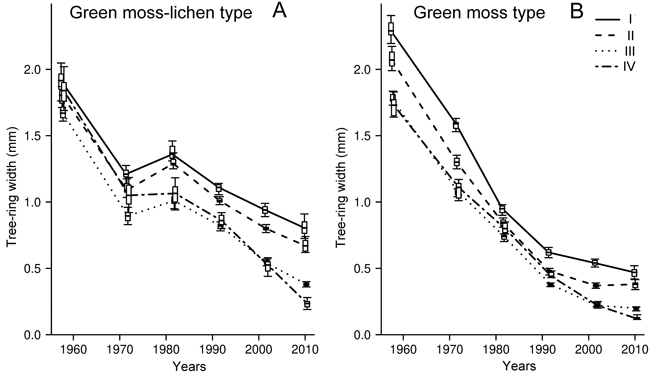
Fig. 2. Dynamics of radial increment (mm year–1) in Scots pine trees of differing-vitality state (I–IV) in green moss-lichen (A) and green moss site type (B) pine forest in the Kola peninsula. I – non-oppressed (healthy) trees; II – moderately oppressed (moderately weakened) trees; III – strongly oppressed (strongly weakened) trees; IV – dying trees. A horizontal line is the median; a box is the interval between 17th and 83th percentiles; whiskers represent the interval from 2.5th to 97.5th percentiles.
During the whole period, RI decreased by 58% (from 1.9 to 0.8 mm year–1) in the trees with no signs of suppression; in the moderately weakened trees, it decreased by 61% (from 1.8 to 0.7 mm year–1) , in the strongly weakened ones by 77% (from 1.7 to 0.4 mm year–1). The greatest reduction in RI (ca. 90%, from 1.8 to 0.2 mm year–1) was observed in the dying trees. In the period 2006–2015, the annual RI of dying Scots pine trees aged 50 to 85 years was estimated to be about 70% lower than in healthy trees.
The difference in RI of Scots pine trees of differing vitality in the green moss Scots pine forest was detected from the age of 15–25 years (1955–1966) onwards. Three groups of trees were singled out (Fig. 2B). Significant differences in RI in strongly weakened and dying individuals began to appear only at the very end of the study period. The RI values in healthy and moderately weakened Scots pine trees within that time period decreased by ca. 80% (from 2.0–2.3 to 0.35–0.4 mm year–1); in strongly weakened and dying trees it decreased by an average of 90% (from 1.65 to 0.12–0.2 mm year–1). At the beginning of the observation period, the difference in the annual RI in healthy and dying pine individuals was about 30% and by the end of the period under review it had increased up to about 70%.
The comparison of RI of healthy and moderately weakened Scots pine trees in different forest types has demonstrated that at the beginning of the study period, the values were slightly higher in the green moss Scots pine forests (2.0–2.3 mm year–1) compared to the green moss-lichen ones (1.8–1.9 mm year–1). Strongly weakened and dying trees showed similar values (1.65–1.85 mm year–1). The RI of Scots pine trees decreased more rapidly in the green moss forests being about 50% lower than in the green moss-lichen communities by the end of the study period (Fig. 2).
3.3 Basal area increment
In green moss-lichen forests, the basal area increment (BAI) in healthy, moderately weakened and dying Scots pine trees did not differ at the beginning of the study period and averaged 3.0 cm2year–1. Within the following decade, its value decreased considerably in strongly weakened and dying trees (by 50–60%) and two groups of individuals were singled out (Fig. 3A). Healthy and moderately weakened trees were characterized by an increase of BAI (ca. 20–25%) in the interval between 1965 and 1985 (from 35–40 to 55–60 years), which was followed by a stabilisation period with an average level of 3.5 ± 0.1 cm2 year–1. The above-mentioned vitality classes of Scots pine trees showed significant differences in BAI only at the age of 75–85 years (Fig. 3A).
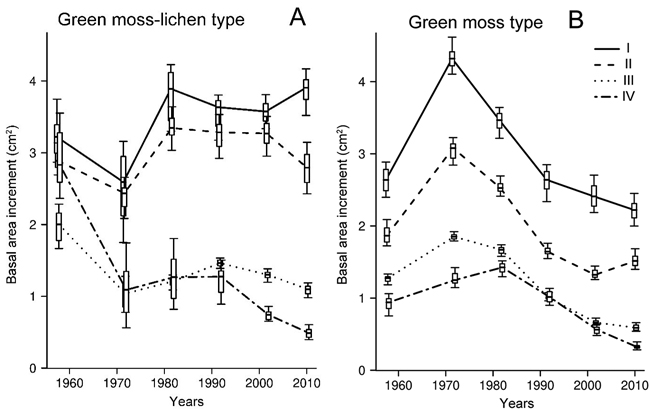
Fig. 3. Dynamics of basal area increment (cm2 year–1) in Scots pine trees of differing-vitality state (I–IV) in green moss-lichen (A) and green moss site type (B) pine forest in the Kola peninsula. I – non-oppressed (healthy) trees; II – moderately oppressed (moderately weakened) trees; III – strongly oppressed (strongly weakened) trees; IV – dying trees. A horizontal line is the median; a box is the interval between 17th and 83th percentiles; whiskers represent the interval from 2.5th to 97.5th percentiles.
The strongly weakened and dying trees had a stable BAI for the period from 1965 to 1995, averaging 1.2 ± 0.1 cm2 year –1. This variable decreased during the subsequent 20 years, more pronounced in the dying individuals compared to the strongly weakened ones (by 60 and 25%, respectively).
By the end of the study period healthy trees demonstrated the maximum BAI (3.9 cm2 year–1), which was 30%, 70% and ca. 90% higher than that of moderately weakened (2.8 cm2 year–1), strongly weakened (1.1 cm2 year–1) and dying individuals (0.5 cm2 year–1), respectively (Fig. 3A). Within the study period, a significant reduction of BAI was registered only in the strongly weakened (by 45%) and dying (ca. 85%) trees.
In the green moss forests, Scots pine trees differing in their vitality demonstrated a uniform trend in BAI. This trend consisted of an increase by 45–65% in the first 30 years of the study period, followed by a significant decrease by ca. 45% in the healthy and the moderately weakened trees and by 65–75% in the strongly weakened and the dying ones (Fig. 3B). For most of the study period, BAI was significantly dependent on the vitality state of Scots pine individuals. The BAI in the healthy trees was 65–85% higher than in the dying trees. By the end of the study period, BAI in the Scots pine trees in the green moss pine forest was 35–45% lower than in the green moss-lichen forests.
4 Discussion
The results of this research will help to fill the information gap on the age dynamics of Scots pine radial growth for this region (Alekseev and Soroka 2002; Yarmishko 2015; Yarmishko et al. 2017).
Scots pine trees of different vitality classes showed significant differences in RI, which increased during the course of the stand development. This fact may be interpreted as an effect of competitive interactions between the individuals. The increased competition results in a prevalence of weakened and strongly weakened individuals in unmanaged Scots pine stands. An analogous phenomenon was observed in other forest-forming species – Larix sukaczewii Dylis and L. sibirica Ledeb. (Fedorkov 2014), Pinus sibirica Du Tour (Demidko 2010), Picea obovata Ledeb. and B. pubescens (Stavrova et al. 2016).
According to our results, the 60% difference in crown density in non-oppressed and strongly oppressed individuals in Scots pine forests aged 75–85 years led to the 50–60% difference in RI. An analogous result (60–70% difference) was obtained for similar-age Scots pine stands in the upland forests of the Alps (Pichler and Oberhuber 2007). The difference in BAI of non-oppressed and strongly oppressed Pseudotsuga menziesii (Mirb.) Franco individuals aged 30–40 years was not so evident (about 30%) (Waring et al. 1980), when compared to Scots pine of the same age in this study (45% on average). The 50% difference in RI for healthy and weakened Quercus robur L. individuals in stands aged 30 years (Tulik and Bijak 2016) appeared to be much higher than that of P. sylvestris trees of the same age (5–15%). These results give evidence to the view that the ratio between the crown density and stem radial growth has regional characteristics and may depend on the species.
The research has shown the importance of comparing BAI with RI, evidenced not only by the contrast of values, but also by the possibility of revealing differences in temporal dynamics.
A quantitative assessment of the influence of stand density on the radial growth of individuals is of great interest. The differentiation in the RI of Scots pine trees of different vitality status in green moss pine forests appeared approximately 20 years earlier than in the green moss-lichen forests where stand density is 60–65% lower on average. The RI of Scots pine was 45–60% lower in the middle-aged green moss pine forests than in the green moss-lichen communities. Experimental data obtained for Scots pine stands in northern Finland (Varmola et al. 2004) have shown that in the poorer and dryer habitat type analogous, approximately 45–65% RI change takes place across a more considerable (70–90%) range in stand density.
5 Conclusions
Middle-aged Scots pine stands in unmanaged boreal forests are characterised by the prevalence of moderately and strongly weakened trees (65–70%). The proportion of dying and dry trees is higher in the denser green moss Scots pine forests compared to the green moss-lichen communities (respectively 36 and 20%).
Differences in RI and BAI for Scots pine trees of different vitality status in green moss pine forest occur 20 years earlier compared to the green moss-lichen forests. The difference in the RI of healthy and dying 75–85-year-old Scots pine trees is less pronounced (70–75%) than in the BAI (85–90%).
In the two studied forest types, the annual RI of Scots pine trees aged from 15–35 to 75–85 years demonstrates gradual decrease, which is more pronounced in green moss forests (80–90%) compared to green moss-lichen forests (60–85%). The RI reduction is more significant in the strongly weakened and dying trees (by 75–95%) than in the healthy and moderately weakened trees (60–80%).
In contrast to RI, BAI trend is differed in the two forest types studied. In green moss-lichen forests BAI of the healthy and moderately weakened trees increases till the age of 45–65 years (by 20–25%) and thereafter stabilizes; in the strongly weakened and dying trees BAI decreases throughout the studied period (by 45 and 85%). In green moss forests BAI of all Scots pine individuals increases until the age of 45–65 years (by 45–65%) and then decreases by 45–75%.
Acknowledgments
The authors are grateful to anonymous reviewers for their valuable comments and suggestions that helped to improve the manuscript. The work was carried out within the framework of the state task of the Komarov Botanical Institute of the Russian Academy of Sciences (the planned theme №AAAA-A19-119030690058-2) with the involvement of resource RC “Observatory of environmental safety” Saint-Petersburg state University.
References
Alekseev A.S., Soroka A.R. (2002). Scots pine growth trends in northwestern Kola peninsula as an indicator of positive changes in the carbon cycle. Climatic Change 55(1–2): 183–196. https://doi.org/10.1023/A:1020271629819.
Alexeyev V.A. (1989). Diagnostics of trees and stand condition. Lesovedenie 4: 51–57. [In Russian with English summary].
Cajander A.K. (1949) Forest types and their significance. Acta Forestalia Fennica 56(5): 1–71. https://doi.org/10.14214/aff.7396.
Cortini F., MacIsaac D.A. , Comeau Ph. G. (2016). White spruce growth and wood properties over multiple time periods in relation to current tree and stand attributes. Forests 7(3): 49–66. https://doi.org/10.3390/f7030049.
Das A. (2012). The effect of size and competition on tree growth rate in old-growth coniferous forests. Canadian Journal of Forest Research 42(11): 1983–1995. https://doi.org/10.1139/x2012-142.
Demidko D.A. (2011). The state of Siberian pine forest in northeastern Altai and methods of its asessment. Lesovedenie 1: 19–27. [In Russian with English summary].
Demidko D.A., Krivets S.А., Bisirova E.M. (2010). Connection between radial increment and tree vitality of Siberian stone pine. Vestnik Tomskogo Gosudarstvennogo Universiteta 4: 68–80. [In Russian with English summary].
Donnelly L., Lundqvist S.-O., O’Reilly C. (2017). Inter- and intra-annual wood property variation in juvenile wood between six Sitka spruce clones. Silva Fennica 51(4) article 7728. 14 p. https://doi.org/10.14214/sf.7728.
Fedorkov A. (2014). Vitality and height growth of two Larix species and provenances in a field trial located in north-west Russia. Silva Fennica 48(1) article 1053. 7 p. https://doi.org/10.14214/sf.1053.
Gibbons J.D., Chakraborti S.(2011). Nonparametric statistical inference. In: Lovric M. (ed.). International encyclopedia of statistical science. Springer, New York, NY, USA. p. 977–979. https://doi.org/10.1007/978-3-642-04898-2.
Helama S., Läänelaid A., Raisio J., Tuomenvirta H. (2012). Mortality of urban pines in Helsinki explored using tree rings and climate records. Trees 26: 353–362. https://doi.org/10.1007/s00468-011-0597-z.
Hereş A.M., Kaye M.W., Granda E., Benavides R., Lázaro-Nogal A., Rubio-Casal A.E., Valladares F., Curiel Yuste J. (2018). Tree vigour influences secondary growth but not responsiveness to climatic variability in Holm oak. Dendrochronologia 49: 68–76. https://doi.org/10.1016/j.dendro.2018.03.004.
Hordo M, Henttonen HM, Mäkinen H, Helama S, Kiviste A (2011). Annual growth variation of Scots pine in Estonia and Finland. Baltic Forestry 17(1): 35–49.
Juknys R., Augustaitis A., Vencloviene J., Kliučius A., Vitas A., Bartkevičius E., Jurkonis N. (2014). Dynamic response of tree growth to changing environmental pollution. European Journal of Forest Research 133: 713–724. https://doi.org/10.1007/s10342-013-0712-3.
Lyanguzov A. Yu., Yarmishko V.T., Lyanguzova I.V. (2017) New method of estimation of the annual increment of woody plant stems. Rastitelnye resursy 53(4): 580–593. [In Russian with English summary].
Neshatayev V.Yu., Neshatayeva V.Yu. (1993). Forest vegetation of Ponoj river valley (the unpolluted area). In: Kozlov M.V., Haukioja E., Yarmishko V.T. (eds.). Aerial pollution in Kola peninsula: proceedings of the international workshop, Apatity, St.-Petersburg. p. 346–360.
Pichler P., Oberhuber W. (2007). Radial growth response of coniferous forest trees in an inner Alpine environment to heat-wave in 2003. Forest Ecology and Management 242(2–3): 688–699. https://doi.org/10.1016/j.foreco.2007.02.007.
R Core Team (2013). R: a language and environment for statistical computing. R Foundation for Statistical Computing, Vienna, Austria. http://www.R-project.org/.
Stavrova N.I., Gorshkov V.V., Katjutin P.N. (2016). Structure formation of forest tree species coenopopulations during post-fire recovery of northern taiga forest. Transactions of the Karelian Research Center of the Russian Academy of Science. Biogeography Series 3: 10–28. [In Russian with English summary]. https://doi.org/10.17076/bg187.
Tulik M., Bijak S. (2016). Are climatic factors responsible for the process of oak decline in Poland? Dendrochronologia 38: 18–25. https://doi.org/10.1016/j.dendro.2016.02.006.
Vacek S., Vacek Z., Remeš J., Bílek L., Hůnová I., Bulušek D., Putalová T., Král J., Simon J. (2017). Sensitivity of unmanaged relict pine forest in the Czech Republic to climate change and air pollution. Trees 31: 1599–1617. https://doi.org/10.1007/s00468-017-1572-0.
Vaganov E.A., Hughes M.K., Shashkin A.V. (2006). Growth dynamics of conifer tree rings. Images of past and future environments. Ecological Studies 183. Springer Verlag, Berlin, Heidelberg, N.Y. 354 p.
Vanninen P. (2004). Allocation of above-ground growth in Pinus sylvestris – impacts of tree size and competition. Silva Fennica 38(2): 155–166. https://doi.org/10.14214/sf.425.
Varmola M., Salminen H., Timonen M. (2004). Thinning response and growth trends of seeded Scots pine stands at the arctic timberline. Silva Fennica 38(1): 71–83. https://doi.org/10.14214/sf.436.
Waring R.H., Thies W.G., Muscato D. (1980). Stem growth per unit of leaf area: a measure of tree vigor. Forest Science 26(1): 112–117.
World reference base for soil resources (2014). International soil classification system for naming soils and creating legends for soil map (update 2015). http://www.fao.org/3/I3794EN/i3794en.pdf.
Yarmishko V.T. (2015). Radial growth of Scots pine (Pinus sylvestis L.) in varied environment influenced be air pollution in the European North of Russia. Forestry Ideas 21(2(50)): 96–105.
Yarmishko V.T., Gorshkov V.V., Stavrova N.I. (2003). Pinus sylvestris L. vital state structure in the tree layer of pine forests with different degree and type of anthropogenic disturbance (Kola peninsula). Rastitelnije resursy 39(4): 1–19. [In Russian with English summary].
Yarmishko V.T., Lyanguzova I.V., Lyanguzov A. Yu. (2017). Changes in the annual increment of Pinus sylvestris (Pinaceae) stems under reduction of air technogenic pollution. Rastitelnije resursy 53(4): 527–542. [In Russian with English summary].
Total of 29 references.
