Jussi Manner  ,
Tomas Nordfjell,
Ola Lindroos
,
Tomas Nordfjell,
Ola Lindroos
Effects of the number of assortments and log concentration on time consumption for forwarding
Manner J., Nordfjell T., Lindroos O. (2013). Effects of the number of assortments and log concentration on time consumption for forwarding. Silva Fennica vol. 47 no. 4 article id 1030. https://doi.org/10.14214/sf.1030
Highlights
- We analysed the effects of total and forwarded log concentrations (m3 (100 m)–1) and the number of loaded assortments on forwarding
- The combination of the number of loaded assortments and their abundance (i.e. forwarded log concentration) affected time consumption most
- This knowledge enables improved efficiency by optimizing number and assortment proportions in the various loads required to forward a stand.
Abstract
Forwarding has been carried out for 50 years, but much is still unknown about this work. Its complexity comes from both stand features and essential decision-making. Forwarding time consumption is influenced by e.g. log concentrations and number of assortments. Traditionally, focus has been on the total log concentration (TLC), referring to all logs at the harvesting site. However, we focused on forwarded log concentration (FLC), the load-specific log concentration which depends on the assortment distribution at harvesting site and the load-specific number of assortments. To evaluate the effects of TLC, number of assortments in a load and FLC on the loading and unloading times, a standardized field experiment was carried out. Pile and load sizes were constant, while TLC and FLC were manipulated by varying the pile distribution on the test path. For all work elements, the time consumption per m3 was significantly affected by the number of assortments that were loaded, but only the “driving while loading” work element was also significantly influenced by TLC. However, when untangling the intercorrelation between tested factors, it was found that the time consumption for driving while loading significantly decreased as a function of FLC and was unaffected by the number of assortments in a load. That FLC influences the forwarding time consumption highlights the need to study the effects of combining various assortment proportions in a load. Such knowledge will enable analysis of the most efficient number and assortment proportions to combine in the various loads required to forward a given stand.
Keywords
productivity;
time study;
forest haulage;
forwarders;
cut-to-length logging;
log extraction;
terrain transport
-
Manner,
Swedish University of Agricultural Sciences, Department of Forest Biomaterial and Technology, SE-901 83 Umeå, Sweden
E-mail
jussi.manner@slu.se
- Nordfjell, Swedish University of Agricultural Sciences, Department of Forest Biomaterial and Technology, SE-901 83 Umeå, Sweden E-mail tomas.nordfjell@slu.se
- Lindroos, Swedish University of Agricultural Sciences, Department of Forest Biomaterial and Technology, SE-901 83 Umeå, Sweden E-mail ola.lindroos@slu.se
Received 29 October 2013 Accepted 29 October 2013 Published 7 November 2013
Views 161491
Available at https://doi.org/10.14214/sf.1030 | Download PDF

1 Introduction
The cut-to-length (CTL) harvesting chain has been studied periodically over the last few decades. Single-grip harvester work has often been studied in depth (e.g. Kuitto et al. 1994; Nurminen et al. 2006) whilst more detailed studies on forwarding are less common.
Most often, forwarding is divided into five different work elements despite different standards being used. On average, the work elements “loading”, “driving while loading”, “unloading” and “driving while unloading” together make up 78–82% of the total forwarding time consumption for forwarding distances of 200–300 m (single way). ”Driving empty” and “driving loaded” together make up only 18–22% of the total time consumption (Fig. 1). Time consumption for driving empty and driving loaded depends on the forwarding distance and driving velocity, which in turn are mainly determined by geophysical factors. Therefore, an operator has only a limited opportunity to reduce time consumption for those work elements. Kuitto et al. (1994) found that loading generally is the most time consuming work element and pointed out that the time consumption distribution for work elements depends on how densely logs are distributed at the harvesting site (i.e. log concentration). These findings partly support those of the studies shown in Fig. 1.
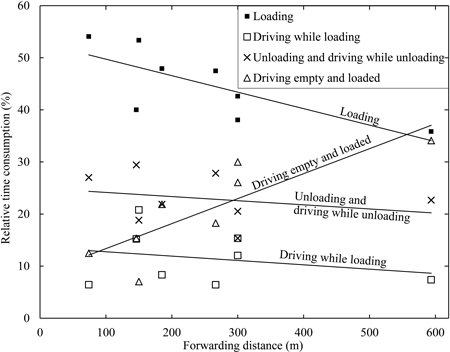
Fig. 1. The relative distribution of the forwarder’s productive machine (PM) time after fully mechanized cut-to-length (CTL) thinning operations versus forwarding distance (single way). Relationship lines are derived by regression analysis of data from Kellogg and Bettinger (1994); McNeel and Rutherford (1994); Hunt (1995); Sambo (1999); Bulley (1999); Gullberg (1995), motor-manual CTL thinning and Bruunett Mini 687F; Meek and Simard (2000), Valmet 646; Poikela and Alanne (2002), both late thinning and final felling. For the first five references, forwarding distances were calculated as the mean of driving empty and driving loaded distances.
Log concentration can be expressed as a volume unit per surface area (e.g. m3 ha–1) but, from a forwarding perspective, it is more common and accurate to express it as a volume per distance on the strip-road (e.g. m3 (100 m)–1) (c.f. Kahala 1979; Kahala and Kuitto 1986; Kuitto 1990, 1992; Kuitto et al. 1994; Väkevä et al. 2003; Nurminen et al. 2006). Bergstrand (1985) initially used a unit of m3 ha–1 but later practically derived the unit as m3 (100 m)–1. Kahala (1979) found that at low log concentration (< approximately 8 m3 (100 m)–1), the forwarder’s time consumption decreases drastically as a function of log concentration whilst at a higher log concentration (> approximately 16 m3 (100 m)–1), the decrease is less. Comparison of Kahala (1979) with later studies by Kahala and Kuitto (1986), Kuitto (1992), Kuitto et al. (1994) and Brunberg (2004) shows that the relative effect of log concentration on the time consumption has not changed over that period.
For this study, we have differentiated between total log concentration and forwarded log concentration. Total log concentration refers to all the logs at the harvesting site, whereas forwarded log concentration refers to the load-specific log concentration which depends on the assortment distribution at a harvesting site and the number of assortments forwarded together in a load.
The number of bucked assortments depends on the stand characteristics and industrial demands, and can therefore vary between harvesting sites. The average number of assortments has been found to be 7–10 (3–5 saw log and 4–5 pulp wood assortments), when studying both final fellings and thinnings in Finland a decade ago (Poikela and Alanne 2002). Nowadays the numbers are likely to be even higher, since more customer-specific log dimensions have resulted in increasing number of assortments at harvesting sites (Malinen et al. 2011).
In some studies, the number of assortments in a load has been recorded (e.g. Kellogg and Bettinger 1994; Kuitto et al. 1994; Nurminen et al. 2006), but most often this is not taken into account (e.g. Kahala and Kuitto 1986; Kuitto 1990, 1992; McNeel and Rutherford 1994; Hunt 1995; Gullberg 1995, 1997a,b; Tufts 1997; Bulley 1999; Sambo 1999; Meek and Simard 2000). Observed total time consumptions by Kellogg and Bettinger (1994) and Nurminen et al. (2006) were lowest when a load contained only one assortment. In a follow-up study by Kuitto et al. (1994), the proportion of 1 assortment loads was only 14% while proportions of 2 and 3 assortment loads were 44 and 26% respectively. One way to interpret this disunity is that most often operators do not forward the most time-efficient number of assortments in a load. However, the low data resolution in respect of log concentration and the assortment proportions in previous studies (Table 1) does not allow for such conclusions to be drawn safely (c.f. Kellogg and Bettinger 1994; Kuitto et al. 1994; Nurminen et al. 2006). Thus, it is unclear if the results depend solely on the number of loaded assortments or if there are influences from other factors such as total log concentration and forwarded load concentration.
| Table 1. Data on log concentration and the number of assortments in studies of mechanized CTL, which have reported total and forwarded log concentration as well as the number assortments at harvesting site and in loads. View in new window/tab. |
The aim of this study was to analyse how the time consumption for forwarding is affected by the number of assortments in a load, total log concentration and forwarded log concentration.
2 Materials and methods
The experiment used the two factors number of assortments in a load and total log concentration, with four and three levels, respectively (Table 2). Each of the eight treatments was replicated three times with a randomised application of treatments on observations. The treatments resulted in 6 different levels of forwarded log concentration (Table 2), which were used as a derived factor (see description of analysis below). Total log concentration was always calculated based on the existence of five assortments of equally large volumes, irrespective of the number of assortments in a load.
| Table 2. Treatments included in the study (i.e. factor combinations) and their resulting levels of forwarded log concentration and distances driven between the first and the last loaded pile in a load. Each treatment was repeated three times, resulting in 24 observed loads in total. | |||
| Factors | Forwarded log concentration (m3ob (100 m)–1) | Distance driven between the first and the last loaded pile in a load (m) | |
| Total log concentration (m3ob (100 m)–1) | Number of assortments in a load | ||
| 6.4 | 1 | 1.3 | 625 |
| 3 | 3.8 | 209 | |
| 5 | 6.4 | 125 | |
| 19.2 | 1 | 3.8 | 209 |
| 2 | 7.7 | 104 | |
| 3 | 11.5 | 70 | |
| 32.0 | 1 | 6.4 | 125 |
| 3 | 19.2 | 42 | |
| m3ob (100 m)–1 = solid m3 over bark per 100 m of the strip-road | |||
To implement the experiment, a field study was carried out using a standardized test path (Fig. 2) which represented a strip-road section at an imaginary harvesting site without residual trees. The test path was placed on a clearcutting site with sandy sedimentary soil and flat, even, dry ground. Its bearing capacity, ground roughness and slope were all designated class 1 using the Swedish terrain classification scheme (Berg 1982). The radius of the test path was about 20 m and the circumference was 125 m.
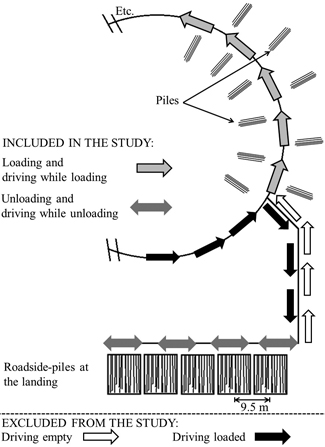
Fig. 2. The standardized circular test path defined by an imaginary log distribution. Each pile and roadside-pile contained only one of the five assortments.
Along the path, there were fixed positions for standard sized piles (see below). Total log concentration was manipulated by varying the predetermined distance between the piles. The shortest distance driven between the first and the last loaded pile was 42 m (about one third of the circuit) with the highest total log concentration; the longest was 625 m (5 circuits) with the lowest total log concentration (Table 2). Distances longer than the path circumference were created by having the operator drive multiple laps and pick piles in a predetermined order.
Before the study, about 600 Scots pine (Pinus sylvestris) pulpwood logs were divided randomly into five groups and colour-marked to represent an assortment. Within assortments, four logs constituted a pile. The same logs were used throughout the study. Based on a sample of 19 piles, the average pile volume was 0.26 solid m3 over bark (m3ob) with a standard deviation (SD) of 0.02 m3ob. The root diameter of the logs was in the range 13.5–19.5 cm, the top diameter was in the range 7–14 cm and the length of logs was in the range 470–520 cm.
The 20 year-old male operator in the experiment had one year working experience with forwarders after graduating from three years of vocational training to become a forest machine operator. To exploit equally the whole length of the test path for all the treatments and to minimize any learning effect, the first repetition (i.e. load) always started from the reference point at 0m, the second repetition started from the reference point at 83.3 m and the third repetition started from the reference point at 41.7 m (Fig. 2). The driving direction was always counter-clockwise.
Forwarding was divided into the work elements loading, driving while loading, unloading and driving while unloading, whereas transportation-only tasks (i.e. driving empty and driving loaded) were not included in the study. One full load consisted of 30 piles, which corresponded roughly to 8 m3ob. After a load was completed, a second operator picked up logs from the roadside-piles at the landing and distributed them back to the test path for the next load.
Work elements were defined so that they could not overlap. A differentiation between the work elements loading or driving while loading and unloading or driving while unloading was based on the tyre rotation. When the tyres were not rotating, the work element was defined as loading or unloading and when the tyres were rotating, the work element was defined as driving while loading or driving while unloading. However, the work element was defined as driving while unloading if and only if the motion led to a change in the unloaded assortment; otherwise the unloading work element was considered incomplete and timing continued. This provided an unambiguous rule to separate the work element driving while unloading from small corrections in the position of the machine during unloading.
In addition to the work elements, loading and unloading components were observed and used as dependent variables (Table 3). The time consumption for loading stop, loading crane cycle, unloading stop, unloading crane cycle and driven distance between the first and the last loaded pile in a load was recorded. Also, the number of loading stops, unloading stops, piles per stop, loading crane cycles per stop, unloading crane cycles per stop and unloading crane cycles per load were used as dependent variables. The number of observations for loading components varied from 1 to 30 and for unloading components from 1 to 21 per load. During the loading stage, a new crane cycle was defined to have started when the crane was finally lifted up from the load-space i.e. sorting work was included into the ongoing crane cycle. A preceding crane cycle ended simultaneously with a new one starting. The last crane cycle within a stop ended simultaneously with the work element driving while unloading starting.
| Table 3. Levels of significance (p-values) and level of explained variance (R2 adjusted values) obtained from the analysis of variance (ANOVA) of the main effects on the work elements’ time consumption and on the loading and unloading components. α is the number of assortments in a load, β is total log concentration on the strip-road and (αβ) is the fixed interaction effect. | |||||
| Dependent variable | p-value | R2 (adj) (%) | Number of observations (n) | ||
| α | β | (αβ) | |||
| Time consumption for work elements (PMmin (m3ob)–1) | |||||
| Work elements pooled | 0.006 | <0.001 | <0.001 | 89.8 | 18 |
| Loading | <0.001 | 0.393 | 0.985 | 63.5 | 18 |
| Driving while loading | <0.001 | <0.001 | <0.001 | 99.8 | 18 |
| Unloading | <0.001 | 0.629 | 0.596 | 81.9 | 18 |
| Driving while unloading | <0.001 | 0.538 | 0.538 | 88.6 | 18 |
| Loading components | |||||
| Time consumption for a loading stop (PMmin) | <0.001 | <0.001 | <0.001 | 67.5 | 378 |
| Time consumption for distance driven between the first and the last loaded pile in a load (PMmin m–1) | 0.182 | 0.132 | 0.074 | 32.9 | 18 |
| Time consumption for a loading crane cycle (PMmin) | <0.001 | 0.076 | 0.721 | 11.5 | 526 |
| Number of loading stops per load | <0.001 | <0.001 | <0.001 | 96.9 | 18 |
| Number of loaded piles per stop | <0.001 | <0.001 | <0.001 | 69.2 | 378 |
| Number of crane cycles per loading stop | <0.001 | <0.001 | <0.001 | 73.0 | 378 |
| Number of loaded piles per crane cycle | 0.054 | <0.001 | 0.028 | 6.9 | 526 |
| Unloading components | |||||
| Time consumption for an unloading stop (PMmin) | 0.016 | 0.917 | 0.878 | 5.0 | 52 |
| Time consumption for an unloading crane cycle (PMmin) | <0.001 | 0.767 | 0.470 | 15.1 | 200 |
| Number of unloading stops per load | <0.001 | 0.344 | 0.344 | 94.8 | 18 |
| Number of unloading crane cycles per load | <0.001 | 0.926 | 0.168 | 85.3 | 18 |
| Number of unloading crane cycles per stop | <0.001 | 0.659 | 0.735 | 71.6 | 52 |
| Significant values (p < 0.05) in bold. | |||||
During the unloading stage, a new crane cycle was defined to be started when the crane was lifted up from the load-space, or from the ground, to be moved to the roadside-pile for unloading. Sorting work required when unloading multi-assortment loads (i.e. a load which contains more than one assortment) was included in the ongoing crane cycle. A previous crane cycle ended simultaneously with a new one starting.
In this study, the operator had to comply with a set of study specific instructions. The work elements were not allowed to be carried out in parallel i.e. crane work during the driving tasks was not allowed. At the landing, logs were unloaded onto one side of the road only. Unloading of several assortments at one time i.e. stop between two roadside-piles to unload two assortments simultaneously, was not allowed. However, the sorting of assortments was allowed to be carried out in whatever way was possible e.g. on the ground beside the forwarder, in the load-space or on the top of the roadside-piles. The operator placed different assortments in vertical sections in the load-space and avoided to place one assortment on top of other assortments throughout the experiment. He was accustomed to work similarly also in the practice.
The roadside-piles were pre-filled up to 1.5 m from the ground level to correspond to average unloading conditions i.e. a half full roadside-pile. The length of each roadside-pile was 9.5 m and they were placed side by side.
An eight-wheeled midsized forwarder (Valmet 860.1, Komatsu Forest AB) with a maximum payload of 14 000 kg was used during the study. The machine was equipped with a Cranab CRF 8 crane (reach 7.2 m) and a G36 grapple (grapple area 0.36 m2). The bunk area was 3.5 m2 and the load-space was standard (e.g. without any extra stakes for separating assortments in the bunk).
The field study took place in mid-Sweden, close to the municipality of Rättvik between 17th and 20th of August 2010. There was no precipitation on the first and last day, but it rained on the second and third day. The whole field study was filmed and the time study was carried out afterwards as snap-back timing, based on the film material. Time consumption is measured in units of productive machine minute (PMmin) with all delays excluded, irrespective of length (cf. IUFRO 1995).
The method used to analyze the effects of factors was analysis of variance (ANOVA) and analysis of covariance (ANCOVA). When 1 and 3 assortment loads were compared over total log concentrations, the design was balanced and allowed for a two-factor factorial analysis (two-way ANOVA) based on the model:
![]()
where yijk is the dependent variable, μ is the grand mean, αi is the fixed effect of the i number of assortments in a load, βj is the fixed effect of total log concentration j and εijk is the random error term assuming normal and independent distribution (0, σ2). The model also contains the fixed interaction effect (αβ). Due to the practical limitations of enabling a fully balanced design for all the levels of factors, a two-way ANOVA was complemented with one-way ANOVAs that included additional number of assortments in a load (i.e. 2 or 5) within given total log concentrations (i.e. respectively, 19.2 or 6.4 m3ob (100 m)–1). When the two-way ANOVA showed significant main effects from both factors, the effect of forwarded log concentration was analyzed by entering it as a covariate into the one-way ANOVA of the number of assortments in a load according to the model:
![]()
where γik is the covariate forwarded log concentration and b is the slope for the covariate. In that way, whether the dependent variable was affected by the number of assortments in a load or if the observed effect in the two-way ANOVA was the outcome of the combinations of total log concentration and the number of assortment in a load, was controlled. The models were simplified and, thus, data were pooled when no significant main and interaction effects could be found.
For components with >1 observation per load, the differences in means between the three loads per treatment were tested by use of one-way ANOVA. If no differences could be found between the first, second and third loads (one-way ANOVA, p > 0.05), all observations were pooled within the treatment and treated as independent observations. A general linear model (GLM) was used for analyzing the ANOVA models (Minitab 16, Minitab Ltd.). During the GLM procedure, pairwise differences were analysed with Tukey’s simultaneous test of means. When significant effects from covariates in ANCOVA analyses were found, the relationships were established by use of linear regression analysis. The analyses’ assumptions of normality and homoscedasticity were satisfied (Anderson-Darling’s test and ocular inspection of residual plots), so data was not transformed. The critical level of significance was set to 5%.
3 Results
3.1 The effect of total log concentration and assortments on work elements
The two main effects of the factors total log concentration and the number of assortments in a load significantly affected the total time consumption i.e. the work element pooled (two-way ANOVA, p < 0.001) (Table 3). The total time consumption decreased as a trend with increasing total log concentrations, while the general effect of the number of assortments in a load was the reverse (Table 4). The significant interaction between the main effects showed that their effects varied between the treatments.
| Table 4. Time consumption (mean and standard deviation (SD), PMmin (m3ob)–1) for work elements by total log concentration and the number of assortments in a load. | |||||||||
| Work element | Total log concentration (m3ob (100 m)–1) | Number of assortments in a load | |||||||
| Balanced two-way ANOVA | Supplements for one-way ANOVA | ||||||||
| 1 | 3 | 2 | 5 | ||||||
| Mean | SD | Mean | SD | Mean | SD | Mean | SD | ||
| Work elements pooled | 6.4 | 3.19A,a | 0.17 | 2.90A,b | 0.02 | 3.60c | 0.09 | ||
| 19.2 | 1.97BC,a | 0.06 | 2.38B,a | 0.33 | 1.95a | 0.13 | |||
| 32.0 | 1.69C | 0.11 | 2.39B | 0.16 | |||||
| Loading | No effect | 0.94a | 0.08 | 1.13b | 0.06 | 1.04ab | 0.01 | 1.40c | 0.10 |
| Driving while loading | 6.4 | 1.86A,a | 0.05 | 0.72B,b | 0.02 | 0.46c | 0.03 | ||
| 19.2 | 0.72B,a | 0.01 | 0.26D,b | 0.02 | 0.36c | 0.01 | |||
| 32.0 | 0.41C | 0.03 | 0.13E | 0.01 | |||||
| Unloading | No effect | 0.34a | 0.03 | 0.89b | 0.17 | 0.47a | 0.07 | 1.43c | 0.20 |
| Driving while unloading | No effect | 0a | 0 | 0.16b | 0.04 | 0.07ab | 0.05 | 0.31c | 0.11 |
| Different superscript uppercase letters within work elements pooled and driving while loading indicate significant differences (p < 0.05) between the six combinations of total log concentration and 1 and 3 assortments (Two-way ANOVA with Tukey test). When there was no effect from total log concentration (see Table 3), data within 1 and 3 assortments were pooled (i.e. means based on 9 loads instead of 3). Different superscript lowercase letters within rows indicate significant differences (p < 0.05) (One-way ANOVA with Tukey test). | |||||||||
The two main effects of the factors total log concentration and the number of assortments in a load significantly affected the time consumption for driving while loading (two-way ANOVA, p < 0.001) (Table 3). The time consumption decreased both with increasing total log concentrations and increasing number of assortments in a load (Table 4). The significant interaction between the main effects showed that their effects varied between treatments.
The time consumptions for loading, unloading and driving while unloading were significantly affected (p < 0.001) by the number of assortments in a load whereas total log concentration had no significant effect (p ≥ 0.39) (Table 3). Thus, data were pooled within the number of assortments in a load for those three work elements (Table 4). The time consumption for loading (tloading, PMmin (m3ob)–1) increased as a function of the number of assortments in a load (α) according to Eq. 3. Similarly, the time consumption for unloading (tunloading, PMmin (m3ob)–1) and for driving while unloading (tdriving while unloading, PMmin (m3ob)–1) increased according to Eq. 4 and Eq. 5, respectively.
![]()
![]()
![]()
3.2 The effect of total log concentration and assortments on loading components
The mean time consumption for driving while loading per driven distance was 0.026 (SD 0.002) PMmin m–1. It was neither affected by total log concentration nor by the number of assortments in a load (two-way ANOVA, p ≥ 0.132) (Table 3). Hence, the mean driving while loading velocity was 38.5 m (PMmin)–1. All other analyzed loading components, except two, were significantly affected by the two main effects of the factors total log concentration and the number of assortments in a load (Table 3). These exceptions, which just fell outside the set level for significance (p ≥ 0.054), were the number of piles per crane cycle and the time consumption for loading crane cycle. The generally observed interaction effect was the result of a lack of differences between the lowest total log concentrations (6.4 and 19.2 m3ob (100 m)–1) when loading one assortment (Table 5). When loading three assortments, there were significant differences between total log concentration levels. Thus, with the aforementioned interaction exception, there was a general trend that the number of stops per load decreased with increasing total log concentration and also with increasing number of assortments in a load (Table 5). Time consumption for loading stop and the number of piles and loading crane cycles increased with increasing total log concentration and the number of assortments in a load, which was also valid for the number of piles gathered per crane cycle (Table 5). Time consumption for a loading crane cycle increased with increasing number of assortments in a load (Table 5).
| Table 5. Observations (mean and SD) for loading components by total log concentration and the number of assortments in a load. View in new window/tab. |
3.3 The effect of assortments at equal forwarded log concentration
Forwarded log concentration varies, depending on the number of assortments in a load (Table 2). Thus, the main effect of the number of assortments in a load might be confounded with this variation in forwarded log concentration. Indeed, when analyzing the time consumption for driving while loading at equal forwarded log concentrations, there was no significant effect of the number of assortments in a load (ANCOVA, p = 0.600). However, the time consumption significantly (p < 0.001) decreased as a function of forwarded log concentration (Table 6).
| Table 6. Comparisons at equal forwarded log concentrations: the main effect of number of assortments in a load α and the covariate forwarded log concentration on the strip-road γ (m3ob (100 m)–1). View in new window/tab. |
At equal forwarded log concentrations, only the number of assortments in a load affected the time consumption per loading stop (ANCOVA, p < 0.001) (Table 6). At a forwarded log concentration of 3.8 m3ob (100 m)–1, the time consumption per loading stop increased by 38% when a load consisted of three assortments instead of one (0.33 vs. 0.24 PMmin, Table 5). At a forwarded log concentration of 6.4 m3ob (100 m)–1, the time consumption per loading stop increased by 40% when a load consisted of five assortments instead of only one (0.40 vs. 0.56 PMmin, Table 5).
The analysis at equal forwarded log concentrations revealed that the number of assortments in a load had no significant effect on the number of loading stops per load, the number of piles loaded per stop or the number of crane cycles per stop (ANCOVA, p ≥ 0.167) (Table 6). However, all three variables were significantly affected by the forwarded log concentration (p < 0.001). The number of loading stops per load decreased as a function of forwarded log concentration (Table 6), whereas the number of piles loaded per stop and the number of crane cycles per loading stop increased as a function of forwarded log concentration (Table 6).
3.4 The effect of assortments on unloading components
As expected, unloading components were only affected by the number of assortments in a load (p ≤ 0.016). The total log concentration had no significant effect (p ≥ 0.344) and there were no interactions between the main effects (p ≥ 0.168) (Table 3). Therefore, unloading data were pooled within the number of assortments in a load. The time consumption for unloading stop was 2.73 PMmin for a 1 assortment load and 1.26–1.47 PMmin for the multi-assortment loads. However, since the number of unloading stops per load increased from one stop for a 1 assortment load up to nine stops for a 5 assortment load (Table 7), the time consumption for the work element unloading increased with increasing number of assortments in a load (cf. Table 4, Eq. 4). The number of crane cycles per unloading stop varied from 2.1 for a 5 assortment load up to 9.1 for a 1 assortment load. However, the number of unloading stops per load increased drastically with increasing number of assortments in a load, so the number of unloading crane cycles per load increased with increasing number of assortments in a load. The time consumption for the unloading crane cycle was significantly lower when a load contained one or two assortments compared to loads which contained three or five assortments (Table 7).
| Table 7. Observations (mean and SD) for unloading components by the number of assortments in a load. View in new window/tab. |
4 Discussion
The time consumption for loading did not depend on log concentration, neither total nor forwarded, in this study. This finding corroborates well with loading models by Bergstrand (1985) and Gullberg (1997a,b) which do not take either type of log concentration into account. However, Kuitto (1990), Kuitto et al. (1994) and Nurminen et al. (2006) found that loading time decreases as a function of loaded volume per loading stop.
In this study, the time consumption for loading increased as a function of the number of assortments in a load. Similarly, Nurminen et al. (2006) found that it takes more time to load two assortments than only one. However, most often, the effect of the number of assortments in a load on loading is not taken into account (e.g. Bergstrand 1985; Kuitto et al. 1994; Gullberg 1997a,b).
In this study, the driving while loading velocity was about 50% higher compared with recent studies (c.f. Väkevä et al. 2001; Nurminen et al. 2006). High velocity may have been the result of good driving conditions and standardized pile-placements. In this study, the number of assortments in a load did not affect the time consumption for driving while loading at equal forwarded log concentration. Instead, the number of assortments in a load partly determined forwarded log concentration, which in turn affected the distance required to drive during loading and, thus, the time consumption for driving while loading. This finding is in line with previous research, in which the time consumption for driving while loading was defined as the loading distance divided by the driving while loading velocity (e.g. Bergstrand 1985; Gullberg 1997a,b; Nurminen et al. 2006)
In this study, the time consumption for the work element unloading and driving while unloading increased as a function of number of assortments in a load, which is in line with the findings of Bergstrand (1985) and Nurminen et al. (2006). However, unloading models by Gullberg (1997a,b) and Kuitto et al. (1994) do not include the effect of the number of assortments in load.
Despite the time consumption differences for the individual work elements, the time consumption for the pooled work elements in this study tallies with the corresponding time consumption reported by Bergstrand (1985) and Nurminen et al. (2006), but is lower compared to the time consumption observed by Kellogg and Bettinger (1994) (Fig. 3). This study, as with that of Bergstrand (1985), indicated that the most time-efficient number of assortments in a load depended on total log concentration, while according to Kellogg and Bettinger (1994) and Nurminen et al. (2006), a 1 assortment load is always more time-efficient (Fig. 3). It is noteworthy that the time consumption levels in Fig. 3 are surprisingly similar, in particular when comparing the 25 year old study by Bergstrand (1985) and the one reported here. This is counterintuitive when considering the substantial technical development over that time, which has resulted in faster and more precise crane operating systems and less down time (Nordfjell et al. 2010). Thus, our study suggests that the technological development has resulted in a more efficient use of the scheduled work time, but that the productivity during the productive work time remains the same.
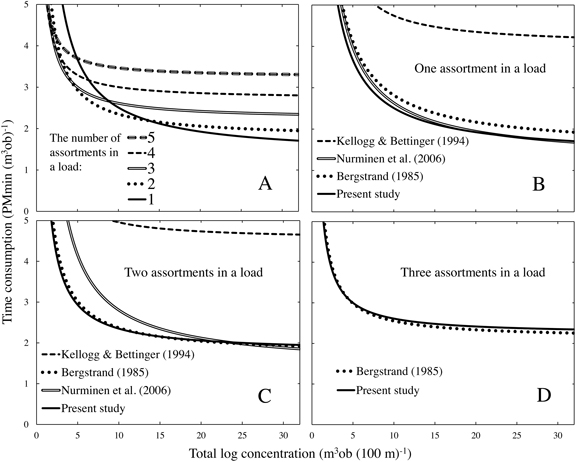
Fig. 3. Panel A: total time consumption in this study for the work elements loading, driving while loading, unloading and driving while unloading. Panels B–D: the total time consumption in this study compared with published studies for 1, 2 and 3 assortment loads. Driving while loading velocity 38.5 m min–1 was used in models by Bergstrand (1985) and Nurminen et al. (2006). The model for 2 saw log assortments was taken from Nurminen et al. (2006). The load-size 8 m3ob was used in the model created by Kellogg and Bettinger (1994). The pile-size 0.26 m3ob and the model for a large-sized forwarder were taken from Bergstrand (1985), with the proportion of difficult piles set as null. In each panel (A–D), the total number of assortments at a harvesting site is five.
The most time-efficient number of assortments in a load depended on assortment-specific log concentrations. This finding is not study or harvesting site specific but generally applicable, provided that assortment distributions at a harvesting site are known. At low log concentrations (both forwarded and total), even small changes strongly influenced the forwarding time consumption whereas the time consumption was almost constant at higher log concentrations (c.f. Figs. 3A and 4). Since forwarded log concentration has been seldom used in previous work, we here provide some “translations” between the time consumption influences of forwarded and total log concentration (Fig. 4). In this study, all assortments had equal concentration so the total log concentration was the product of assortment-specific log concentration and the total number of assortments at a harvesting site.
In Fig. 4A, the total log concentration curves (β) indicate the time consumption required when forwarding from one to five of the five assortments. For the total log concentration of 6.4 m3ob (100 m)–1, the intersection point with the 2 assortment load has the lowest time consumption compared to the other numbers of assortments (Fig. 4A). For the total log concentrations of 19.2 and 32.0 m3ob (100 m)–1, the intersection points with the 1 assortment load have the indicated lowest time consumptions on the respective curves. Under the assumed conditions, it was found that 1 assortment loads were the most time-efficient load type for forwarded log concentrations of more than 2.8 m3ob (100 m)–1 (cf. Fig. 4A). Hence, when a single assortment did not manage to provide a forwarded log concentration of 2.8 m3ob (100 m)–1, it was efficient to increase the forwarded log concentration by adding extra assortments.
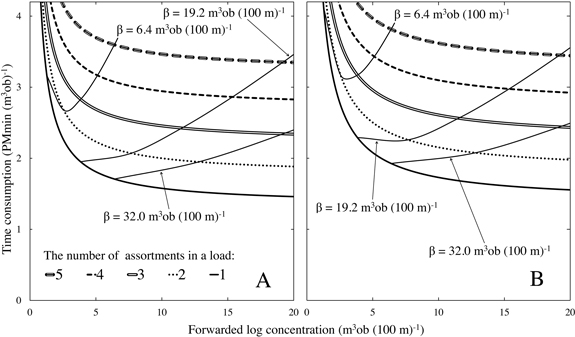
Fig. 4. Total time consumption for loading, driving while loading, unloading and driving while unloading as a function of forwarded log concentration m3ob (100 m)–1 and dependent on the number of assortments in a load (i.e. load type). Additional curves (β) indicate the total time consumption as functions of total log concentrations applied in this study. Data in panel A is based directly on the models presented in the result section. In panel B, the time consumption for driving while loading is increased by 50% to simulate 33.3% slower mean velocity. β curves are based on the assumption that five equally large assortments constitute the total log concentration. Increasing number of equally large assortments at a harvesting site would move β curves to the left, while decreasing their number would have the opposite effect.
This experimental study was designed to isolate the effects of the number of assortments and log concentration. Hence, the way of conducting the forwarding work had to be standardized to a limited set of conditions, to minimise the effect of possible nuisance. Therefore, pile and load sizes as well as the number of assortments and their volume proportions were kept constant. In practice, all those variables vary intrinsically between loads, even within a given stand. This is partly due to the natural variation within the stand and partly due to the way the forwarder operator chooses to carry out the work. Thus, the aim of the study would have been quite difficult to address during observation of normal work.
Work methods were also standardized in terms of not allowing the operator to unload several assortments simultaneously from the same position at landing. In practice, it might happen that several assortments can be unloaded from the same position. Thus, it might be suggested that our study discriminated against unloading of multi-assortment loads. However, the potential for the combined unloading of different assortments requires the roadside-piles to be close to one another. For larger volumes forwarded, the more unlikely such proximity will be, due to the presumably increased lengths of the roadside-piles with different assortments. Since the volumes unloaded and the distances between roadside-piles in this study were considerably smaller than during normal logging operations, it was considered better to prohibit combined unloading of assortments in order to not disproportionally favour unloading of multi-assortment loads.
Yet another part of the standardization was that the study used one machine type and one operator. Thus, the influences on the results from variation due to machine types and operators were minimised, at the expense of uncertainty as to whether or not the results apply to other machine types and operators. Moreover, the random order of treatments and the changing starting point, dependent on the replicate, were designed to minimize the possible effect of learning curves (Vöry 1954; Purfürst 2010) and the Hawthorne effect (Mayo 1933) on the operator performance. This was indeed successful, since no significant differences between the loads (first, second or third) were found, indicating that no treatment had been systematically favoured.
Another type of limitation relates to the previously mentioned unpredicted fast driving while loading. To analyse the effect of that, the velocity was decreased by 50% in a sensitivity analysis to harmonize it with previous studies of the time consumption modelling (Fig. 4B). With the slower velocity, more assortments should be loaded to increase the forwarded log concentration. 1 assortment loads were more efficient first when forwarded log concentration exceeded 4.1 m3ob (100 m)–1 instead of 2.8 m3ob (100 m)–1 (cf. Fig. 4B). 3 assortment loads were more efficient than 2 assortment loads at forwarded log concentrations of less than 2.6 m3ob (100 m)–1. Although the higher-than-usual mean velocity favoured few assortments in a load, the influence on total time consumption was modest (c.f. Figs. 4A and B), which indicated that the results were relatively robust to variation in the driving while loading velocity.
Although the experiment took a place in clearcutting, the results should at least to some extent be applicable also in thinnings since the experiment’s lowest log concentrations actually corresponded better to thinning than clearcutting. However, the residual trees present in thinnings were lacking in the experiment. To our best knowledge, forwarding studies that isolate the effect of residual trees from the forwarded log concentration are scarce. However, we would assume that residual trees will influence the crane and driving speeds during the loading phase, but not in such a way that the forwarded log concentration loses its influence on the time required for loading or driving while loading.
To facilitate the studying of loading, the experimental path was made circular and, thus, the forwarder never had to reverse. For the loading work, however, it does not matter if the forwarder has been reversing or driven forward to get to where the loading starts. Therefore, the results should be generally applicable when the forwarder moves forward during loading (i.e. both when strip-roads are made as loops or as dead-ends) and when assortments are arranged in vertical sections in the bunk.
All in all, the experiment can be considered successful in isolating the effect of the number of assortments and log concentration. However, the intrinsic drawback with an experimental approach is the limited set of conditions tested. Naturally, the generality of the findings from this study need to be further corroborated. However, they are supported by logic reasoning and, at least partly, by previous studies.
In this study, it was found that it is the forwarded log concentration that is influential on the forwarding time consumption. We consider this reasonably intuitive finding as being of more importance than the actual time consumption values observed and presented in the study. The reason is that forwarded log concentration is the product of several hierarchal decisions: what assortments that are bucked when harvesting the trees in a stand and what assortments are loaded in each load. Thus, although forwarding work is seemingly a simple task, it is necessary to acknowledge it as a complex problem which requires a high level of human decision-making to become efficient. Although this is well known in practice, it seems to have been less applied in research and work management. To embrace the fact that it is the forwarded log concentration that matters will open up a new view of forwarding and the analysis of how to conduct the work cost-efficiently. Such a view could use the spatial data on assortment specific log volume and assess the most efficient number and proportions of assortments to combine in the various loads required to forward a given stand. To a certain extent, such an approach has been applied in previous research on forwarding optimization (Carlsson et al. 1998; Westerlund 1998; Carlsson and Rönnqvist 1999; Carlsson et al. 1999; Flisberg et al. 2007; Westlund 2011). And indeed, harvesters already provides spatial data on assortment piles (e.g. Nordström et al. 2009) so the input data for optimizations of forwarding is available. However, to fully enable the suggested analyses, it will require detailed information on the effects on time consumption when combining various assortment proportions in a load. Some previous attempts have been made (e.g. Bjurulf 1992, 1993; Brunberg 1993; Brunberg and Arlinger 2001), but more precise and more detailed information is needed.
Acknowledgements
This study was funded by Stora Enso Skog AB and Forest Industrial Research School on Technology (FIRST). We thank Sören Holm and Fulvio Di Fulvio for statistical advice, Kalvis Kons for assistance with the field work, two anonymous reviewers for valuable comments on the contents, and finally Sees-editing Ltd for revising the English.
References
Berg S. (1982). Terrängtypsshema för skogsarbete. [Terrain classification scheme for forestry work]. Forskningsstiftelsen skogsarbeten. Uppsala. [In Swedish].
Bergstrand K.-J. (1985). Underlag för prestationsmål för skotning. Skogsarbeten redogörelse 7 1985. Forskningsstiftelsen skogsarbeten. Uppsala. 27 p. [In Swedish].
Bjurulf A. (1992). Sorteringsklossen – studier av hur uppläggningen av virke påverkar skotningsprestation. Stencil. Skogforsk, Uppsala. 17 p. [In Swedish].
Bjurulf A. (1993). Små sortiment – en studie av hur små sortiment påverkar den totala skotningsprestationen på en avverkningstrakt. Stencil. Skogforsk, Uppsala. 11 p. [In Swedish].
Brunberg T. (1993). Sortering med skotare. Stencil. Skogforsk, Uppsala. 5 p. [In Swedish].
Brunberg T. (2004). Underlag till produktionsnormer för skotare. [Productivity-norm data for forwarders]. Redogörelse 3. Skogforsk, Uppsala. 12 p. [In Swedish, English summary].
Brunberg T., Arlinger J. (2001). Vad kostar det att sortera virket i skogen? [What does it cost to sort timber at the stump?]. Skogforsk resultat. Skogforsk, Uppsala. 4 p. [In Swedish, English summary].
Bulley B. (1999). Effect of three size and stand density on harvester and forwarder productivity in commercial thinning. Wood harvesting. Technical note TN-292. July 1999. Forest Research Institute of Canada. 6 p.
Carlsson D., Rönnqvist M. (1999). Wood flow problems in Swedish forestry. Report 1, 1999. Skogforsk, Uppsala. 48 p.
Carlsson D., Rönnqvist M.,Westerlund A. (1998). Extraction of logs in forestry using operations research techniques. Linköping University, Department of Mathematics, Division of Optimization. Linköping. LiTH-MAT-R-1998-17. 21 p.
Carlsson D., Rönnqvist M., Westerlund A. (1999). Extraction of logs in forestry using operations research and geographical information systems. Proceedings of the 32nd Hawaii International Conference on System Sciences 1999. 10 p.
Flisberg P., Forsberg M., Rönnqvist M. (2007). Optimization based planning tools for routing of forwarders at harvest areas. Canadian Journal of Forest Research 37(11): 2153–2163. http://dx.doi.org/10.1139/X07-065.
Gullberg T. (1995). Jämförande experimentella studier av lantbrukstraktor med griplastarvagn och liten skotare. [Comparative experimental studies of farm tractors with grapple-loader trailers and a small forwarder]. Dissertation. Sveriges lantbruksuniversitet, Institutionen för skogsteknik. 71 p. [In Swedish, English summary].
Gullberg T. (1997a). Tidsåtgångsmodell för skotning. [Time consumption model for off-road extraction of shortwood]. Sveriges Lantbruksuniversitet, Institutionen för skogsteknik, Uppsatser och Resultat 297. 29 p. [In Swedish, English summary].
Gullberg T. (1997b). A deductive time consumption model for loading shortwood. Journal of Forest Engineering 8(1): 35–44.
Hunt J.A. (1995). Commercial thinning a coastal second-growth forest with a Timberjack cut-to-length system. Wood harvesting. Technical note TN-235. December 1995. Forest Research Institute of Canada. 13 p.
IUFRO WP 3.04.02. (1995). Forest work study nomenclature. Test edition valid 1995–2000. Department of Operational Efficiency, Swedish University of Agricultural Sciences. 16 p.
Kahala M. (1979). Puutavaran kuormatraktorikuljetus ja siihen vaikuttavat tekijät. [Forwarder transport of timber and factors influencing it]. Metsätehon tiedotus. Metsäteho, Helsinki. 21 p. [In Finnish, English summary].
Kahala M., Kuitto P.-J. (1986). Puutavaran metsäkuljetus keskikokoisella kuormatraktorilla. [Forest haulage of timber using medium-sized forwarder]. Metsätehon katsaus. Metsäteho, Helsinki. 4 p. [In Finnish, English summary].
Kellogg L.D., Bettinger P. (1994). Thinning productivity and cost for mechanized cut-to-length system in the Northwest Pacific coast region of the USA. Journal of Forest Engineering 5(2): 43–52.
Kuitto P.-J. (1990). Metsäkuljetus harvesterin jälkeen. [Forest haulage after mechanized cutting]. Metsätehon katsaus. Metsäteho, Helsinki. 6 p. [In Finnish, English summary].
Kuitto P.-J. (1992). Koneellinen hakkuu ja metsäkuljetus – maksuperusteselvitys 1990–1992. [Mechanized cutting and forest haulage]. Metsätehon katsaus. Metsäteho, Helsinki. 8 p. [In Finnish, English summary].
Kuitto P.-J., Keskinen S., Lindroos J., Oijala T., Rajamäki J., Räsänen T., Terävä J. (1994). Puutavaran koneellinen hakkuu ja metsäkuljetus. [Mechanized cutting and forest haulage]. Metsätehon tiedotus 410. Metsäteho, Helsinki. 38 p. [In Finnish, English summary].
Malinen J., Wall T., Kilpeläinen H., Verkasalo E. (2011). Leimikon arvonmuodostus vaihtoehtoisissa loppukäyttökohteissa. Metlan työraportteja 206. 45 p. [In Finnish].
Mayo E. (1933). The human problems of an industrial civilization. Macmillan Company, New York. 194 p.
McNeel J.F., Rutherford D. (1994). Modeling harvester-forwarder system performance in a selection harvest. Journal of Forest Engineering 6(1): 7–14.
Meek P., Simard P. (2000). Optimizing extraction distance in commercial thinning. Advantage 1(12). Forest Research Institute of Canada. 6 p.
Nordfjell T., Björnheden R., Thor M., Wästerlund I. (2010). Changes in technical performance, mechanical availability and prices of machines used in forest operations in Sweden from 1985 to 2010. Scandinavian Journal of Forest Research 25(4): 382–389. http://dx.doi.org/10.1080/02827581.2010.498385.
Nordström M., Möller J., Larsson W., Arlinger J. (2006). Skördardata ger värdefull information om skogen. [Harvester data provides valuable information on the forest]. Resultat 10 2009. Skogforsk, Uppsala. 4 p. [In Swedish, English summary].
Nurminen T., Korpunen H., Uusitalo J. (2006). Time consumption analysis of the mechanized cut-to-length harvesting system. Silva Fennica 40(2): 335–363.
Poikela A., Alanne H. (2002). Puutavaran lajittelu korjuun yhteydessä. Metsätehon raportti 135. Metsäteho Oy, Helsinki. 40 p. [In Finnish].
Purfürst F.T. (2010). Learning curves of harvester operations. Croatian Journal of Forest Engineering. 31(2): 89–97.
Sambo S.M. (1999). Reduction of trail density in a partial cut with a cut-to-length system. Technical note TN-293. August 1999. Forest Research Institute of Canada. 12 p.
Tufts R.A. (1997). Productivity and cost of the Ponsse 15-series, cut-to-length harvesting system in southern pine plantations. Forest Products Journal 47(10): 39–46.
Väkevä J., Kariniemi A., Lindroos J., Poikela A., Rajamäki J., Uusi-Pantti K. (2001). Puutavaran metsäkuljetuksen ajanmenekki. Korjattu versio 7.10.2003. Metsätehon raportti 135. Metsäteho, Helsinki. 41 p. [In Finnish].
Vöry J. (1954). Eräiden metsätöiden aikatutkimusaineistojen analyysiä. [Analysis of time study materials of some forest jobs]. Julkaisu 31. Metsäteho, Helsinki. 117 p. [In Finnish, English summary].
Westerlund A. (1998). Extraction of logs in Swedish forestry. Linköping University, Department of Mathematics, Division of Optimization. Linköping, Sweden. LiTH-MAT-EX-98-19. 71 p.
Westlund K. (2011). Optimerad skotning av rundvirke, GROT och stubbar. [Optimised forwarding of roundwood, logging residues and stumps]. Resultat 18 2011. Skogforsk, Uppsala. 4 p. [In Swedish, English summary].
Total of 38 references
