Nils Fahlvik  ,
Per Magnus Ekö,
Nils Petersson
,
Per Magnus Ekö,
Nils Petersson
Effects of precommercial thinning strategies on stand structure and growth in a mixed even-aged stand of Scots pine, Norway spruce and birch in southern Sweden
Fahlvik N., Ekö P. M., Petersson N. (2015). Effects of precommercial thinning strategies on stand structure and growth in a mixed even-aged stand of Scots pine, Norway spruce and birch in southern Sweden. Silva Fennica vol. 49 no. 3 article id 1302. https://doi.org/10.14214/sf.1302
Highlights
- Precommercial thinning (PCT) was a useful tool to influence the stand structure in accordance to silvicultural goals
- PCT had a great impact on tree species composition
- The seemingly great potential to influence the structure of a heterogeneous, mixed stand was restrained by natural settings and unconditional considerations at PCT (e.g. tree vitality, stem quality, regular spacing).
Abstract
Four different management strategies were applied to a young mixed stand of Scots pine (Pinus sylvestris L.), Norway spruce (Pices abies (L.) Karst.) and birch (Betula pendula Roth and Betula pubescens Ehrh.) in southern Sweden. All strategies included an initial precommercial thinning to ca. 2400 stems ha–1. The different aims were: (i) a conifer-dominated stand with focus on high productivity; (ii) a conifer-dominated stand with high quality timber; (iii) keeping a stem-wise species mixture; (iv) a mosaic-wise species mixture. Stem selection according to the different strategies were simulated with a starting point from plots with a 5 m radius. All strategies were applied to all of the plots. A growth simulator was used to simulate the stand development up to final felling. This study illustrates the possibilities for influencing the structure of a mixed stand through precommercial thinning. The study also illustrates the long-term effects on stand structure and volume yield by consequently applying a management strategy from precommercial thinning until final felling. Precommercial thinning was found to be a useful tool to influence the stand structure in accordance to the aims set. However, the opportunities for influencing the stand by precommercial thinning were restricted by natural settings and unconditional considerations (e.g. tree vitality, stem quality, regular spacing), beyond what could be judged from stand average data. The stem volume production during a rotation was 6% lower for (iii) and (iv) compared to (i) and (ii), mainly due to a greater proportion of birch in the former strategies.
Keywords
yield;
cleaning;
heterogeneous forest;
dimension distribution;
growth simulator
-
Fahlvik,
Southern Swedish Forest Research Centre, Swedish University of Agricultural Sciences, P.O. Box 49, SE-230 53 Alnarp, Sweden
E-mail
nils.fahlvik@slu.se
- Ekö, Southern Swedish Forest Research Centre, Swedish University of Agricultural Sciences, P.O. Box 49, SE-230 53 Alnarp, Sweden E-mail per.magnus.eko@slu.se
- Petersson, StoraEnso Skog AB, Åsgatan 22, SE-791 80 Falun, Sweden E-mail nils.petersson@storaenso.com
Received 19 January 2015 Accepted 13 April 2015 Published 11 May 2015
Views 181645
Available at https://doi.org/10.14214/sf.1302 | Download PDF

1 Introduction
In recent decades, forestry and forest research in Sweden has focused on management of even aged monocultures of Scots pine (Pinus sylvestris L.) and Norway spruce (Picea abies (L.) Karst.). Standardized and robust management programs have been applied, with the goal of achieving a high financial return. The most widely used precommercial thinning (PCT) strategies in forestry today have been developed under this paradigm. Typically, PCT in pine and spruce is made when the stand height is about 2–3 m, with a recommended stand density after PCT of 1500–3500 trees ha–1 (see Bäcke and Liedholm 2000). Conifers are favored and broad-leaved trees are usually only left in gaps or as replacements for severely damaged conifers.
Despite regeneration efforts aiming for conifer monocultures, mixtures with broadleaves are frequent in the young forest. For instance, aiming at soil scarification to promote regeneration can also promote an admixture of spontaneously regenerated broadleaves (Nilsson et al. 2006; Lehtosalo et al. 2010). Mixtures including pine, spruce and naturally regenerated silver birch (Betula pendula Roth) and downy birch (B. pubescens Ehrh.) are common on most types of forest land in southern Sweden (Götmark et al. 2005; Drössler 2010). Birch represents 28% of the total volume of trees with a diameter at breast height (DBH; 1.3 m above ground) <10 cm and 61% of the total stem number in stands younger than 20 years in southern Sweden (Swedish Forest Agency 2013). The corresponding figures for pine and spruce are 12% and 46% of the volume and 7% and 18% of the stem number, respectively. In an assessment of young forests by the Swedish Forest Agency, it was found that in average 260, 1540 and 670 stems ha–1 of pine, spruce and birch were classified as potential members of the future stand in southern Sweden (Swedish Forest Agency 2013). In summary, the structure of the young forest indicates a great potential to form mixtures by an early regulation of the species distribution.
Identifying objectives for the management of young stands is a greater challenge in mixtures compared to monocultures due to differences in growth patterns and preferences for growth conditions between species. PCT can be a highly important measure to adjust tree species composition and the dimension distribution (Agestam 2006). The scope for influencing the stand structure is generally greatest when stands are young (see Pretzsch 1999). Earlier research focused on pure even-aged conifer stands, analyzing the effects of different PCT regimes, differentiated by the intensity and timing. These studies largely focused on volume growth and diameter distribution, but to some extent also considered wood and timber quality (Andersson 1974; Vestjordet 1977; Varmola 1982; Pettersson 1993; Fahlvik et al. 2005). Hence, research into management alternatives with more diverse aims regarding tree species diversity has not been carried out to the same extent. One exception is the management of birch shelters in spruce regeneration (Tham 1994; Valkonen and Valsta 2001). However, this method usually implies a conversion into a monoculture of spruce by removal of the birch shelter at mid age.
Although the silvicultural goals can vary considerably, some obvious strategies can be identified. A traditional strategy would be to homogenize the stand, aiming to produce a conifer dominated monoculture with or without a focus on high timber quality. A non-traditional strategy could be to aim for a mixture of conifers and broadleaves. An admixture of broad-leaves in conifer dominated stands is regarded to enhance nature values and is increasingly encouraged and included in the standards for FSC and PEFC certification. Several beneficial properties have been ascribed to admixtures, for instance greater biodiversity (Felton et al. 2010) and greater ecological stability (Knoke et al. 2008). A tree-wise mixture might result in a more efficient use of the site resource if the tree species differs in characteristics like crown structure, shade tolerance or root depth (Kelty 2006). An admixture of broad-leaves might also improve timber quality related properties in conifer regeneration of low planting densities (Valkonen and Ruuska 2003). However, an intimate mixture may lead to asymmetric competition and the suppression of species if not the appropriate management actions are taken. A more complicated management and the requirement of more skilled labor might increase the thinning cost in mixed stands (Agestam et al. 2006). One alternative to the tree-wise mixture could be mixtures where different species are concentrated to patches and were traditional management for each species can be applied.
The objective of this study was to investigate the possibility to form a stand by applying different PCT strategies in a stand with a heterogeneous mixing pattern of tree species. The study stand should not have reached crown closure. Scots pine, Norway spruce and birch should be distributed over the whole area and the number of trees should be significantly greater than the target density after PCT. The immediate impact of PCT on tree dimension and tree species distribution was analyzed. Long term effects on species distribution and volume growth was predicted using empirical growth models included in the Heureka simulation system.
2 Material and methods
2.1 The study stand
Data were collected in Asa experimental forest (57°08´N, 14°45´E, altitude 190 m a.s.l.). The study stand (12 ha) was established in 1986 by natural regeneration using seed trees of pine. A supplementary planting with spruce was made in 1990. At the time of assessment, the proportion of pine, spruce and birch was 43, 35 and 22% according to stem number and 41, 26 and 33% according to basal area (Table 1).
| Table 1. Mean, minimum and maximum values of initial stand characteristics calculated from the 38 sample plots. | |||
| Number of stems ha–1 | Diametera) (cm) | Heighta) (m) | |
| Pine | 2980 (130–12860) | 4.5 (1.2–8.2) | 3.8 (1.9–5.7) |
| Spruce | 2390 (380–5220) | 4.6 (2.4–7.5) | 4.4 (3–6.5) |
| Birch | 1540 (0–5860) | 5.8 (0.9–11.4) | 5.7 (2.1–7.7) |
| Total | 6910 (2550–14390) | 5.5 (3.5–8.1) | 4.9 (3.1–6.6) |
| a) Basal area weighted mean Σ(x*d2)/Σd2 | |||
2.2 Assessment of PCT strategies and measurements
A total of 38 circular sample plots, with a radius of 5 m, were systematically distributed over the stand and measurement was made in the winter of 2001/2002. All trees on the plots higher than 1.3 m were considered. Species, DBH and tree height was assessed for all trees. Site factors were classified (e.g. vegetation type, soil texture, soil moisture) and the site index was estimated, based on site factors (Hägglund and Lundmark 1981) (Table 2).
| Table 2. Relative distribution of sample plots with different vegetation types, soil moisture classes and site index (H100) for pine and spruce according to site factors (Hägglund and Lundmark 1981). | ||
| Frequency (%) | ||
| Vegetation type class | ||
| Narrow leaved grassesa) | 55 | |
| Vaccinium myrtillus | 5 | |
| Vaccinium vitis-idea | 16 | |
| Calluna vulgaris | 18 | |
| Moist mossesb) | 5 | |
| Soil moisture type | ||
| Dry | 13 | |
| Mesic | 79 | |
| Moist | 8 | |
| Site index | Pine | Spruce |
| –22 (m) | 24 | 0 |
| 22–24 | 18 | 0 |
| 24–26 | 58 | 16 |
| 26–28 | 0 | 26 |
| 28–30 | 0 | 58 |
| a) Mainly Deschampsia flexuosa b) Mosses indicating moist and wet conditions (e.g. Polytrichum spp.) | ||
Four different treatments were simulated on each of the 38 plots. Trees to be left after PCT according to the strategies were marked with ribbons and the choice was registered. Criterions common to all treatments were:
- Removal of “wolf trees”, defined as dominant trees of poor quality that suppresses neighboring trees with potential to develop good timber quality.
- Stems to be left were primarily selected among dominant and co-dominant trees.
- Even spacing with a minimum distance of 1 m between stems after PCT.
- In case of equal opportunities, the best quality trees were favored.
Treatments:
- Traditional (TRAD). Selection was made in accordance with instructions for Swedish PCT practiced in recent decades. The main objective was to favor growth of conifers and to promote the diameter development. PCT was carried out from below with focus on increasing the mean diameter. Spruce was favored in more fertile areas, whereas pine was favored in poorer and drier sites. Birch was only left in gaps or as an alternative to severely damaged or suppressed conifers. The target distance between conifers was 2 m and between birches 2.5 m.
- High quality (HQ). The aim was a stand dominated by conifers of the highest possible potential timber quality. Quality was prioritized more than tree dimension. The timber quality was judged based on damages, stem straightness, branch diameter and branch angle. Pine was favored over spruce. Birch was left in gaps or as substitutes for severely damaged or suppressed conifers. In addition, birches in the dominant canopy layer and of very high quality were regarded as future crop trees if neighboring conifers were of inferior quality. The target distance between conifers was 2 m. However, in clusters of high quality stems, the distance was slightly reduced, to increase the natural pruning rate. In birch-dominated areas the target spacing was 2.5.
- Preserved heterogeneity (HETERO). In this treatment the aim was to maintain the species distribution at each plot. If spruce was sparsely represented in the dominant layers, spruce was also selected in the dominated layers to maintain species distribution. The preferred spacing varied between 1.8 to 2.5 m depending on tree species included in the mixture and the height distribution.
- Mosaic (MOSAIC). This strategy aimed at creating groups of trees dominated by one species. No particular species was prioritized. Within each patch the dominant and most occurring species was favored. In patches of pine and spruce, a spacing of 2 m was applied and in birch-dominated patches 2.5 m. The area of each group was targeted to be at minimum 60 m2, i.e. approx. 15 trees left after PCT.
2.3 Forecasting and evaluating the stand development
2.3.1 Estimation of growth
Stand development was simulated with growth functions implemented in the Heureka system (Elfving 2010; Wikström et al. 2011; Fahlvik et al. 2014). Heureka is the standard tool for forest planning in Sweden and its growth simulator is designed to predicted growth across Sweden for forests containing any of the major tree species. The system requires data on site conditions (latitude, altitude, site index, vegetation type), on stand parameters (stand age, number of stems) and on tree parameters (species, diameter and height). Data from the 38 circular plots with 5 m radius was used as input. There are two different growth stages in Heureka, average height below or above 7 m where different growth models are used. Below 7 m height growth is estimated using functions by Elfving (1982) and height-diameter relationship according to Nyström and Söderberg (1987). Estimates of mortality and growth reduction caused by damage in the young forest are based on functions by Näslund (1986). Above 7 m a different set of growth functions are applied. Basal area growth is calculated both at tree-level, using functions for single trees, and for the whole stand using a stand-level function (Elfving 2010; Fahlvik et al. 2014). The latter function is used to calibrate the growth level while the individual-tree functions are used to model how this overall growth is distributed on tree level. The tree-level growth functions include separate functions for Scots pine, Norway spruce and birch. Distance independent expressions describe the competitive status of individual trees (relative DBH, basal area of larger trees). The overall density is expressed by the total basal area. Elfving (2010) found all tree species to grow faster in mixtures than in pure stands if all other growing conditions were set equal. Since the functions are based on survey material it could not be determined if this reflects a true mixture effect or if it is due to differences in site type and management between mixed and pure forests (Elfving 2010). Stand-level growth is simulated with a single function for all tree species. The overall density is expressed by the total basal area and stem number. The proportion of conifers, Scots pine and birch according to basal area is included as independent variables in the stand-level growth function. All growth models are empirical and stand development is predicted recursively over series of 5-year periods.
The annual mortality in percent of standing volume is predicted with functions by Bengtsson (1978). Functions by Fridman and Ståhl (2001) were used to distribute the mortality among the single trees using e.g. tree DBH and basal area of larger trees as independent variables. Thinnings were defined by the proportion of basal area to be removed and the distribution of the removal on different tree species and diameter classes. The materials from which the growth and mortality models were developed were the HUGIN survey of young forests (Elfving 1982) and the National Forest Inventory (NFI) (Ranneby et al. 1987). The NFI data consists of more than 18 000 permanent sample plots established in 1983–1987 and covers all forest types in Sweden.
The influence of birch species on growth could not be adequately simulated in Heureka. Since birch species were not separated in the NFI data, the growth functions for established forest by Elfving (2010) describe the average growth level of birch. In the height growth functions by Elfving (1982), silver birch resulted in a greater growth compared to downy birch. Based on an investigation of birch species in a neighboring experiment (Fahlvik et al. 2011), 95% of the birches were assumed to be silver birch and 5% downy birch in the simulations. Testing the opposite relation between birch species in the simulations resulted in a reduction of total volume growth during a rotation by less than 1%.
The Heureka growth simulator was judged to be the best available tool to estimate stand development in the present study. Tree-level models accounting for interactions between tree species are considered to be appropriate for forecasting the stand structure of mixed forests (Porté and Bartelink 2002). However, stand-level models are often considered to predict total growth more accurately compared to their tree-level counterparts (Mäkinen et al. 2008). Since both the overall growth level and its distribution on tree species were of interest in the present study, the combined tree-level and stand-level growth models in Heureka seemed appropriate. Growth models accounting for the spatial distribution of trees were not available.
2.3.2 Assessment of thinning grades and intervals
Simulated commercial thinning was designed in accordance with the aims of the PCT strategies (Table 3): (TRAD) all tree species were thinned from below. The same thinning grade was set for both pine and spruce. Birch was heavily thinned during all thinnings; (HQ) the thinning grade for spruce was slightly higher than for pine during the early thinnings. Birch was less heavily thinned than in TRAD, since birches of high quality were to be kept in this strategy; (HETERO) the same thinning grade was used for all species during the first commercial thinning. During later thinnings, a lower thinning grade was applied for birch than for the conifers, since the aim was to maintain the mixture; (MOSAIC) the same thinning grade and thinning quotient were used for all species. Thinning guidelines by the National Board of Forestry (Skogsstyrelsen 1985) were used to assess thinning grades and thinning intervals. The time of thinning and the thinning grade was assessed for the whole stand, consequently the thinning grade varied for individual plots, due to local stand density and species composition. All treatments included three simulated thinnings at a stand age of 35, 50 and 65 years. Clear cutting was simulated when the mean annual volume increment (MAI) culminated, which occurred at an age of 80 years for all treatments.
| Table 3. Average thinning grade and thinning quotient (TQ) for the three simulated thinnings. Thinning grade refers to the proportion of basal area removed at thinning. Thinning quotient refers to the quotient between the mean diameter of removed stems and the mean diameter of the stand before thinning. TRAD = traditional; HQ = high quality; HETERO = stem-wise mixture; MOSAIC = mosaic-wise mixture. | |||||||||
| Treatment | Removal (%) | TQ | |||||||
| Total | Pine | Spruce | Birch | Total | Pine | Spruce | Birch | ||
| TRAD | 27 | 25 | 25 | 60 | 0.95 | 0.94 | 0.93 | 0.94 | |
| KVAL | 27 | 26 | 25 | 54 | 0.95 | 0.94 | 0.93 | 0.95 | |
| HETERO | 27 | 28 | 30 | 21 | 0.94 | 0.95 | 0.93 | 0.95 | |
| MOSAIK | 25 | 25 | 25 | 26 | 0.93 | 0.94 | 0.92 | 0.93 | |
2.4 Statistics
Analysis of stand structure included DBH, tree height, and tree species distribution. Descriptive parameters of the DBH and height distributions were averages, coefficients of variation, skewness and kurtosis. Average DBH was calculated as the basal area weighted diameter; Dbw = ΣDBH3/ ΣDBH2. Average tree height was calculated as the basal area weighted height; Hbw = Σ(H×DBH2)/ΣDBH2, where H is the tree height. Tree species distribution refers to the proportion of the species out of total stem number and basal area, respectively. The Shannon index (Shannon 1948) was used as an expression of species diversity. The index was calculated as:
where pr is the proportion of total stem number for species i and n is the number of species on the plot. In a pure stand S = 0and at equal proportion among three tree species S = ln(3) , approximately 1.1.
All stand structure parameters were calculated separately for each of the 38 plots. Differences in stand parameters before and after PCT were analyzed with Wilcoxon signed rank tests. Paired t-test was used when analyzing differences among PCT treatments. However, differences in tree species proportion among treatments were analyzed with Wilcoxon signed rank tests due to violation of the normal distribution assumption. Holm correction for multiple testing was used when comparing PCT treatments. To compare the species distribution before and after PCT, the distribution was calculated at stand level and differences in tree species distributions were tested with chi-square test. All statistical tests were carried out using a 5% significance level. The statistical software R 3.0.2 was used.
In addition, the results achieved by applying different strategies were also put in relation to theoretical maximum and minimum values of stand parameters. Retaining the identical number of stems as for the simulated PCT strategies, the potential values after PCT for different stand parameter was calculated according to:
- Dimension; selecting the uppermost (Hmax, Dmax) and lowermost (Hmin , Dmin) part of the dimension distribution at each plot. Tree species according to stem number was identical to the simulated strategies.
- Birch proportion; possible minimum (Bmin) and maximum (Bmax) number of birch stems left on each plot. No other tree properties were considered.
- Species diversity; including as many species (Smax) and as few species as possible (Smin), within each plot. No other tree properties were considered.
The spatial distribution of the trees, damage and quality were not considered, when calculating the theoretical values.
A generalized view of the species distribution within the study area before and after PCT was presented in contour maps. Data and coordinates from the 38 circular plots were used as input. A justification of this generalization was the close relationship between topography and species distribution, with gradual transitions from pine dominance on ridges to birch concentrations on lower moist areas.
3 Results
3.1 Stand structure at PCT
There were minor but statistically significant differences in number of stems between the treatments after PCT (Fig. 1). In average 38% of the initial stem number was retained after PCT. Retained tree individuals identical to all treatments were identified and following the different stand density after PCT their proportion out of the total number of stems varied between 61% in HETERO to 70% in MOSAIC (Fig. 2).
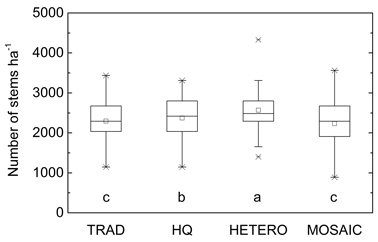
Fig. 1. Average stem number after precommercial thinning according to the different strategies on the 38 plots. Significant differences are marked with letters. TRAD = traditional; HQ = high quality; HETERO = stem-wise mixture; MOSAIC = mosaic-wise mixture.
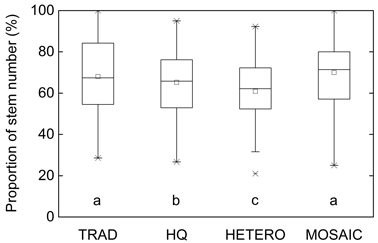
Fig. 2. The share (%) of remaining trees after the different precommercial thinning strategies, which were also selected to be retained according to all the other treatments on the 38 plots. Significant differences are marked with letters. TRAD = traditional; HQ = high quality; HETERO = stem-wise mixture; MOSAIC = mosaic-wise mixture.
The difference in Dbw and Hbw before and after PCT was minor but the average height decreased in HQ and both diameter and height increased in HETERO (Fig. 3). Comparing the different treatments, the lowest Dbw was found in HQ and Hbw was greater in HETERO compared to both HQ and TRAD. Dbw after PCT was on average 0.5 cm lower and Hbw 0.3 m lower compared to the theoretical maximum (Dmax, Hmax) (Fig. 3).
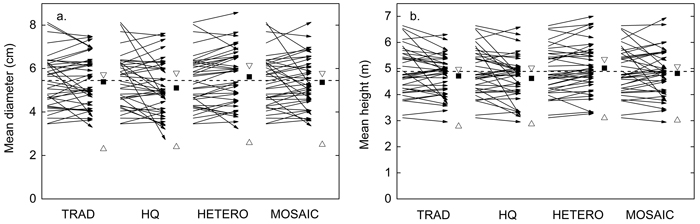
Fig. 3. Influence of precommercial thinning (PCT) on average basal area weighted a) diameter and b) tree height. Arrows; plot wise average before PCT (start) and after each treatment (end). Vertical dashed line; stand-wise average before PCT. Filled squares; stand-wise average after PCT. Unfilled triangles; potential maximum and minimum average after selection solely by dimension, maintaining the same number of retained stems and tree species composition on each plot as in the simulated PCT. TRAD = traditional; HQ = high quality; HETERO = stem-wise mixture; MOSAIC = mosaic-wise mixture.
The tree height and diameter distribution showed a less positive skewness and a lower value of kurtosis and coefficient of variation after PCT compared to the initial state (Fig. 4). Skewness and kurtosis of the diameter and height distribution did not differ significantly between treatments. HETERO had a greater coefficient of variation for both diameter and height compared to than HQ and MOSAIC.
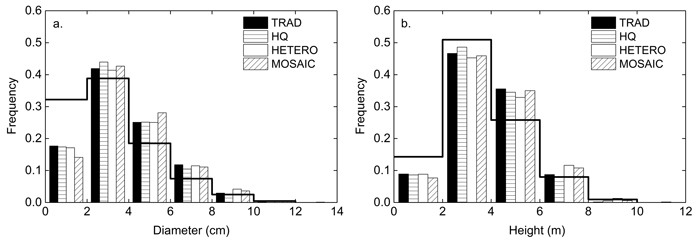
Fig. 4. Relative a) diameter and b) height distribution before (line) and after precommercial thinning according to TRAD = traditional, HQ = high quality, HETERO = stem-wise mixture and MOSAIC = mosaic-wise mixture.
On all 38 plots, no species were dominating prior to the PCT by more than 90%, assessed by the number of stems. Pine, spruce and birch were present on all plots except for one where birch where missing. The spatial pattern of the tree species distribution within the study area before and after PCT is presented in Fig. 5. There were significant differences in the tree species distributions between the initial state and the state after treatment TRAD and HQ according to a chi-square test. The greatest change compared to the initial state was found for spruce and birch, whereas the proportion of pine remained relatively constant for all strategies. HETERO had the greatest similarity with the initial stand when comparing the tree species distribution as an average for the whole stand.
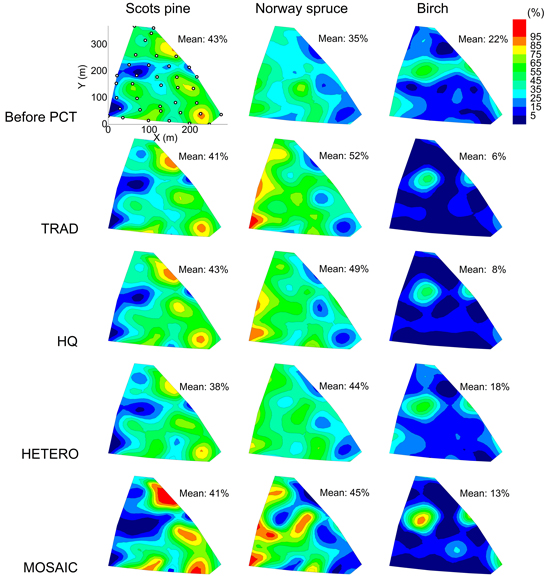
Fig. 5. Tree species distribution within the study area according to the proportion of stem number after precommercial thinning for different treatments. Average proportion at stand level is presented for each tree species and strategy. The positions of the 38 plots are shown in the top left diagram. TRAD = traditional; HQ = high quality; HETERO = stem-wise mixture; MOSAIC = mosaic-wise mixture.
The species distribution was also significantly different among the treatments. TRAD resulted in a greater proportion of spruce than HETERO and a lower proportion of birch compared to HETERO and MOSAIC. The tree species distribution in HQ was similar to TRAD but tended to have a slightly greater proportion of pine and birch. In terms of tree species, the treatments differed primarily in the impact on birch distribution. Birch was completely removed on 23 out of 38 plots in TRAD (Fig. 6a). The theoretical minimum birch proportion (Bmin) was 1.2% compared to 6.4% in TRAD. HETERO produced the greatest proportion of birch remaining after PCT (Fig. 6a).
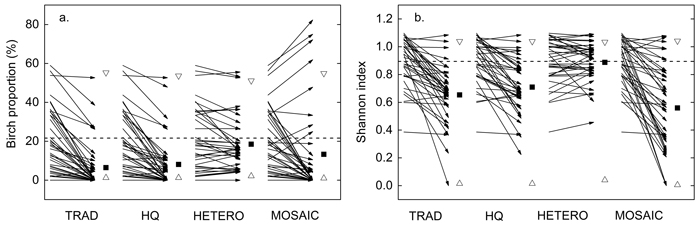
Fig. 6. Influence of precommercial thinning (PCT) on a) birch proportion and b) Shannon diversity index. Arrows; plot wise average before PCT (start) and after each treatment (end). Vertical dashed line; stand-wise average before PCT. Filled squares; stand-wise average after PCT. Unfilled triangles; theoretical maximum and minimum average after a) including and excluding as many birches on each plot as possible, b) distributing the retained stems as evenly among the species or on as few species as possible within each plot. The theoretical maximum and minimum were based on the same number of retained stems on each plot as in the simulated PCT. TRAD = traditional; HQ = high quality; HETERO = stem-wise mixture; MOSAIC = mosaic-wise mixture.
By promoting the most frequent tree species on each plot, a clustered differentiation of tree species appeared within the stand in MOSAIC (Fig. 5). In MOSAIC 63% of the 38 plots were dominated (>70% of the stem number) by one tree species compared to TRAD, HQ and HETERO, where the corresponding figures were 34%, 29% and 13%. The average tree species diversity according to the Shannon index was greatest for HETERO, equaling the index of the initial state (Fig. 6b). The lowest diversity index was found for MOSAIC (0.56) and the index was reduced on 36 plots compared to the state before PCT. The theoretical minimum Shannon index (Smin) were close to zero, indicating that almost all plots could be converted to species pure plots if no considerations were taken to spatial distribution or tree characteristics except tree species. In MOSAIC, however, species pure plots were just achieved on three plots.
3.2 Simulated stand development
The proportion of spruce according to basal area increased during the simulation for all treatments, whereas the proportion of birch decreased (Fig. 7). At an age of 80 years, birch was almost completely removed in TRAD and HQ, whereas a considerable proportion was left in HETERO and MOSAIC. The proportion of pine remained constant over the time for all treatments. The smallest changes in tree species distribution during the time after PCT were found for MOSAIC (Fig. 7).
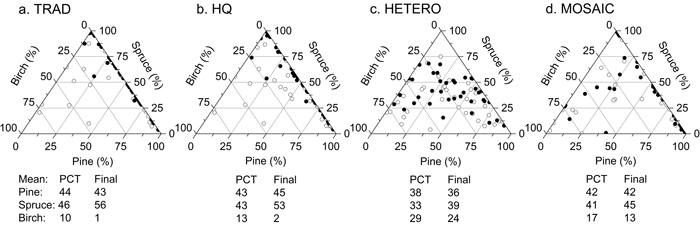
Fig. 7. Tree species distribution (%) according basal area after precommercial thinning (unfilled circles) and after simulating the stand development from the time of precommercial thinning until a stand age of 80 years (filled circles) on the 38 plots. Average proportion at stand level is presented for each tree species and strategy. TRAD = traditional; HQ = high quality; HETERO = stem-wise mixture; MOSAIC = mosaic-wise mixture.
MAI over a rotation of 80 years, was greatest for TRAD and HQ with 7.5 m3 ha–1 yr–1. Compared to TRAD the production was 94% for HETERO and MOSAIC. A lower MAI for HETERO and MOSAIC compared to TRAD was most pronounced on plots where the birch proportion had been increased to >25% at PCT (Fig. 8a and 8b). Plots with an increased spruce dominance after MOSAIC tended to generate a greater MAI compared to a more even tree species distribution in HETERO. Increasing pine dominance in MOSAIC tended to reduce MAI compared to HETERO.
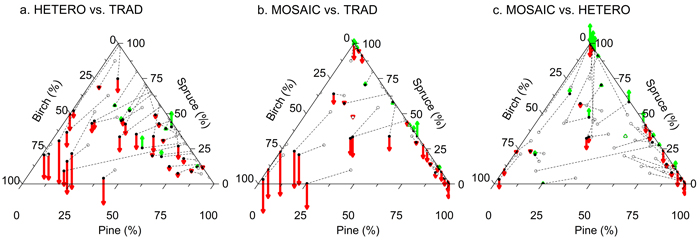
Fig. 8. Volume growth of a subject treatment relative to an alternative treatment during a rotation of 80 years. Tree species distribution according to basal area after PCT of the subject (filled circles) and alternative treatment (TRAD in a and b, HETERO in c) (unfilled circles) is presented for the 38 plots. Pairs belonging to the same plot are linked with dashed lines. The relative difference in MAI compared to the alternative treatment is marked with vectors starting from filled circles (green upwards arrow = gain, red downwards arrow = loss). TRAD = traditional; HETERO = stem-wise mixture; MOSAIC = mosaic-wise mixture. View larger in new window/tab.
4 Discussion
4.1 Influencing stand structure at PCT
A majority of the remaining stems after the simulated PCT were common to all strategies. The focus on tree vitality and an even spatial distribution of retained stems as well as the unconditional removal of “wolf trees” contributed to a unification of the strategies. However, in order to determine the success of influencing the stand structure through PCT, the results must be put in relation to the goals set for the different strategies. The aspects of stand structure available for such an evaluation in this study were tree dimension and tree species distribution.
A criterion common to all strategies was to select stems to be left after PCT among dominant and co-dominat trees. Indeed the diameter distribution showed a less positive skewness for all treatments compared to the state before PCT. Focusing on tree dimension in TRAD increased the average DBH compared to HQ. This is in accordance with Klang et al. (2000) who studied the influence of different selection methods at first commercial thinning in Norway spruce. A selection method where dimension was favored resulted in a 6% greater DBH after thinning compared to a method where stem quality was prioritized (Klang et al. 2000). Branch diameter was used as one of the main criterions for stem selection in HQ, as it is considered to be an important indicator of timber quality (e.g. Persson 1976). Stems with fine branches were prioritized in HQ and a general positive relationship between DBH and branch diameter might explain the reduced DBH in HQ compared to TRAD (see Pfister et al. 2007). The trade off to other tree characteristics than dimension in TRAD and to spatial distribution of stems resulted in a 12% lower Dbw compared to the theoretical maximum. HETERO tended to have a slightly greater average DBH than TRAD although there was no pronounced aim to increase the dimension. This was explained by a greater proportion of birch in the former strategy compared to TRAD. Dominant and co-dominant individuals of birch had a greater dimension than conifers on most plots.
The aim to increase the proportion of conifers in TRAD was achieved. However, birch remained in gaps and especially in the moist areas where birch was dominant prior to the PCT. Due to the consideration to an even spacing, the birch proportion could not be reduced to the theoretical minimum of 1% in TRAD. Contrary to TRAD, the strategies HETERO and MOSAIC did not aim to promote a specific tree species. In HETERO, the aim was to retain the initial tree species distribution within each plot and this was to a large extent achieved. This was shown by an average birch proportion and Shannon diversity index close to that of the initial stand as well as to the lowest deviation for these parameters at plot level. The aim of MOSAIC was to strengthen the naturally set species dominance at each plot by creating as pure plots as possible. Although completely pure plots were rare, a majority of the plots was dominated by one species in MOSAIC. Also the reduction of the Shannon diversity index on all plots except two indicated a change in accordance with the aim.
A shortcoming of this investigation was that no tree properties related to timber quality were assessed and the aim to increase timber quality in HQ could not be evaluated. HQ was a special case of TRAD with focus on stem quality. Comparing individual stems selected in HQ with TRAD shows that 12% of the stems in HQ was unique for this treatment. This gives an indication of the potential to influence quality related properties when the main focus shifts from dimension to quality. A similar comparison was conducted by Klang et al. (2000) when simulating different thinning methods within the same initial stands. A selection method where stem quality was prioritized resulted in 5% reduced branch diameter and the number of crooked stems and stems with defects (e.g. spike knot, stem damage) was reduced by 13 and 22% compared to a method where dimension was prioritized (Klang et al. 2000). The study by Klang et al. (2000) shows the potential to influence stem quality in a homogeneous Norway spruce stand at first commercial thinning.
Aiming for an even spacing at PCT restricted the possibility to select stems to be retained in accordance to treatment specific criteria. Studies comparing square and rectangular spacing at planting (sides 2–6 m) indicate that small scale irregularity do not have any significant effects on tree growth (Gerrand and Neilsen 2000; Sharma et al. 2002). Given the dense initial stand in the present study, the importance of an even spacing to promote dimension can be questioned. However, a pronounced variation in height and occurrence of interspecific competition might be arguments to influence spacing in a heterogeneous in order to reduce asymmetric competition.
In practical forestry average values for different stand parameters are most often used to describe stands and compartments. This study shows that the potential to influence the stand structure at PCT might be overestimated based on this limited information. This was illustrated by the deviation between maximum and minimum values of stand parameters and the outcomes from the different treatments. In TRAD, the removal of “wolf trees” contributed to lower DBH in TRAD compared to the maximum and a significant proportion of birch was left in order to avoid gaps. The minimum value of Shannon index indicated that almost all plots could be converted to pure plots if no consideration was taken to spacing and dimension in MOSAIC. However, all treatments were successful in creating significant changes to the stand structure in line with the specific aims.
4.2 Stand development and volume growth
Results from simulations should always be regarded with caution. Fahlvik et al. (2014) evaluated the growth functions in Heureka and found reliable estimates of growth in traditionally managed stands. The properties of the study stand should be well represented in the HUGIN and NFI data used for model construction, since both data sets contains a great deal of mixed stands. However, a high initial stand density restricted the size of the inventory plots and the small plots might be an issue when used as input in long-term growth simulations. A greater variation in stand structure could be expected on smaller compared to larger plot, especially in older stands where only few trees remains on each plot. This could cause extreme growing conditions and extrapolation of the growth models. Growth also becomes less correlated with competition indices calculated on plots smaller than the influence area of potential competitors and this area increases with increasing tree size (Hynynen and Ojansuu 2003). However, PCT and thinning programmes kept the stand density within limits that also were well covered in the HUGIN and NFI data set. A strength of this study was that there were no differences in the starting point of the simulations apart from the stem selection in the field.
A reduction of pine and birch was met by an increasing proportion of Norway spruce over time in all strategies. Interesting to note was the relative constant tree species distribution in MOSAIC after PCT. By creating as pure plots as possible in MOSAIC, the tree species distribution was to a large degree set already at PCT. In HETERO, favoring birch at thinnings did not counteract the increasing dominance of spruce. It could be argued that spruce should have been heavier thinned in HETERO in order to retain the tree species distribution. However, PCT and the simulated thinnings aimed at an even stand density for all strategies in order to mirror the concerns in practical forestry to maintain a high growth.
The differences in MAI between the treatments were moderate over the rotation. The lower production in HETERO and MOSAIC compared to TRAD and HQ was mainly due to a larger number of birch dominated plots in the former treatments. This is in line with the superior growth potential of Norway spruce and Scots pine compared to naturally regenerated birch on medium fertile sites in southern Sweden (Ekö et al. 2008). However, the promotion of birch in HETERO and MOSIAC did not have any pronounced influence on MAI compared to TRAD if the proportions of birch remained <25%. Accordingly, studies of long-term admixtures of birch in Scots pine and Norway spruce indicate that they might have similar or slightly lower productivity than pure conifer stands (Mielikäinen 1980; Agestam 1985; Ekö 1985; Mielikäinen 1985; Frivold and Frank 2002). A detailed analysis of the influence of species mixture on volume production was not within the scope of this study. However, an interesting observation was the tendency towards a more consistent production level at stem-wise tree species mixture in HETERO compared to patch-wise mixture in MOSAIC. MAI was generally lower on pine dominated and greater on spruce dominated plots in MOSAIC compared to a more moderate production on mixed plots in HETERO. A similar pattern was reported by Drössler et al. (2015), who found an intermediate growth with less variation on mixed plots compared to species pure plots.
In conclusion, the attempt to influence stand structure by PCT in accordance with the defined strategies was successful. PCT had a great impact on tree species composition. The changes of tree species composition by PCT could be achieved with only minor differences among diameter and height distribution of the treatments. However, the seemingly great potential to influence the stand structure in a heterogeneous, mixed stand was restrained by natural settings and unconditional considerations at PCT (removal of “wolf trees”, even spacing, tree vitality). The proportion of spruce increased for all strategies over the rotation but the difference in growth was minor. The growth level tended to decrease with increasing birch proportion.
Acknowledgements
We are grateful to the reviewers for valuable comments on the manuscript. We would also like to thank Jan-Eric Englund for statistical consultation. The study was funded by the Brattås foundation, the Rundvirkes foundation and the research program Future Forests.
References
Agestam E. (1985). A growth simulator for mixed stands of pine, spruce and birch in Sweden. Swedish University of Agricultural Sciences, Department of Forest Yield Research, Report 15. 150 p. ISSN 0348-7636. [In Swedish with English summary].
Agestam E. (2006). Mixed forests as a part of sustainable forestry in southern Sweden. Journal of Sustainable Forestry 21(2–3): 101–117. http://dx.doi.org/10.1300/J091v21n02_07.
Andersson S.-O. (1974). Något om röjningens inverkan på beståndets gagnvirkesproduktion och kvalitet. Skogshögskolan, Institutionen för Skogsproduktion, Rapporter och Uppsatser 33: 84–101. [In Swedish].
Bäcke J.-O., Liedholm H. (2000). Röjning. Skogsstyrelsen, Jönköping, Sweden. 36 p. [In Swedish].
Bengtsson G. (1978). Beräkning av den naturliga avgången i avverkningsberäkningarna för 1973 års skogsutrednings slutbetänkande. Bilaga 6 i SOU 1978:7.
Drössler L. (2010). Tree species mixtures – a common feature of southern Swedish forests. Forestry 83(4): 433–441. http://dx.doi.org/10.1093/forestry/cpq025.
Drössler L., Övergaard R., Ekö P.M., Gemmel P., Böhlenius H. (2015). Early development of pure and mixed tree species plantations in Snogeholm, southern Sweden. Scandinavian Journal of Forest Research 30(4): 304–316. http://dx.doi.org/10.1080/02827581.2015.1005127.
Ekö P.M. (1985). A growth simulator for Swedish forests, based on data from the national forest survey. Swedish University of Agricultural Sciences, Department of Silviculture, Report 16. 224 p. ISSN 0348-8969. [In Swedish with English summary].
Ekö P.M., Johansson U., Petersson N., Bergqvist J., Elfving B., Frisk J. (2008). Current growth differences of Norway spruce (Picea abies), Scots pine (Pinus sylvestris) and birch (Betula pendula and Betula pubescens) in different regions in Sweden. Scandinavian Journal of Forest Research 23: 307–318. http://dx.doi.org/10.1080/02827580802249126.
Elfving B. (1982). HUGIN’s ungskogstaxering 1976–1979. Swedish University of Agricultural Sciences, Faculty of Forestry. Project HUGIN, Report 27. 87 p. ISSN 0348-7024. [In Swedish].
Elfving B. (2010). Growth modelling in the Heureka system. Swedish University of Agricultural Sciences, Faculty of Forestry. http://heurekaslu.org/mw/images/9/93/Heureka_prognossystem_%28Elfving_rapportutkast%29.pdf. [Cited 8 Jan 2015].
Fahlvik N., Ekö P.M., Pettersson N. (2005). Influence of precommercial thinning grade on branch diameter and crown ratio in Pinus sylvestris in southern Sweden. Scandinavian Journal of Forest Research 20: 243–251. http://dx.doi.org/10.1080/02827580510008266.
Fahlvik N., Agestam E., Ekö P.M., Lindén M. (2011). Development of single-storied mixtures of Norway spruce and birch in Southern Sweden. Scandinavian Journal of Forest Research 26: 36–45. http://dx.doi.org/10.1080/02827581.2011.564388.
Fahlvik N., Elfving B., Wikström P. (2014). Evaluation of growth models used in the Swedish Forest Planning System Heureka. Silva Fennica 48(2) article 1013. http://dx.doi.org/10.14214/sf.1013.
Felton A., Lindbladh M., Brunet J., Fritz Ö. (2010). Replacing coniferous monocultures with mixed-species production stands: an assessment of the potential benefits for forest biodiversity in northern Europe. Forest Ecology and Management 260: 939–947. http://dx.doi.org/10.1016/j.foreco.2010.06.011.
Fridman J., Ståhl G. (2001). A three-step approach for modeling tree mortality in Swedish forests. Scandinavian Journal of Forest Research 16: 455–466. http://dx.doi.org/10.1080/02827580152632856.
Frivold L.H., Frank J. (2002). Growth of mixed birch-coniferous stands in relation to pure coniferous stands at similar sites in south-eastern Norway. Scandinavian Journal of Forest Research 17: 139–149. http://dx.doi.org/10.1080/028275802753626782.
Gerrand A.M., Neilsen W.A. (2000). Comparing square and rectangular spacings in Eucalyptus nitens using a Scotch plaid design. Forest Ecology and Management 129: 1–6. http://dx.doi.org/10.1016/S0378-1127(99)00166-8.
Götmark F., Fridman J., Kempe G., Norden B. (2005). Broadleaved tree species in conifer-dominated forestry: regeneration and limitation of saplings in southern Sweden. Forest Ecology and Management 214: 142–157. http://dx.doi.org/10.1016/j.foreco.2005.04.001.
Hynynen J., Ojansuu R. (2003). Impact of plot size on individual-tree competition measures for growth and yield simulators. Canadian Journal of Forest Research 33: 455–465. http://dx.doi.org/10.1139/X02-173.
Hägglund B., Lundmark J.-E. (1981). Handledning i bonitering med Skogshögskolans boniteringssystem. National board of forestry, Jönköping, Sweden. 124 p. ISBN 91-857448-14-5. [In Swedish].
Kelty M.J. (2006). The role of species mixtures in plantation forestry. Forest Ecology and Management 233: 195–204. http://dx.doi.org/10.1016/j.foreco.2006.05.011.
Klang F., Agestam E., Ekö P.M. (2000). Effects of different selection methods in thinning on stem and branch properties in Picea abies. In: Klang F. (ed.). The influence of silvicultural practices on tree properties in Norway spruce. Acta Universitatis Agriculturae Sueciae, Silvestria 128. Doctor’s dissertation.
Knoke T., Ammer C., Stimm B., Mosandl R. (2008). Admixing broadleaved to coniferous tree species: a review on yield, ecological stability and economics. European Journal of Forest Research 127: 89–101. http://dx.doi.org/10.1007/s10342-007-0186-2.
Lehtosalo M., Mäkelä A., Valkonen S. (2010) Regeneration and tree growth dynamics of Picea abies, Betula pendula and Betula pubescens in regeneration areas treated with spot mounding in southern Finland. Scandinavian Journal of Forest Research 25: 213–223. http://dx.doi.org/10.1080/02827581.2010.489514.
Mäkinen A., Kangas A., Kalliovirta J., Rasinmäki J., Välimäki E. (2008). Comparison of treewise and standwise forest simulators by means of quantile regression. Forest Ecology and Management 255: 2709–2717. http://dx.doi.org/10.1016/j.foreco.2008.01.048.
Mielikäinen K. (1980). Structure and development of mixed pine and birch stands. Communicationes Instituti Forestalis Fenniae 99(3). 82 p. ISBN 951-40-0472-8. [In Finnish with English summary].
Mielikäinen K. (1985). Effect of an admixture of birch on the structure and development of Norway spurce stands. Communicationes Instituti Forestalis Fenniae 79 p. ISSN 0358-9609. [In Finnish with English summary].
Näslund B.-Å. (1986). Simulation of damage and mortality in young stands and associated stand development effects. Swedish University of Agricultural Sciences, Department of Silviculture, Report 18. 147 p. ISSN 0348-8969. [In Swedish with English summary].
Nilsson U., Örlander G., Karlsson M. (2006). Establishing mixed forests in Sweden by combining planting and natural regeneration – effects of shelterwoods and scarification. Forest Ecology and Management 237: 301–311. http://dx.doi.org/10.1016/j.foreco.2006.09.053.
Nyström K., Söderberg U. (1987). Tillväxtberäkningen för ungskog i HUGIN-systemet. En kontroll med data från återinventerade ungskogsytor. Sveriges Lantbruksuniversitet, Institutionen för skogsskötsel, Arbetsrapport 18. 81 p. ISSN 0281-7292. [In Swedish].
Persson A. (1976). The influence of spacing on the quality of sawn timber from Scots pine. Royal College of Forestry, Department of Forest Yield Research, Research Notes 42. 122 p. ISSN 0585-3303. [In Swedish with English summary].
Pettersson N. (1993). The effect of density after precommercial thinning on volume and structure in Pinus sylvestris and Picea abies stands. Scandinavian Journal of Forest Research 8: 528–539. http://dx.doi.org/10.1080/02827589309382799.
Pfister O., Wallentin C., Nilsson U., Ekö P.M. (2007). Effects of wide spacing and thinning strategies on wood quality in Norway spruce (Picea abies) stands in southern Sweden. Scandinavian Journal of Forest Research 22: 333–343. http://dx.doi.org/10.1080/02827580701504951.
Porté A., Bartelink H.H. (2002). Modelling mixed forest growth: a review of models for forest management. Ecological Modelling 150: 141–188.
Pretzsch H. (1999). Structural diversity as a result of silvicultural operations. In: Olsthoorn A.F.M., Bratelink H.H., Gradiner J.J., Pretzsch H., Hekhuis H.J., Franc A. (eds.). Management of mixed-species forest: silviculture and economics. IBN Scientific Contributions 15, Wagening, Netherlands. p. 157–174. ISBN 90-76095-08-6.
Ranneby B., Cruse T., Hägglund B., Jonasson H., Swärd J. (1987). Designing a new national forest survey for Sweden. Studia Forestalia Suecica 177. 29 p.
Shannon C.E. (1948). The mathematical theory of communication. In: Shannon C.E., Weaver W. (eds.). The mathematical theory of communication. University of Illinois Press, Urbana. p. 29–125.
Sharma M., Burkhart H.E., Amateis R.L. (2002). Spacing rectangularity effect on the growth of loblolly pine plantations. Canadian Journal of Forest Research 32: 1451–1459. http://dx.doi.org/10.1139/x02-079.
Skogsstyrelsen (1985). Gallringsmallar – södra Sverige. Skogsstyrelsen, Jönköping, Sweden. 35 p. [In Swedish].
Swedish Forest Agency (2013). Swedish statistical yearbook of forestry. 380 p. ISBN 978-91-88462-97-8. [In Swedish with English summary].
Tham Å. (1994). Crop plans and yield predictions for Norway spruce (Picea abies (L.) Karst.) and birch (Betula pendula Roth & Betula pubescens Ehrh.) mixtures. Studia Forestalia Suecica 195: 1–21.
Valkonen S., Ruuska J. (2003). Effect of Betula pendula admixture on tree growth and branch diameter in young Pinus sylvestris stands in southern Finland. Scandinavian Journal of Forest Research 18: 416–426. http://dx.doi.org/10.1080/02827581.2003.9610645.
Valkonen S., Valsta L. (2001). Productivity and economics of mixed two-storied spruce and birch stands in Southern Finland simulated with empirical models. Forest Ecology and Management 140: 133–149. http://dx.doi.org/10.1016/S0378-1127(00)00321-2.
Varmola M. (1982). Development of Scots pine stands at the sapling and pole stages after thinning. Folia Forestalia 524: 1–31. [In Finnish with English summary].
Vestjordet E. (1977). Precommercial thinning of young stands of Scots pine and Norway spruce: data, stability, dimension, distribution, etc. Reports of the Norwegian Forest Research Institute 33: 309–436. ISBN 82-7169-136-8. [In Norwegian with English summary].
Wikström P., Edenius L., Elfving B., Eriksson L.O., Lämås T., Sonesson J., Öhman K., Wallerman J., Waller C., Klintebäck F. (2011). The Heureka forestry decision support system: an overview. Mathematical and Computational Forestry and Natural-Resource Sciences 3(2): 87–94.
Total of 47 references
