Arto Haara  ,
Juho Matala,
Markus Melin,
Janne Miettinen,
Kari T. Korhonen,
Tuula Packalen,
Jari Varjo
,
Juho Matala,
Markus Melin,
Janne Miettinen,
Kari T. Korhonen,
Tuula Packalen,
Jari Varjo
Economic effects of grouse-friendly forest management
Haara A., Matala J., Melin M., Miettinen J., Korhonen K. T., Packalen T., Varjo J. (2021). Economic effects of grouse-friendly forest management. Silva Fennica vol. 55 no. 3 article id 10468. https://doi.org/10.14214/sf.10468
Highlights
- The economic effects of grouse friendly forest management were evaluated by simulating alternative forest management approaches on four large forest holdings in different parts of Finland
- The grouse-friendly management of forest holdings was possible with minor effects on the economics in most cases: only in one case was the reduction of NPV more than 5% during a 30-year simulation period
- The interest rates had an impact on the differences between the economic effects of the forest management approaches.
Abstract
Traditional timber production may have negative effects on other ecosystem services. Therefore, new forest management guidelines have been developed in order to enhance a habitat suitable for wildlife. In Finland, a recent example of this is grouse-friendly forest management (GFFM) which emphasises the preservation of grouse species (Tetronidae) habitats. This study aimed to analyse the economic effects of these guidelines. An analysis was made on how the application of GFFM affected the Net Present Value (NPV) in a 30-year simulation of forest management of four large forest holdings located from south to north in Finland. In the simulations, traditional forest management practices were compared to two levels of GFFM. Five levels of interest rate were used, namely 1, 2, 3, 4, and 5%. In most of the simulations, the NPV was reduced by about 1% or less due to the application of GFFM in comparison to the traditional reference forest management. Only in one case with more intensive GFFM, was the reduction of NPV more than 5%. The interest rates had an impact on the differences between the management approaches. For example, a low interest rate resulted in a higher thinning intensity in GFFM in comparison to traditional forest management, which lead to a higher NPV in GFFM. To sum up, it seems that it would be possible to manage forest holdings in a grouse-friendly manner with minor effects on the economics.
Keywords
grouse;
simulation;
trade-offs;
game keeping;
interest rate
-
Haara,
LUKE
 https://orcid.org/0000-0002-6895-5300
E-mail
arto.haara@luke.fi
https://orcid.org/0000-0002-6895-5300
E-mail
arto.haara@luke.fi
- Matala, Natural Resources Institute Finland, (Luke), Natural resources, Yliopistokatu 6B, FI-80100 Joensuu, Finland E-mail juho.matala@luke.fi
- Melin, Natural Resources Institute Finland, (Luke), Bioeconomy and environment, Yli opistokatu 6B, FI-80100 Joensuu, Finland E-mail markus.melin@luke.fi
- Miettinen, Finnish Wildlife Agency, Ratatie 41, FI-91501 Muhos, Finland E-mail janne.miettinen@riista.fi
- Korhonen, Natural Resources Institute Finland, (Luke), Bioeconomy and environment, Yli opistokatu 6B, FI-80100 Joensuu, Finland E-mail kari.t.korhonen@luke.fi
- Packalen, Ministry of Agriculture and Forestry, P.O. Box 30, FI-00023 GOVERNMENT, Finland E-mail tuula.packalen@mmm.fi
- Varjo, Finnish Wildlife Agency, Sompiontie 1, FI-00730 Helsinki, Finland E-mail jari.varjo@riista.fi
Received 2 November 2020 Accepted 24 June 2021 Published 29 June 2021
Views 80780
Available at https://doi.org/10.14214/sf.10468 | Download PDF

1 Introduction
The debate on how forestry affects wildlife and forest ecology in general has been active for decades. While there are always winners and losers in the event of an environmental change such as a clear cut (beneficial for pioneer species yet harmful for those needing cover), much concern has been raised about whether intensive forestry in the long run decreases forest biodiversity or affects certain species negatively (Sjöberg 1996; Niemi et al. 1998). In Finland, one widely debated issue has been how forestry affects the boreal grouse species (Tetronidae) such as the umbrella capercaillie species (Tetrao urogallus (L.)) (Helle and Helle 1991; Ludwig 2007; Miettinen 2009; Sirkiä et al. 2010). While it is well known that the forest and vegetation structure are crucial components of wildlife habitats and that any changes therein will have a cascading effect on wildlife communities, a less studied topic is how to preserve the desirable features of vegetation for wildlife, whilst maintaining economic viability: which is the dilemma in conservation in commercially managed forests.
Timber has clearly been the most important economic ecosystem service on a large scale in forests. As a very strong transformer of the landscape and forest ecosystems, it continuously conflicts with other ecosystem services. The increased popularity and commercial use of non-timber forest products calls for the development of models for these products to include their predicted yields in forest management planning and to evaluate the potential of multi-functional forest management (Miina et al. 2020). There are diverse studies in which the trade-offs of timber production and other ecosystem services have been examined in all four main classes of the ecosystem services based on The Economics of Ecosystems and Biodiversity (TEEB) classification (2010). In these studies, the ecosystem services considered have included: (i) provisioning services such as berries (Peura et al. 2016; Kilpeläinen et al. 2018), mushrooms (de-Miguel et al. 2014), ceps (Peura et al. 2016) and cones (Pasalodos-Tato et al. 2016); (ii) regulating services such as carbon sequestering (Triviño et al. 2015); (iii) habitat or supporting services such as habitats for species (Barlow et al. 2007, Haakana et al. 2017); and (iv) cultural services such as natural landscapes (Pohjanmies 2018). Furthermore, there have been some efforts to combine forest management and game management (Payne et al. 1988; Williams et al. 2001, Zimmerman et al. 2007). Recently, several studies have focused on the optimal management of multifunctional forests by simulating alternative management scenarios (Kline et al. 2016, Pukkala 2016, Haakana et al. 2017, Heinonen et al. 2017, Triviño et al. 2017, Eyvindson et al. 2018).
However, there are only a few studies in which the economic consequences of game-friendly forest management have been considered (Carley and Grado 2000; Marzluff et al. 2002; Davis et al. 2017). Haakana et al. (2020) calculated trade-off curves represented as production possibility frontiers demonstrating the relationship between the forest grouse habitat area and wood removal using a Finnish forestry dynamics model and the Finnish Multi-Source National Forest Inventory Data at the landscape level. MacMillan and Marshall (2004) predicted the outcomes of alternative harvesting scenarios in terms of habitat quality for capercallie across a wide range of crop types in Scotland.
In Finland, the concept of game-friendly forest management has gained increased attention since the 2010s and has been mostly focused on the grouse species. In this paper we use GFFM referring to grouse-friendly forest management. In 2014, the state-owned Tapio forestry consulting services published guidelines focusing on integrated forest and game management (Lindén et al. 2014). In 2015, the Finnish Wildlife Agency started a project on the promotion of GFFM, which led to the publication of practice-oriented field guidelines (Finnish Wildlife Agency 2015; Miettinen et al. 2015). A common theme in these guidelines is the preservation of features known to be required by the grouse species and their broods (presence of understorey, moderate canopy cover, for instance). The preservation of these features is then emphasised throughout the rotational cycle of the forests: from the tending of seedling stands and young forests to thinnings and possible pre-commercial clearances prior to harvesting. In addition, the emphasis is also given to the preservation of so-called game-thickets: small areas (e.g., 0.005–0.02 hectares) with denser vegetation that are left outside of some of the forestry operations or even preserved altogether.
In multi-objective forest management, the production of timber and other ecosystem services coexists. In order to utilize GFFM widely in practical forestry, the crucial question is whether forest owners will lose or gain economically if they apply GFFM guidelines. This study examines the economical productivity of forests over a 30-year cycle via the Net Present Value, NPV, which provides a standardized value of future incomes and outcomes to the present time according to the selected interest rate over a period of time (see, for example, Navarro 2007, for the specified definition of NPV). Our main question is: what the potential economic effects would be for a forest owner when following different approaches according to the current GFFM recommendations? Furthermore, we aim to examine what would be the impacts of the chosen interest rate of the NPV.
2 Study data and methods
2.1 Study area and data on forest structure
The study data consisted of four randomly lineated large forest holdings (900–2000 hectares located in different parts of Finland, namely in the Pori, Kuopio, Pudasjärvi, and Sodankylä communities (Table 1, Fig. 1). These forest holdings were named based on which community they were located in, respectively. The holdings were comprised of neighbouring forest stand compartments from private forest owners from the open Metsään.fi-data collected by the Finnish Forest Centre (Finnish Forest Centre 2020). A forest stand is a uniform area that contains a set of trees that are relatively homogeneous or have a common set of characteristics located normally in the same natural conditions. In addition, in forest management a stand is considered a basic management unit. The up-to-date Metsään.fi data contains information about stand-wise attributes such as the site and soil type, value of commercial trees, management operations done, etc. Besides this, it contains information about the species-wise stratums of each stand containing, for example, the basal area or stem number depending on the size of the trees included in these stratums, as well as the volume, mean diameter, height, and age of these stratums.
| Table 1. The characteristics of the four forest holdings data for an analysis of economic effects on the application of grouse-friendly forest management (GFFM), namely Pori (area, 2067 ha), Kuopio (1061 ha), Pudasjärvi (1278 ha) and Sodankylä (1294 ha). | |||||
| Forest holding (n stands) | Average | St. Dev. | Min. | Max. | |
| Pori (1667) | Scots pine volume (m3 ha-1) | 44.8 | 44.3 | 0.0 | 223.0 |
| Norway spruce volume (m3 ha-1) | 99.4 | 95.9 | 0.0 | 452.0 | |
| Deciduous trees volume (m3 ha-1) | 1.8 | 10.2 | 0.0 | 135.9 | |
| Total volume (m3 ha-1) | 146.1 | 106.0 | 0.0 | 479.5 | |
| Stand age (a) | 47.6 | 24.9 | 0.0 | 130.0 | |
| Kuopio (711) | Scots pine volume (m3 ha-1) | 34.4 | 49.5 | 0.0 | 217.7 |
| Norway spruce volume (m3 ha-1) | 104.2 | 96.6 | 0.0 | 423.7 | |
| Deciduous trees volume (m3 ha-1) | 0.7 | 7.6 | 0.0 | 124.9 | |
| Total volume (m3 ha-1) | 139.3 | 108.9 | 0.0 | 506.9 | |
| Stand age (a) | 38.1 | 20.8 | 0.0 | 101.0 | |
| Pudasjärvi (840) | Scots pine volume (m3 ha-1) | 51.5 | 41.5 | 0.0 | 194.9 |
| Norway spruce volume (m3 ha-1) | 32.2 | 37.8 | 0.0 | 219.2 | |
| Deciduous trees volume (m3 ha-1) | 0.8 | 5.4 | 0.0 | 66.6 | |
| Total volume (m3 ha-1) | 84.5 | 62.4 | 0.0 | 263.8 | |
| Stand age (a) | 66.8 | 37.6 | 0.0 | 172.0 | |
| Sodankylä (568) | Scots pine volume (m3 ha-1) | 33.2 | 34.0 | 0.0 | 164.4 |
| Norway spruce volume (m3 ha-1) | 26.3 | 30.1 | 0.0 | 147.4 | |
| Deciduous trees volume (m3 ha-1) | 1.2 | 3.9 | 0.0 | 33.1 | |
| Total volume (m3 ha-1) | 60.7 | 51.6 | 0.0 | 196.2 | |
| Stand age (a) | 79.5 | 31.9 | 0.0 | 164.0 | |
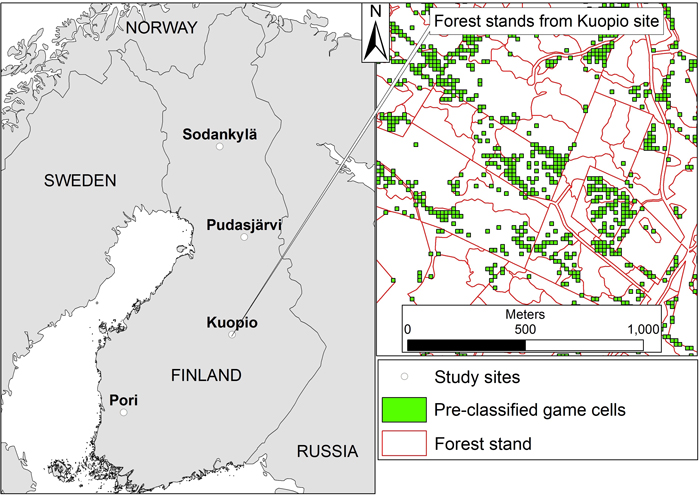
Fig. 1. The location of the four forest holdings in Finland and an example from the Kuopio study area showing the forest stand data from Finnish Forestry Centre overlaid with the pre-classified game cells that according to the definition would be suitable for GFFM. (Sodankylä: 67°10’02.2”N, 26°39’09.1”E, Pudasjärvi: 65°16’27.4”N, 27°52’45.7”E, Kuopio: 63°14’26.2”N, 27°16’11.3”E, Pori: 61°32’02.3”N, 22°29’56.7”E).
In all forest holdings stands were generally dominated by Norway spruce (Picea abies (L.) Karst.) or Scots pine (Pinus sylvestris L.) with a small mixture of deciduous trees (mainly silver birch (Betula pendula Roth) or downy birch (Betula pubescens Ehrh.). There was a remarkable variation between the southern and northern forest holdings as in Pori and Kuopio (both relatively southern) where the mean volumes of the stands were approximately 60% higher than in Pudasjärvi (northern) and more than double the mean volume of Sodankylä (far north) (Table 1). In addition, the stands located in Pori, and especially in Kuopio, were clearly younger on average than in Pudasjärvi and Sodankylä.
2.2 Classification of stands based on their suitability for GFFM
In order to classify the forest stands based on their suitability for GFFM, data on the location of pre-defined game management targets was associated with the forest stands. The game management targets were 16 × 16 m grid cells that were deemed natural targets for GFFM based on their vegetation structure: the cells pre-possessed a structure favourable for grouse broods. These cells were classified and located by the Finnish Forest Centre together with the Finnish Wildlife Agency, and the classification of the game cells was based on airborne lidar data such that the cells were given “game index” values based on their characteristics: i.e., how much understorey vegetation they had, how closed the overstorey layer was, and how diverse the tree-species composition was in terms of canopy cover (Finnish Wildlife Agency 2015). The cells with the highest game index values were labelled “game cells”. These are patches that already contain trees in various sizes and other structural diversity, and therefore have the highest probability of being the most suitable locations for game habitat management. The justification for these features as the basis for selecting the cells was provided by Melin et al. (2016) where these types of lidar metrics were proven to increase grouse brood presence. The study area and a representation of the forest stands overlaid with detected game cells are illustrated in Fig. 1. The game cells covered about 15.8% of the whole study area (Kuopio 18.9%, Pori 16.5%, Pudasjärvi 20.2% and Sodankylä 7.9%, respectively).
2.3 Simulating the effect of GFFM
For each stand, all the projections of forest growth and operations, as well as the economic impacts of different forest management approaches, were calculated using the operational large-scale forest planning system MELA (Hirvelä et al. 2017). MELA consists of two parts: (1) an automated stand projection tool based on tree-level natural processes (Hynynen et al. 2002) and production models (Kuitto et al. 1994); and 2) an optimisation package based on the JLP linear programming software package (Lappi 1992). MELA simulates a finite number of feasible management schedule alternatives for stands over the chosen calculation period automatically according to given simulation instructions, which differ from each other, for example in the timing of activities and selection of cutting methods. A set of detailed models based on individual models including individual trees, natural processes, treatments, timber prices, costs, management instructions etc. were utilised. The automated branching of the simulation is controlled by a set of general decision rules and dedicated simulation instructions for each stand. However, the simulation instructions (e.g., timing of events, regeneration limits) and outcomes (e.g., growth of trees) can be adjusted by the user.
In order to carry out planning calculations, stand-wise record data for MELA containing species-wise stratum data were first generated from the Metsään.fi-data for each of the four forest holdings. Next, three different forest management approaches were applied for each forest holding, and in two of these, game management objectives were taken into account. The different approaches were:
REFERENCE: Each stand is managed following the current forest management recommendations (Äijälä et al. 2014; Vanhatalo et al. 2014).
GAME: In each stand, 5% from the total area of the stand was left untouched during the cleaning of seedling stands and pre-commercial thinning of young stands (for offering shelter and food to the game). These game spots or thickets had the same initial characteristics as the other 95% of the stand, but the understorey vegetation in the game spots was left untouched. However, all the cuttings such as thinnings and final fellings (natural regeneration, clear cutting, and shelter wood cutting) were done at the same time when the main part of the stand was harvested.
INTENSIFIED: 10% from the total area of each stand were operated as game spots or thickets in the GAME approach. In addition, another 10% of the total of each forest holding area was designated as an intensified game-stand. The selection of complete game-stands was based on the highest game cell proportions. For this, the labelled game cells (see chapter 2.2) were joined to the forest stands so that each forest stand had information attached to it on how many game cells fell within its borders (or intersected them). This information was used to calculate the proportion of game cells for each forest stand to the present stands’ suitability from the point of view of game management. Within these intensified game stands, rotations were prolongated by 20% compared to the current forest management recommendations of Finland (Äijälä et al. 2014). The mean stand characteristics and the areas of the normal and intensified stands of the forest holdings are presented in Table 2.
| Table 2. The mean stand characteristics and the areas of the normal and intensified stands of the four forest holdings for an analysis of economic effects on the application of GFFM in forest management. | ||||||||
| Pori | Kuopio | Pudasjärvi | Sodankylä | |||||
| Normal | Intensified | Normal | Intensified | Normal | Intensified | Normal | Intensified | |
| Mean stand area (ha) | 1.3 | 0.8 | 1.6 | 0.9 | 1.6 | 0.8 | 2.4 | 1.6 |
| Total volume (m3 ha-1) | 128.8 | 191.1 | 137.4 | 179.4 | 68.2 | 148.5 | 50.5 | 102.3 |
| Scots pine volume (m3 ha-1) | 49.6 | 56.1 | 44.4 | 26.1 | 44.9 | 79.2 | 30.4 | 43.1 |
| Norway spruce volume (m3 ha-1) | 77.2 | 133.3 | 92.8 | 151.6 | 23.2 | 68.1 | 19.3 | 58.0 |
| Deciduous trees volume (m3 ha-1) | 2.0 | 1.7 | 0.1 | 1.8 | 0.1 | 1.2 | 0.8 | 1.1 |
The simulation time was 30 years with three periods of 10 years. The stand-wise treatment schedules for the three forest management approaches were projected with MELA using growing stock and site data as well as natural process and treatment models. MELA simulates a finite number of feasible management schedule alternatives for stands over the chosen calculation period according to given simulation instructions, which differ from each other, for example in timing and cutting methods of activities.
As the cleaning of seedling stands and pre-commercial thinning of understorey and midstorey have been seen as a prerequisite for commercial wood growth (Äijälä et al. 2014), the predicted growth of commercial wood on each game spot was reduced by 5%. We also assumed that the establishment of game spots would increase the forest management operation costs, such as cutting costs, by 10% generally. In the end, the MELA stand simulator produced several feasible management alternatives for each stand in each forest holding and for each of the three management approaches. The selection of the optimal combination of stand-wise management schedules for each forest holding was done by linear optimisation of the NPV using the JLP software (Lappi 1992). A flowchart of the simulation process of the three forest management approaches is presented in Fig. 2.
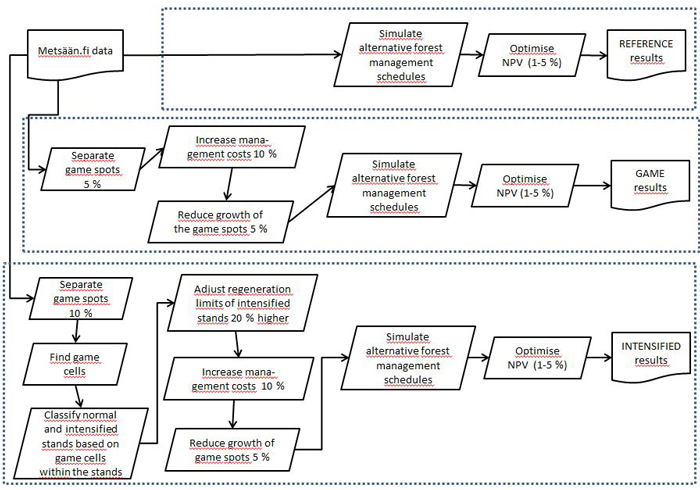
Fig. 2. Flowchart of the simulation process of the three forest management approaches. View larger in new window/tab.
To compare the economic impacts of the three management approaches, the Net Present Value (NPV) was maximised at different interest rates from 1 to 5% for all four forest holdings. The three approaches, namely REFERENCE, GAME and INTENSIFIED, were modelled separately for each of the four study areas, and in each case, interest rates from 1 to 5% were applied.
3 Results
There were clear differences between the economic impacts of the two GFFM approaches with respect to the interest rate in all the forest holdings (Table 3, Fig. 3). As the interest rate increased, the real losses of the NPV decreased while relative losses increased with the GAME approach. This was as expected, as the NPV of the reference decreases as the interest rate increases. Whereas with the INTENSIFIED approach, the NPV losses increased with interest rates of 1–5% for all the forest holdings. With the GAME approach, the costs of the reduced growth because of game spots are realized in the future, and therefore their influence decreases with the increasing rate. When the INTENSIFIED approach is applied, the delay of regeneration cuttings generally causes NPV losses to increase with respect to the interest rate. In the forest holdings in Kuopio, Pudasjärvi and Sodankylä, the INTENSIFIED approach was more profitable than the REFERENCE approach with a 1% interest rate. Thus, in these forest holdings, there were game-stands where the delay of the regeneration cuttings enabled profitable thinnings before the regeneration age was achieved within the simulation time.
| Table 3. Mean NPV losses (€ ha-1) of the four forest holdings of the alternative GFFM forest management approaches (GAME and INTENSIFIED) with 1, 2, 3, 4 and 5% interest rates in comparison to the REFERENCE forest management approach. Relative NPV losses (%) are in parentheses. | |||||
| 1% | 2% | 3% | 4% | 5% | |
| Pori_GAME | 52.7 (0.15) | 37.4 (0.24) | 28.8 (0.30) | 26.2 (0.36) | 23.3 (0.39) |
| Kuopio_GAME | 54.4 (0.18) | 39.5 (0.27) | 33.6 (0.36) | 29.6 (0.42) | 25.1 (0.42) |
| Pudasjärvi_GAME | 26.3 (0.27) | 20.4 (0.49) | 17.0 (0.63) | 14.9 (0.71) | 13.5 (0.77) |
| Sodankylä_GAME | 21.1 (0.50) | 16.6 (0.87) | 14.0 (1.02) | 12.8 (1.13) | 12.5 (1.26) |
| Pori_INT | 42.0 (0.12) | 52.7 (0.34) | 59.6 (0.61) | 73.1 (1.01) | 93.5 (1.56) |
| Kuopio_INT | -111.7 (-0.37) | 20.1 (0.14) | 87.9 (0.95) | 158.0 (2.23) | 205.9 (3.47) |
| Pudasjärvi_INT | -83.7 (-0.85) | -21.6 (-0.51) | 16.4 (0.61) | 28.3 (1.36) | 32.9 (1.87) |
| Sodankylä_INT | -45.6 (-1.07) | 9.2 (0.48) | 39.3 (2.88) | 54.7 (4.82) | 69.9 (7.02) |
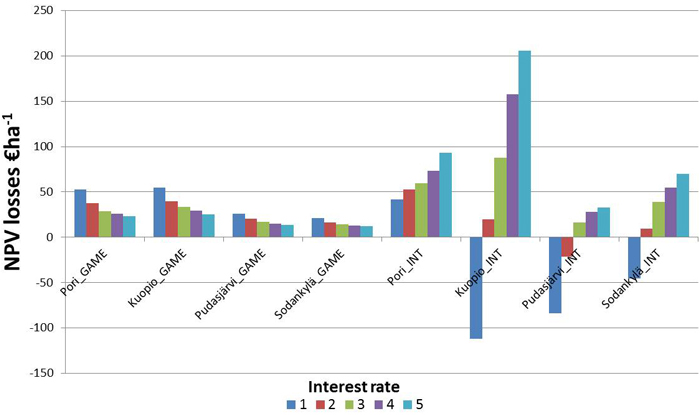
Fig. 3. Mean NPV losses (€ ha-1) of the four forest holdings of the alternative GFFM approaches (GAME and INTENSIFIED) with 1, 2, 3, 4 and 5% interest rates in comparison to the REFERENCE forest management approach.
Depending on the interest rate and on the location and the characteristics of the forest holdings, the change of the mean NPV due to the application of GFFM varied from 112 € in income to 206 € as a loss per hectare when compared to the REFERENCE scenario (Table 3). The differences in optimums between REFERENCE and INTENSIFIED approaches were largest in the Kuopio forest holding where the stand age and site structures (that were linked to high productivity) caused that. The relative NPV losses were very small with the GAME approach, and with the INTENSIFIED approach they were over 5% only in Pudasjärvi (7.0%) at a 5% interest rate.
As there were younger stands on the Pori and Kuopio forest holdings than in the northern forest holdings, the proportion of mature stands clearly grew to a great extent during the simulation time with all the interest rates (For example, with the 3% interest rate in Table 4). The delay in the regeneration cuttings caused the mean age of the stands using the INTENSIFIED approach to be about 2 years greater than those stands using the REFERENCE approach.
| Table 4. Proportions of the development classes (%) of the four forest holdings at the beginning of the simulation time (0) and after 30 years simulation at an interest rate of 3% with the REFERENCE approach. In Finland, the forest stands have been categorised by the stage of development into eight classes and the stand-wise guidelines have been defined and applied using the concept (Äijälä et al. 2016). | ||||||||
| Pori | Kuopio | Pudasjärvi | Sodankylä | |||||
| 0 | 30 | 0 | 30 | 0 | 30 | 0 | 30 | |
| Treeless areas and small seedling stands, % | 3.4 | 3.8 | 6.1 | 5.3 | 12.4 | 0.2 | 2.1 | 0.3 |
| Small seedling stands with over story, % | 0.3 | 0.7 | 0.4 | 0.9 | 0.0 | 8.4 | 0.3 | 11.5 |
| Advanced seedling stands with over story, % | 1.8 | 14.3 | 2.5 | 14.1 | 0.1 | 19.1 | 0.0 | 31.2 |
| Advanced seedling stands, % | 11.5 | 0.7 | 15.3 | 1.3 | 5.9 | 3.0 | 4.8 | 1.8 |
| Young thinning stands, % | 16.9 | 10.6 | 15.0 | 16.9 | 23.5 | 15.7 | 19.1 | 7.0 |
| Advanced thinning stands, % | 42.0 | 23.9 | 49.4 | 23.6 | 23.5 | 17.7 | 19.7 | 6.7 |
| Mature stands, % | 23.9 | 45.5 | 11.3 | 37.3 | 34.6 | 35.9 | 53.9 | 41.5 |
The total cutting areas between the REFERENCE and GAME approach were same as the GAME approach as the cuttings were same as they were in the REFERENCE scenario. Whereas with the INTENSIFIED approach the total cutting areas were a little larger than the REFERENCE cutting areas (about 1.0–0.1%) at Pori, Kuopio and Pudasjärvi, except at a 1% interest rate in Kuopio, in which the total cutting area was about 1% smaller than the REFERENCE. Sodankylä differed from other forest holdings as the total cutting area was about 4–5% smaller than the REFERENCE.
4 Discussion
This study provides new knowledge on the trade-offs between timber production and GFFM, which despite on-going discussions (Miettinen 2009; Lindén et al. 2014; Finnish Wildlife Agency 2015; Melin et al. 2016) has not been assessed in detail. As the study results show, managing forest holdings in a game-friendly way can have rather minor effects on the economics. In this study, two alternative forest management approaches which defined the allowable forest operations and operation schedules of the stands were formulated based on knowledge on how to preserve potential habitats for grouse species. However, there are also several other species that could benefit from similar factors, such as the increased amount of understorey offering shelter, and extended regeneration ages of the stands (Zellweger et al. 2017).
In this study, five different interest rates for the NPV from 1 to 5% were applied. The impact of the interest rate on the NPV was remarkable, especially when the intensified GFFM approaches were applied. If the interest rate in the optimisations was low and well-growing mature thinning stands were selected for the INTENSIFIED treatment, a higher thinning intensity of these stands may occur, or the cutting removals in eventual thinnings could be greater than with the traditional REFERENCE forest management approach. Without the adjustment of the regeneration limits, these game stands would have been regenerated much earlier. Thus, the optimisation of NPV with the lowest interest rate caused intensive GFFM to be economically beneficial in three forest holdings. Maybe some cleanings of young stands were also delayed or even cancelled because of the high interest rate, and thus the cost enhancements are then discounted or diminished.
The mean tree volumes of the intensified stands were clearly higher than those in the normal stands (from 48 to 118%). At the same time, the mean area of intensified stands was 35 to 51% smaller than in normal stands. Thus the total area of the intensified stands was 10% of the area overall, and their importance for the NPV may be more than that as these stands seemed to be clearly sturdier than normal stands.
In this study, NPV was selected as an economic measure, as the study was interested in the timber production of the forest holdings. The influence of GFFM may depend on the goal variables that are selected. For example, a forest owner may want to increase carbon sequestering besides game keeping, and thus, prolongation of the regeneration ages may help to achieve both goals. Therefore, in the future, it would be important to study how the forest management preferences of different types of forest owners (Häyrinen 2019) would affect the trade-offs when game management is also considered and can be valued.
Nevertheless, the observed small effects of GFFM on the profitability, the existence of forest pests and diseases in some stands, or the high risk possibility of such pests and diseases occurring, would be wise to recognize when the INTENSIFIED game management approach for certain areas or stands is considered. For example, in the spruce forests in southern Finland, there can be notable volume and quality losses in cutting removals due to spruce rot, Heterobasidion parviporum (Fr.) Bref. (Niemelä and Korhonen), if the regeneration cuttings are delayed for too long (Piri 2003).
Besides grouse, GFFM offers more shelter and food sources for other wildlife species. However, this effect may be controversial concerning large herbivores such as moose and other deer species, especially in the INTENSIFIED approach, since delaying final cuttings may reduce areas of young successional stages which they prefer (Heikkilä and Härkönen 1996, Nikula et al. 2004). The economic consequences for the forest owners may then be affected accordingly though increased browsing damage if the area of seedling stands related to the cervid population becomes too low (Nikula et al. 2021).
We used 30 years as a time period in our study, which is shorter than the optimal rotation periods of the stands in Finland. However, the forest holdings of this study were quite large and consisted of stands from all development classes. Furthermore, at the same time as the simulation time increases, the uncertainty of the used models (especially with growth models) increases and discounted profits and losses rapidly decrease.
Achieving the objectives of GFFM efficiently may require coordinated planning, active information communication, more research about the habitat requirements of game, as well as the effects of game-friendly management operations, and of course, the favourable participation and activation of forest owners. The two presented GFFM approaches offer alternatives to the joint production of timber and game on a large area level. However, when a larger planning area is constructed of several smaller forest holdings, the planning situation differs and the classification and selection of the intensified stands should be done separately between forest owners if the economic losses are to be fair between the forest owners. This may reduce the average quality of intensified stands on some scale. The other possibility is to use compensatory lease payments which could also be voluntary for those forest owners whose economic losses would be remarkable. Furthermore, the broad participation of the forest owners is desirable.
In most GAME approaches, the NPV was reduced by about 1% or less. Among the INTENSIFIED approaches, the reduction was higher, although the reduction of NPV exceeded 5% in one case. These reductions of revenues due to GFFM are small despite the rather conservative assumptions made concerning the operation costs. These estimates of costs will, however, become more precise when GFFM methods become operationally used on a wider scale. The Finnish forest industry has been developing harvesting and transportation logistics intensively during the past decades. The size of the harvesting site plays a very important role in this development. However, it seems clear that the biodiversity can be better taken into consideration when the harvesting units are small. GFFM seems to provide an interesting compromise in this situation. The forest owner can compensate for the reduction of income by increasing the size of sales without losing sight of the biodiversity aims of the grouse-friendly harvesting proposed here. This means that the harvesting site could be large in those places where the harvesting operations could be implemented as in GFFM. Additionally, the harvesting damage to the surrounding forest could be better controlled if the non-harvested trees formed clear, larger, and distinct patches, instead of being single randomly placed trees within the stand (e.g., game-thickets). The stumpage price is strongly connected to the sales unit size, and larger sales lead to a higher timber prices (Buongiorno and Young 1984; Sydor and Mendell 2008). This easily compensates for the loss of revenue caused by intensified GFFM. Doubling the size of the sales would lead to an increase of about 0.5–1 euro/m3 in the stumpage price (Kolis et al. 2014), which corresponds to about 2–3% of the average stumpage price within the dataset. If the efficiency of operations can be increased, it can cover the costs of increased microsite variation (game spots) and most of the increased average forest cover (longer rotations). This would provide an upgraded habitat quality for grouse and many other forest-dwelling species.
Acknowledgements
This study was funded by The Finnish Wildlife Agency and Natural Resources Institute Finland (Luke). We thank the reviewers and the Subject Editor for helping us to improve the manuscript.
References
Äijälä O, Koistinen A, Sved J, Vanhatalo K, Väisänen P (eds) (2014) Metsänhoidon suositukset. [Forest management recommendations]. Metsätalouden kehittämiskeskus Tapion julkaisuja. http://tapio.fi/wp-content/uploads/2015/06/Metsanhoidon_suositukset_ver3_netti_1709141.pdf. Accessed 24 September 2020.
Barlow R, Grado S, Miller D, Grebner D (2007) Opportunity costs of managing for wildlife habitat in the North Central Hills Region of Mississippi. South J Appl For 31: 39–46. https://doi.org/10.1093/sjaf/31.1.39.
Buongiorno J, Young T (1984) Statistical appraisal of timber with an application to the Chequamegon National Forest. North J Appl For 1: 72–76. https://doi.org/10.1093/njaf/1.4.72.
Carley TJ, Grado SC (2000) Trade-offs in loblolly pine plantation and white-tailed deer management in the Middle Coastal Plain. In: Proceedings of the 1999 Southern Forest Economics Workshop “Timberland Investments: Improving the Odds”, 18–20 April 1999. International Society of Forest Resource Economics, Biloxi, Mississippi, USA, pp 57–62. https://pdfs.semanticscholar.org/a30f/12724d5a66f7b4aeaea76c8a0947db72a93c.pdf. Accessed 12 October 2020.
Eyvindson K, Repo A, Mönkkönen M (2018) Mitigating forest biodiversity and ecosystem service losses in the era of biobased economy. Forest Policy Econ 92: 119–127. https://doi.org/10.1016/j.forpol.2018.04.009.
Davis PB, Munn JA, Henderson JE, Strickland BK (2017) Economic trade-offs of managing for timber production or wildlife habitat. J Wildlife Manage 81: 1363–1371. https://doi.org/10.1002/jwmg.21330.
de-Miguel S, Bonet JA, Pukkala T, de Aragón JM (2014) Impact of forest management intensity on landscape-level mushroom productivity: a regional model-based scenario analysis. For Ecol Manage 330: 218–227. https://doi.org/10.1016/j.foreco.2014.07.014.
Finnish Forest Centre (2020) https://www.metsaan.fi/en/briefly-english. Accessed 12 June 2020.
Finnish Wildlife Agency (2015) Riistametsänhoidon työohjeet. [Working guidelines for gamekeeping]. http://riista.fi/wp-content/uploads/2015/09/Riistametsanhoidon-ty%C3%B6ohjeet-2015-Web.pdf. Accessed 23 September 2020.
Haakana H, Hirvelä H, Hanski IK, Packalen T (2017) Comparing regional forest policy scenarios in terms of predicted suitable habitats for the Siberian flying squirrel (Pteromys volans). Scand J For Res 32: 185–195. https://doi.org/10. 1080/02827581.2016.1221991.
Haakana H, Huhta E, Hirvelä H, Packalen T (2020) Trade-offs between wood production and forest grouse habitats in two regions with distinctive landscapes. For Ecosyst 7, article id 21. https://doi.org/10.1186/s40663-020-00227-2.
Häyrinen L (2019) Finnish forest owner objectives as indicators for a diversifying use of forests on the road to a bioeconomy. Diss For 280. https://doi.org/10.14214/df.280.
Helle P, Helle T (1991) Miten metsärakenteen muutokset selittävät metsäkanalintujen pitkän aikavälin kannanmuutoksia? [How do changes in forest structure explain recent changes in Finnish grouse populations?]. Suomen Riista 37: 56–66.
Heikkilä R, Härkönen S (1996) Moose browsing in young Scots pine stands in relation to forest management. For Ecol Manage 88: 179–186. https://doi.org/10.1016/S0378-1127(96)03823-6.
Heinonen T, Pukkala T, Mehtätalo L, Asikainen A, Kangas J, Peltola H (2017) Scenario analyses for the effects of harvesting intensity on development of forest resources, timber supply, carbon balance and biodiversity of Finnish forestry. Forest Policy Econ 80: 80–98. https://doi.org/10.1016/j.forpol.2017.03.011.
Hirvelä H, Härkönen K, Lempinen R, Salminen O (2017) MELA2016 reference manual. Natural resources and bioeconomy studies 7/2017. http://urn.fi/URN:ISBN:978-952-326-358-1.
Hynynen J, Ojansuu R, Hökkä H, Siipilehto J, Salminen H, Haapala P (2002) Models for predicting stand development in MELA System. The Finnish Forest Research Institute, Research Papers 835. http://urn.fi/URN:ISBN:951-40-1815-X.
Kilpeläinen H, Salminen O, Härkönen K, Miina J, Kurttila M (2018) Integrating bilberry yields into regional long-term forest scenario analyses. Scand J For Res 33: 378–386. https://doi.org/10.1080/02827581.2017.1407821.
Kline JD, Harmon ME, Spies TA, Morzillo AT, Pabst RJ, McComb BC, Schnekenburger F, Olsen KA, Csuti B, Vogeler JC (2016) Evaluating carbon storage, timber harvest, and habitat possibilities for a Western cascades (USA) forest landscape. Ecol Appl 26: 2044–2059. https://doi.org/10.1002/eap.1358.
Kolis K, Hiironen J, Ärölä E, Vitikainen A (2014) Effects of sale-specific factors on stumpage prices in Finland. Silva Fenn 48, article id 1054. https://doi.org/10.14214/sf.1054.
Kuitto P-J, Keskinen S, Lindroos J, Oijala T, Rajamäki J, Räsänen T, Terävä J (1994) Puutavaran koneellinen hakkuu ja metsäkuljetus. [Mechanical felling and forest haulage of timber]. Metsätehon tiedotus 410.
Lappi J (1992) JLP: a linear programming package for management planning. The Finnish Forest Research Institute, Research Papers 414. http://urn.fi/URN:ISBN:951-40-1218-6.
Lindén M, Rothsten-Lilja S, Saaristo L, Tokoi-Keto P (eds) (2014) Hyvän metsänhoidon suositukset – Riistametsänhoito. [Forest management recommendations – Game-friendly forestry]. Metsätalouden kehittämiskeskus Tapion julkaisuja.
Ludwig GX (2007) Mechanisms of population declines in boreal forest grouse. PhD thesis, University of Jyväskylä, Department of Biological and Environmental Science, Jyväskylä, Finland. http://urn.fi/URN:ISBN:978-951-39-2825-4.
MacMillan DC, Marshall K (2004) Optimising capercailzie habitat in commercial forestry plantations. For Ecol Manage 198: 351–365. https://doi.org/10.1016/j.foreco.2004.05.027.
Marzluff J, Millspaugh JJ, Ceder KR, Oliver CD, Withey J, McCarter JB, Mason L, Comnick J (2002) Modeling changes in wildlife habitat and timber revenues in response to forest management. For Sci 48: 191–202. https://doi.org/10.1093/forestscience/48.2.191.
Melin M, Mehtätalo L, Miettinen J, Tossavainen S, Packalen P (2016) Forest structure as a determinant of grouse brood occurrence – an analysis based on integration airborne LiDAR data to presence/absence field data. For Ecol Manage 380: 202–211. https://doi.org/10.1016/j.foreco.2016.09.007.
Miettinen J (2009) Capercaillie (Tetrao urogallus L.) habitats in managed Finnish forests – the current status, threats and possibilities. Diss For 90. https://doi.org/10.14214/df.90.
Miettinen J, Rantala M, Svensberg M (2015) Riistametsänhoidon opas. [The Game-Friendly Forestry Guide]. The Finnish Wildlife Agency. https://riista.fi/wp-content/uploads/2019/02/riistametsanhoidonopas_WEB_pakattu.pdf. Accessed 20 November 2020.
Miina J, Kurttila M, Calama R, de-Miguel S, Pukkala T (2020) Modelling non-timber forest products for forest management planning in Europe. Curr Forestry Rep 6: 309–322. https://doi.org/10.1007/s40725-020-00130-7.
Navarro G (2007) Forest valuation and the net present value concept in forestry economics. In: Cubbage FW (ed) Forests and Forestry in the Americas: An encyclopedia. Society of American Foresters and International Society of Tropical Foresters. https://www.researchgate.net/publication/303370376_Forest_Valuation_and_the_Net_Present_Value_Concept_in_Forestry_Economics. Accessed 20 September 2020.
Niemi G, Hanowski J, Helle P, Howe R, Mönkkönen M, Venier L, Welsh D (1998) Ecological sustainability of birds in boreal forests. Conserv Ecol 2, article id 17. https://doi.org/10.5751/ES-00079-020217.
Nikula A, Heikkinen S, Helle E (2004) Habitat selection of adult moose Alces alces at two spatial scales in central Finland. Wildlife Biol 10: 121–135. https://doi.org/10.2981/wlb.2004.017.
Nikula A, Matala J, Hallikainen V, Ihalainen A, Pusenius J, Kukko T, Korhonen KT (2021) Modelling the effect of moose Alces alces population density and regional forest structure on the amount of damage in forest seedling stands. Pest Manag Sci 77: 620–627. https://doi.org/10.1002/ps.6081.
Pasalodos-Tato M, Pukkala T, Calama R, Cañellas I, Sánchez-González M (2016) Optimal management of Pinus pinea stands when cone and timber production are considered. Eur J For Res 135: 607–619. https://doi.org/10.1007/s10342-016-0958-7.
Payne D, McNicol, J, Eason G, Abraham D (1988) Moose habitat management and timber management planning: three case studies. Forest Chron 64: 270–276. https://doi.org/10.5558/tfc64270-3.
Peura M, Triviño M, Mazziotta A, Podkopaev D, Juutinen A, Mönkkönen M (2016) Managing boreal forests for the simultaneous production of collectable goods and timber revenues. Silva Fenn 50, article id 1672. https://doi.org/10.14214/sf.1672.
Piri T (2003) Silvicultural control of Heterobasidion root rot in Norway spruce forests in southern Finland. Regeneration and vitality fertilization of infected stands. The Finnish Forest Research Institute, Research Papers 898. http://urn.fi/URN:ISBN:951-40-1887-7.
Pohjanmies T (2018) Trade-offs among intensive forestry, ecosystem services and biodiversity in boreal forests. Jyväskylä studies in biological and environmental science 342. http://urn.fi/URN:ISBN:978-951-39-7342-1.
Pukkala T (2016) Which type of forest management provides most ecosystem services? For Ecosyst 3, article id 9. https://doi.org/10.1186/s40663-016-0068-5.
Sirkiä S, Lindén A, Helle P, Nikula A, Knape J, Lindén H (2010) Are the declining trends in forest grouse populations due to changes in the forest age structure? A case study of Capercaillie in Finland. Biol Conserv 143: 1540–1548. https://doi.org/10.1016/j.biocon.2010.03.038.
Sjöberg K (1996) Modern forestry and the capercaillie. In: DeGraaf M, Miller RI (eds) Forested Landscapes. Chapman & Hall, London, pp 111–135. https://doi.org/10.1007/978-94-009-1521-3_4.
Sydor T, Mendell BC (2008) Transaction evidence analysis; stumpage prices and risk in central Georgia. Can J For Res 38: 239–246. https://doi.org/10.1139/X07-126.
TEEB (2010) The economics of ecosystems and biodiversity: mainstreaming the economics of nature: A synthesis of the approach, conclusions and recommendations. http://www.teebweb.org/wp-content/uploads/Study%20and%20Reports/Reports/Synthesis%20report/TEEB%20Synthesis%20Report%202010.pdf. Accessed 8 March 2021.
Triviño M, Juutinen A, Mazziotta A, Miettinen K, Podkopaev D, Reunanen P, Mönkkönen M (2015) Managing a boreal forest landscape for providing timber, storing and sequestering carbon. Ecosyst Serv 14: 179–189. https://doi.org/10.1016/j.ecoser.2015.02.003.
Triviño M, Pohjanmies T, Mazziotta A, Juutinen A, Podkopaev D, Le Tortorec E, Mönkkönen M (2017) Optimizing management to enhance multifunctionality in a boreal forest landscape. J Appl Ecol 54: 61–70. https://doi.org/10.1111/1365-2664.12790.
Vanhatalo K, Väisänen P, Joensuu S, Sved J, Koistinen A, Äijälä O (eds) (2015) Metsänhoidon suositukset suometsien hoitoon, työopas. [Forest management recommendations for peatlands, working guide] Tapion julkaisuja. http://tapio.fi/wp-content/uploads/2015/06/MHS_opas_suometsien_hoitoon_20150222_TAPIO1.pdf. Accessed 22 October 2020.
Williams L, Gregg I, Palmer W (2001) Management plan for ruffed grouse in Pennsylvania 2011-2020. Bureau of Wildlife Management, Pennsylvania Game Commission. https://www.pgc.pa.gov/Wildlife/WildlifeSpecies/Documents/Ruffed%20Grouse%20Management%20Plan%202011-2020.pdf. Accessed 22 October 2020.
Zawadzka D (2014) Best practice guide for the protection of the capercaillie and black grouse. Centrum Koordynacji Projektów Środowiskowych. https://webgate.ec.europa.eu/life/publicWebsite/index.cfm?fuseaction=search.dspPage&n_proj_id=4023. Accessed 22 October 2020.
Zellweger F, Roth T, Bugmann H, Bollmann K (2017) Beta diversity of plants, birds and butterflies is closely associated with climate and habitat structure. Global Ecol Biogeogr 26: 898–906. https://doi.org/10.1111/geb.12598.
Zimmerman GS, Gilmore DW, Gutiérrez RJ (2007) Integrating grouse habitat and forestry: an example using the ruffed grouse Bonasa umbellus in Minnesota. Wildlife Biol 13: 51–58. https://doi.org/10.2981/0909-6396(2007)13[51:IGHAFA]2.0.CO;2.
Total of 51 references.
