Mats Erik Berlin  ,
Torgny Persson,
Gunnar Jansson,
Matti Haapanen,
Seppo Ruotsalainen,
Lars Bärring,
Bengt Andersson Gull
,
Torgny Persson,
Gunnar Jansson,
Matti Haapanen,
Seppo Ruotsalainen,
Lars Bärring,
Bengt Andersson Gull
Scots pine transfer effect models for growth and survival in Sweden and Finland
Berlin M. E., Persson T., Jansson G., Haapanen M., Ruotsalainen S., Bärring L., Andersson Gull B. (2016). Scots pine transfer effect models for growth and survival in Sweden and Finland. Silva Fennica vol. 50 no. 3 article id 1562. https://doi.org/10.14214/sf.1562
Highlights
- Scots pine transfer effect models for growth and survival, valid in both Sweden and Finland have been developed
- The models use high-resolution gridded climate data and can predict performance in future climatic conditions
- The models perform well both for unimproved and genetically improved material and can be used to develop deployment recommendations of contemporary forest regeneration material in Sweden and Finland.
Abstract
In this study, we developed models of transfer effects for growth and survival of Scots pine (Pinus sylvestris L.) in Sweden and Finland using a general linear mixed-model approach. For model development, we used 378 provenance and progeny trials with a total of 276 unimproved genetic entries (provenances and stand seed check-lots) distributed over a wide variety of climatic conditions in both countries. In addition, we used 119 progeny trials with 3921 selected genetic entries (open- and control pollinated plus-tree families) for testing model performance. As explanatory variables, both climatic indices derived from high-resolution gridded climate datasets and geographical variables were used. For transfer, latitude (photoperiod) and, for describing the site, temperature sum were found to be main drivers for both survival and growth. In addition, interaction terms (between transfer in latitude and site altitude for survival, and transfer in latitude and temperature sum for growth) entail changed reaction patterns of the models depending on climatic conditions of the growing site. The new models behave in a way that corresponds well to previous studies and recommendations for both countries. The model performance was tested using selected plus-trees from open and control pollinated progeny tests. Results imply that the models are valid for both countries and perform well also for genetically improved material. These models are the first step in developing common deployment recommendations for genetically improved forest regeneration material in both Sweden and Finland.
Keywords
Pinus sylvestris;
adaptation;
tree breeding;
reaction patterns;
forest regeneration material
-
Berlin,
Uppsala Science Park, SE-75183 Uppsala, Sweden
E-mail
mats.berlin@skogforsk.se
- Persson, Skogforsk, Box 3, SE-91821 Sävar, Sweden E-mail torgny.persson@skogforsk.se
- Jansson, Uppsala Science Park, SE-75183 Uppsala, Sweden E-mail gunnar.jansson@skogforsk.se
- Haapanen, Natural Resources Institute Finland (Luke), Green Technology, Box 18, FI-01301 Vantaa, Finland E-mail matti.haapanen@luke.fi
- Ruotsalainen, Natural Resources Institute Finland (Luke), Green Technology, Finlandiantie 18, FI-58450 Punkaharju, Finland E-mail seppo.ruotsalainen@luke.fi
- Bärring, Rossby Centre, Swedish Meteorological and Hydrological Institute, Folkborgsvägen 17, SE-60176 Norrköping, Sweden E-mail lars.barring@smhi.se
- Andersson Gull, Skogforsk, Box 3, SE-91821 Sävar, Sweden E-mail bengt.andersson@skogforsk.se
Received 4 February 2016 Accepted 2 June 2016 Published 10 June 2016
Views 188746
Available at https://doi.org/10.14214/sf.1562 | Download PDF

1 Introduction
In the latest assessment report from IPCC (IPCC 2014), future climate change (predicted as the difference between the recent period 1986–2005 and the future period 2081–2100) is expected to manifest itself as a global increase in the annual mean temperature between 0.3 C° at the low end of the most stringent scenario with directed mitigation and 4.8 C° at the high end with the highest greenhouse gas emissions. For Sweden and Finland, the general trend is similar and the effects of warming will be greater in the northern parts, especially during winter (Kjellström et al. 2014). A recent study has shown that global warming alters climatic conditions known to affect survival and productivity of forest trees in the boreal region (Bärring et al. 2016). For example, the vegetative growth period is expected to be extended by around one month by 2050 compared to the current climate, based on the medium–high emission scenario (Bärring et al. 2016).
Studies of Scots pine (Pinus sylvestris L.) under boreal conditions have shown that global warming could potentially have a large positive effect on productivity (Bergh et al. 2003; Bergh et al. 2010), although this potential is only achievable in practice if the reaction of different forest regeneration materials (FRM) to climate change is known and if well-adapted genetic materials are used (Beuker 1994; Persson and Beuker 1997; Persson 1998; Rehfeldt et al. 2002). Forest tree provenance experiments have been established to evaluate adaptive properties and performance of FRM by testing provenances in common garden trials, where both provenances and trial locations ideally should cover a wide range of environments and climatic conditions.
Variation in spatial climatic conditions can be interpreted in terms of temporal trends, which facilitates the development of models predicting reaction to climate change. This has been done for several coniferous species worldwide (Rehfeldt et al. 2002; Thomson and Parker 2008; Thomson et al. 2009; Wang et al. 2010; Kapeller et al. 2012; Leites et al. 2012a; Farjat et al. 2015). Modeling approaches used in these earlier studies vary somewhat. In general, “response functions” describe the reaction pattern of a specific provenance/population, when tested at several sites (Rehfeldt et al. 2002; Kapeller et al. 2012). In contrast, “transfer functions” describe the reaction patterns of a set of provenances/populations tested at a specific site (Rehfeldt et al. 1999).
The transfer-function approach has sometimes been generalized by pooling data from several sites to provide a single, static transfer function (Schmidtling 1994; Carter 1996; Andalo et al. 2005). For most situations, this is a simplification as there is evidence that reaction patterns of provenances/populations are different depending on climatic and geographic conditions at both the planting site and the provenance/population origin (Persson and Ståhl 1993; O’Neill et al. 2008; Leites et al. 2012a,b; Farjat et al. 2015). Thus, models have been developed that include both planting site conditions (X) and population/provenance origin conditions (Y) (or where one is replaced with a transfer distance, Δ = Y–X), as well as interaction terms between the two (X*Y) to allow for “dynamic” reaction patterns. For example, Wang et al. (2010) developed “Universal Response Functions” for lodgepole pine (Pinus contorta Dougl. var. latifolia Engelm.) using provenance trials and simultaneously modeling variable classes X, Y and X*Y. This approach was later used by Farjat et al. (2015) for loblolly pine (Pinus taeda L.). Furthermore, Leites et al. (2012a,b) developed height-growth response models for Douglas-fir (Pseudotsuga menziesii (Mirb.) Franco) and western larch (Larix occidentalis Nutt.) using provenance trials and simultaneously modeling variable classes Y, Δ and Y*Δ. For Scots pine, effects of transfer have been described, modeling local site performance and effects of transfer separately using variable classes X, Δ and X*Δ (Persson and Ståhl 1993; Persson 1994). The abovementioned approaches differ depending on the aim of the study, field data used and statistical considerations, but they are all characterized by providing estimates of performance for an arbitrary provenance/population at an arbitrarily selected site, where the reaction patterns vary over the sites and provenances/populations (i.e., they are “dynamic” or “universal”).
In Sweden and Finland, the utilization of FRM for one of the main commercial species, Scots pine, relies on transfer recommendations developed as a result of many decades of provenance research (Eiche 1966; Eriksson et al. 1980; Persson and Ståhl 1993; Persson 1994). For Scots pine in Sweden, deployment recommendations are based on transfer functions for growth and survival together with genetic gain estimates for the seed sources, which are combined into estimated per-hectare production over a rotation (Berlin et al. 2014). In southern Finland, the current recommendation is to reforest with material of “local origin”, whereas in northern Finland there is a preference to use limited transfers to the south. In the Finnish recommendations, locality is defined by temperature sum (Tapio 2006). Although recommendations for both countries refer to climatic variables that can be projected to future conditions, there are some obvious draw-backs to the models currently used. First, climatic variables were derived from earlier time periods (1961–1976 for Sweden and 1961–1990 for Finland) and are not good representations of the current climate (Bärring et al. 2016). Second, the climate data variables (Odin et al. 1983; Morén and Perttu 1994) were based on information from sparse networks of meteorological stations. The variables are thus not fully compatible with state-of-the-art climate models (Bärring et al. 2016), which makes it difficult to extend the models that are currently in use to include projected climate changes. Finally, transfer models and deployment recommendations are derived in different ways in Sweden and Finland, and are thus not directly comparable if we envision using FRM in both countries.
In Sweden and Finland, extensive field data from provenance trials and progeny trials containing suitable stand seed check-lots from various latitudes, are available for analysis. In addition, state-of-the-art climate models have recently been used to identify climate variables considered important for Scots pine performance that are common to both countries (Bärring et al. 2016).
The main aim of this study was to develop models of Scots pine transfer effects for growth and survival in Sweden and Finland. The models are universal (cf. Wang et al. 2010) in the sense that transfer effects will vary depending on both planting site and provenance characteristics. The models were developed using a general linear mixed-model approach involving both geographic and climatic variables, derived from state-of-the-art high-resolution gridded climate data, which are consistent with regional climate model data. For developing the models, records of growth and survival from provenance trials and stand seed check-lot data (i.e., bulked seed lots collected from several individual trees within a stand used as references) from progeny trials were used. The development of new models is the necessary first step in developing common deployment recommendations for genetically improved FRM in both Sweden and Finland. Therefore, another aim of the study was to investigate the model performance when applied to plus-tree progeny data, where one or both parents are known, serving as a proxy for contemporary seed orchards in Sweden and Finland. While the models are capable of accounting for the effects of climate change, we do not consider these effects as they will be analyzed in a forthcoming study including operational FRM in Sweden and Finland.
2 Materials and methods
2.1 Field trial data
In both Sweden and Finland, a large number of Scots pine provenance and progeny trial series have been established and analyzed during the 20th century. In addition, a majority of the progeny trial series established during the same time period in both countries included check-lots from various photoperiodic and/or climatic conditions that served as references of un-improved stand seed. There are thus different categories of trial series containing valuable information for developing models of transfer effects in both countries. Although the data are heterogeneous, with different trial designs, lack of overlap of genetic entries tested among trial series, large span in establishment years and ages of assessment, thus complicating an aggregate analysis, we believe that the trade-off between complexity and information in this case favors including as many trials as possible (cf. Persson 1994). The field trial data used in this study were therefore divided into two large groups. The first group consists of provenance and progeny trials where provenances and check-lots are used for developing the transfer effect models for growth and survival. The second group consists of progeny trials where the plus-tree progenies are used for testing the model performance.
To develop robust and reliable transfer effect models, it is essential that both trial sites and genetic entry origins have a large geographic and climatic distribution in order to reveal reaction patterns and to separate those from site conditions. For development of the models, we selected genetic entries of autochthonous origin from both provenance trials (provenances) and progeny trials (stand seed check-lots) that fulfilled these criteria.
To test the model performance when applied to genetically improved material, we used progeny data from plus-trees, phenotypically selected in natural stands, serving as a proxy for contemporary productive seed orchards in Sweden and Finland. Some, but not all, of the progeny trials overlapped with trials used for developing the models. The plus-trees were represented by half-sibs produced from seed collected in natural stands or by full-sibs produced by controlled crosses in clonal archives or seed orchards. The half-sibs’ origins were considered to be the stand location of the plus-trees and the full-sib origins were calculated as the mid-parent values (cf. Andersson et al. 2007; O’Neill et al. 2014; Farjat et al. 2015). As progeny trials in both Finland and Sweden are designed to test well-adapted candidate trees within a restricted target area they are not well suited for developing transfer functions. They generally have a very narrow variation in tested plus-tree origins and are often transferred only in one direction (usually southwards), making it very hard to find reaction patterns and distinguish those from trial site effects. Therefore, in this study progeny data were only used to test the model performance to predict recorded progeny outcomes. This makes it possible to find potential differences in reaction patterns between unimproved and improved trees. Provenances, check-lots and progeny are henceforth referred to as “genetic entries”.
In total, 378 field trials and 276 genetic entries distributed over a large climatic and geographic gradient in both countries were used for developing the models, and 119 field trials and 3921 genetic entries were used for testing the model performance (Table 1, Fig. 1, Fig. 2). To avoid extremely maladapted entries strongly influencing the modeling, genetic entries transferred more than 5° northwards or 5° southwards were excluded from the analysis. Only field trials north of latitude 60°N were selected for this study. This limit corresponds to the southernmost part of Finland so that, photoperiodically, the data cover the same areas in both countries. This also means that the study and model validity is limited to the region north of latitude 60°N in Sweden.
| Table 1. The number of trials and genetic entries (N) used in both the model development (provenance and check-lot data) and for testing model performance (progeny data) parts of the study and their mean (minimum and maximum in parentheses) latitude (LAT), longitude (LONG), altitude (ALT) and temperature sum (TS). | |||||
| N | LAT (°N) | LONG (°E) | ALT (m a.s.l) | TS1 | |
| Provenance and check-lot data | |||||
| Finnish trials | 289 | 63.9 (60.2–69.4) | 27.0 (22.0–31.6) | 178 (5–300) | 1042 (577–1396) |
| Swedish trials | 89 | 64.0 (60.1–67.8) | 17.7 (12.4–23.2) | 346 (5–775) | 863 (618–1133) |
| Finnish entries | 163 | 65.3 (60.0–69.8) | 26.3 (17.8–31.3) | 170 (5–415) | 941 (539–1390) |
| Swedish entries | 113 | 64.2 (57.6–69.8) | 18.5 (12.8–28.6) | 291 (5–850) | 888 (528–1530) |
| Progeny data | |||||
| Finnish trials | 19 | 62.4 (60.7–66.5) | 26.3 (24.1–29.4) | 128 (71–282) | 1186 (756–1346) |
| Swedish trials | 100 | 64.5 (61.0–67.6) | 18.5 (12.4–23.3) | 313 (25–724) | 856 (618–1066) |
| Finnish entries | 690 | 62.0 (60.0–66.8) | 27.0 (21.6–30.9) | 122 (82–283) | 1220 (838–1341) |
| Swedish entries | 3231 | 65.2 (61.7–68.5) | 18.9 (13.0–23.8) | 314 (0–754) | 829 (452–1077) |
| 1 Long term average heat sum (degree days), threshold 5 °C. | |||||
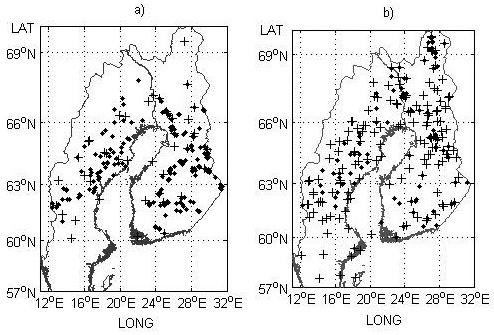
Fig. 1. Field trial sites a) and genetic entry origins b) used for the model development part of the study. Provenance trials and origins are indicated by black crosses and progeny trials and check-lots by black dots.
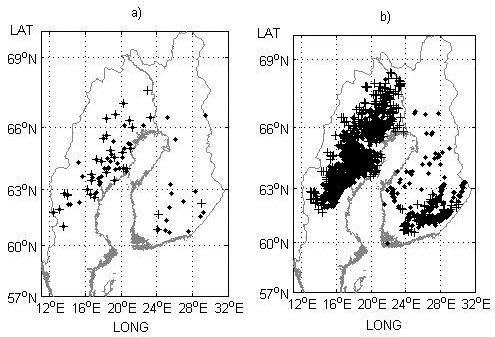
Fig. 2. Field trial sites a) and genetic entry origins b) used for model performance testing in the study. Progeny trials with half-sibs and their origins are indicated by black crosses and progeny trials with full-sibs and their origins (mid-parent values) by black dots.
For each selected trial, records used for height and survival were from the most recent assessment, but before effects of competition and/or pre-commercial thinning may have biased the results. As trial designs and assessment regimes have varied over the more than 50-year span between the first established and last assessed trial used in the study, the resulting data were heterogeneous (Table 2).
| Table 2. The average number of genetic entries per trial, trials per genetic entry, trees analyzed and mean survival, height, establishment year, age of height assessment, and age of survival assessment used in both the model development (provenance and check-lot data) and for testing model performance (progeny data) parts of the study (maximum and minimum values in parentheses where applicable). View in new window/tab. |
2.2 Pre-adjustment and standardization of field trial data
Field trial data were analyzed in two steps: (i) a pre-adjustment and standardization resulting in least-square means of survival and tree height per site and genetic entry (described in this section); and subsequently used in (ii) the model development (section 2.4).
Due to the heterogeneity of the data (e.g., different trial designs) and the wide variety of (micro)environmental conditions at the trial sites, a pre-adjustment was performed for each field trial with respect to both height and survival, to provide environmentally adjusted genetic-entry means for the subsequent analysis. For trial designs with single-tree plots, the pre-adjustment model was:
and for trial designs with multiple-tree plots:
![]()
where yklm is the dependent variable (individual tree height or survival), μ is the site mean, bk is the fixed effect of block, gl is the fixed effect of genetic entry, pkl is the random effect of plot for multiple-tree plots, eklm is the residual deviation, k is the number of blocks, l is the number of genetic entries, m is the number of individual trees and ![]() and
and ![]() . For some older trials (designed as multiple-tree plots), individual tree data were no longer available so plot-mean values were used instead, and the pre-adjustment was performed according to the model structure in Eq. 1.
. For some older trials (designed as multiple-tree plots), individual tree data were no longer available so plot-mean values were used instead, and the pre-adjustment was performed according to the model structure in Eq. 1.
The models were used to estimate environmentally adjusted least-square (LS) means for a given site i and genetic entry j of tree height ![]() and survival
and survival ![]() (%) using procedures GLM and MIXED from the SAS STAT package (SAS Institute Inc. 2011). The pre-adjusted LS means were subsequently used in the development and testing of the transfer effect models. The pre-adjustment resulted in 2850 (2162 Finnish and 688 Swedish) LS means available for the model development and 12 499 (867 Finnish and 11 657 Swedish) LS means available for testing the model performance.
(%) using procedures GLM and MIXED from the SAS STAT package (SAS Institute Inc. 2011). The pre-adjusted LS means were subsequently used in the development and testing of the transfer effect models. The pre-adjustment resulted in 2850 (2162 Finnish and 688 Swedish) LS means available for the model development and 12 499 (867 Finnish and 11 657 Swedish) LS means available for testing the model performance.
Studies have shown that mortality of Scots pine in northern Sweden mainly occurs before trees reach 2.5 m in height and that this developmental phase is reached at rather different tree ages depending on various growth site conditions (Persson and Ståhl 1993). In our study, survival assessment ages varied between 7–35 years and climatic conditions between 577–1396 in temperature sum (day degrees). We therefore standardized the survival rates to an equivalent stage of plant development (cf. Persson 1994). Consequently, the genetic-entry LS means for survival were transformed to the level of survival at 2.5 m height in our study by using the formula developed by Persson and Ståhl (1993):
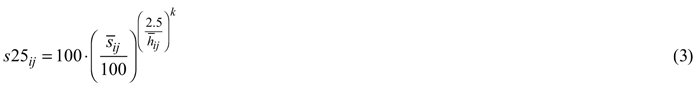
where s25ij is the genetic-entry LS mean survival transformed to 2.5 m height, ![]() is the genetic-entry LS mean survival, and
is the genetic-entry LS mean survival, and ![]() is the genetic-entry LS mean height for a given site i and genetic entry j. Furthermore, from Persson and Ståhl (1993),
is the genetic-entry LS mean height for a given site i and genetic entry j. Furthermore, from Persson and Ståhl (1993), ![]() where TSi is the temperature sum (Morén and Perttu 1994) at site i.
where TSi is the temperature sum (Morén and Perttu 1994) at site i.
Transformations were applied to normalize the data and improve statistical properties in the subsequent analysis for both height and survival. For height modeling, the dependent variable was transformed with a natural logarithm so that ![]() and, for survival modeling, the logit transformation was used so that
and, for survival modeling, the logit transformation was used so that ![]() , where
, where ![]() and s25ij are as described above.
and s25ij are as described above.
2.3 Climate data
The climate data used in this study were derived from meteorological observations interpolated into high-resolution gridded data combined from the two national data sets for Sweden and Finland. The PTHBV dataset had a spatial resolution of 4 × 4 km and the FINADAPT dataset a spatial resolution of 10 × 10 km (Bärring et al. 2016). Climate indices considered important for Scots pine performance in boreal conditions were calculated for each grid from daily mean temperature and precipitation observations, converting them to averages spanning the period 1961–2007, which was considered to represent the current climate (Bärring et al. 2016). This period also corresponds to and encompasses the climate encountered by the genetic entries in the selected field trials. Each trial site and genetic entry origin was assigned the climatic indices from the corresponding grid. The climate indices and geographical data used for modeling are shown in Table 3.
| Table 3. A summary of the variables describing geographical location, site and climatic conditions for trial sites and genetic entry origins. | ||
| Variable | Time span1 | Description |
| LAT | - | Latitude (degrees, WGS84) |
| LONG | - | Longitude (degrees, WGS84) |
| ALT | - | Altitude (m a.s.l.) |
| TS | ANN | Long term average temperature sum during the growing season (degree days), threshold 5 °C. |
| Tmean | ANN, DJF, MAM, JJA, SON | Mean temperature (°C) |
| ContInd | ANN | Continentality index calculated as the difference between the average July mean temperature and January mean temperature. A lower value represents a maritime climate whereas a higher value represents a continental climate. |
| VegPer | ANN | Vegetation period length. The number of days between the start and end of the vegetation period. |
| VegStart | ANN | Vegetation period start. The first day of the year in the first continuous period where the mean temperature has been at least 5 °C for four consecutive days. |
| VegEnd | ANN | Vegetation period end. The last day of the year in the last continuous period where the mean temperature has been at least 5 °C for four consecutive days. |
| MaxDrySpell2 | ANN, AMJJ, ASO | Dry spell (days). The longest continuous period in which the precipitation is <1mm/day. |
| precipSum2 | ANN, AMJJASO | Precipitation (mm). |
| 1 Different time spans for the variable. ANN = Annual. DJF = December–February. MAM = March–May. JJA = June–August. SON = September–November. AMJJ = April–July. ASO = August–October. AMJJASO = April–October. 2 The drought and precipitation indices exhibited systematic differences between the countries (Bärring et al. 2016) and could therefore only be used for within country analyses. | ||
2.4 Statistical analysis – development of transfer effect models
We modeled the effects of environment (site) and genetics (transfer) simultaneously, an approach found to be advantageous in comparison to methods where these effects are analyzed separately and combined afterwards (Wang et al. 2010; Leites et al. 2012a). Three main categories were used as independent variables: (i) those describing the trial site; (ii) transfer; and (iii) the interaction between the two.
The general structure of the mixed model (Proc MIXED, SAS Institute Inc. 2011) used in the model development was then:
where Yij is the dependent variable (tree height or survival), μ is the intercept, δ is a dummy variable with the value 0for sites located in Sweden and 1 for sites located in Finland, Xi are the n independent variables describing the site, Zij are the m independent variables describing transfer, Vij are the q terms representing the interaction between independent variables describing the site and transfer, ui and eij represent the random variation between and within sites respectively, α1,...,n, β1,...,m and γ1,...,q are coefficients, i represents sites and j represents genetic entry means within a site. For each genetic entry, a weight, ![]() , was applied by using the WEIGHT statement in Proc MIXED (SAS Institute Inc. 2011), where nij is the number of tree records behind every genetic entry. This was done to account for the varying amount of information behind the genetic-entry means. Furthermore,
, was applied by using the WEIGHT statement in Proc MIXED (SAS Institute Inc. 2011), where nij is the number of tree records behind every genetic entry. This was done to account for the varying amount of information behind the genetic-entry means. Furthermore, ![]() and
and ![]() .
.
Due to the large number of independent variables, the model development was done in two stages, where the first stage was an exploratory analysis with the aim of selecting a reduced sample of variables and variable combinations to be used in the subsequent modeling stage. The modeling approach combined: (i) the use of statistical measures for model selection, Akaike’s Corrected Information Criterion (AICC) (Akaike 1973; Hurvich and Tsai 1989); (ii) residual analysis; (iii) parsimony; (iv) a priori knowledge of modeling structures from earlier studies of transfer effects of Scots pine (Persson and Ståhl 1993; Persson 1994; Andersson et al. 2003; Andersson et al. 2007); and (v) biological soundness. Variables describing the site were the geographic and climatic data shown in Table 3, along with information related to the particular trial data used, i.e., age of assessment and trial establishment year (Table 2). Variables describing transfer were calculated for every geographic and climatic variable described above as Zij = Xj – Xi, where Zij and Xi are as described above and Xj is the independent variable describing the genetic-entry origin.
In the first stage of the modeling approach, preliminary regression and correlation analysis were used to screen independent variables. Most variables with predictive power for site or for transfer were highly correlated, and therefore we did not use more than one at the time (site and transfer effects considered separately in this respect) in the subsequent analyses (cf. Leites et al. 2012a). In the subsequent modeling stage, not all but several different combinations of first-order interaction between site and transfer variables were tested. In particular, transfers in latitude or temperature sum were combined with several different site variables comprising altitude, temperature sum, annual mean temperature and a binary dummy variable representing country ( δ ). In particular, δ was used to discern possible differences in the transfer effects between the two countries. This is a crucial test to make if the aim is to develop models that are generally valid for both countries. Furthermore, the independent variables describing site were both left untransformed and transformed with natural logarithms, square roots, squares, and inverses. In particular, care was taken (e.g., by transformations of certain variables) to ensure biologically reasonable effects in the real (i.e., back-transformed) scale. All models were compared using AICC and the best-performing model was selected.
To illustrate the model performance, back-transformation of the independent variables was also undertaken. When back-transforming height, an adjustment term for logarithmic bias (φ) was introduced (Baskerville 1972; Lee 1982) and calculated as ![]() .
.
2.5 Testing the model performance
The model performance was tested using the progeny data to predict height and survival as:
where ![]() is the predicted value of height or survival when the models are calculated with the actual values of the independent variables describing site i (
is the predicted value of height or survival when the models are calculated with the actual values of the independent variables describing site i (![]() ), transfer of genetic entry j (
), transfer of genetic entry j (![]() ) and the interaction terms (
) and the interaction terms (![]() ) from the progeny data. All other terms are as described above.
) from the progeny data. All other terms are as described above.
The predicted height or survival values calculated from the models were then compared with the recorded outcomes from the progeny trials as ![]() , where dij is the deviation between the recorded genetic entry mean value from the progeny data
, where dij is the deviation between the recorded genetic entry mean value from the progeny data ![]() and
and ![]() .
.
3 Results
For tree height, the best model included the natural logarithms of age at the time of assessment, year of establishment (scaled using the establishment year minus 1945) and temperature sum as factors describing the site. The effect of country was not significant for height. Transfer effects were best modeled by latitudinal transfer and its square, both alone and as interaction terms with temperature sum. The back-transformed height (expressed in meters for simplicity and descriptive purposes) was then:

Coefficients and p-values are given in Table 4.
| Table 4. Coefficients and variance estimates with the natural logarithm of height as the dependent variable. Independent variables are the age of height assessment (ah), establishment year minus 1945 (EY-1945), temperature sum (TS) and transfer in latitude (ΔLAT). | |||
| Variable | Coefficient | Estimate | p-value |
| Intercept | μ | –6.0063 | <0.0001 |
| ln ah | α1 | 1.6279 | <0.0001 |
| ln (EY-1945) | α2 | 0.156 | <0.0001 |
| ln TS | α3 | 0.995 | <0.0001 |
| ΔLAT | β1 | 0.02907 | <0.0001 |
| ΔLAT2 | β2 | –0.01714 | <0.0001 |
| TS×ΔLAT | γ1 | –0.00005 | <0.0001 |
| TS×ΔLAT2 | γ2 | 0.000011 | <0.0001 |
| Variance between trials | 0.06237 | ||
| Variance within trials | 0.03336 | ||
| Total variance in dependent variable | 2.1907 | ||
For tree survival, the best model included the temperature sum, its natural logarithm and a dummy variable indicating country as factors describing the site. Transfer effects were best modeled by latitudinal transfer and its square, both by themselves and as interaction terms with altitude. The back-transformed survival in percent was then:

Coefficients and p-values are given in Table 5.
| Table 5. Coefficients and variance estimates with the logit transformed survival projected to 2.5 m height as the dependent variable. Independent variables are temperature sum (TS), transfer in latitude (ΔLAT), altitude (ALT) and a dummy variable ( δ ) where 0 represents Sweden and 1 Finland. | |||
| Variable | Coefficient | Estimate | p-value |
| Intercept | μ | –86.3416 | <0.0001 |
| Country | δ | –0.9286 | <0.0001 |
| TS | α1 | –0.01082 | 0.0005 |
| ln TS | α2 | 14.2905 | <0.0001 |
| ΔLAT | β1 | 0.1626 | <0.0001 |
| ΔLAT2 | β2 | –0.05642 | <0.0001 |
| ALT×ΔLAT | γ1 | 0.000864 | <0.0001 |
| ALT×ΔLAT2 | γ2 | –0.00007 | 0.0011 |
| Variance between trials | 0.8134 | ||
| Variance within trials | 4.0489 | ||
| Total variance in dependent variable | 27.5474 | ||
To illustrate the model performance, four sites were selected to represent harsh and mild conditions covering the geographic area being studied, and were assigned appropriate values for the modeled site variables (Table 6).
| Table 6. The four representative sites chosen to illustrate the model performance. | ||||
| Site | LAT1 | TS2 | ALT3 | Description |
| 62M | 62 | 1200 | 100 | Milder coastal areas in central Sweden and milder areas in southern Finland. |
| 62H | 62 | 750 | 450 | Harsher high-altitude sites in central Sweden. |
| 66M | 66 | 1000 | 100 | Milder low-land and coastal areas in northern Sweden and Finland. |
| 66H | 66 | 650 | 350 | Harsher areas with higher altitudes in northern Sweden and Finland. |
| 1 Approximate latitude corresponding to the general site description and combination of TS and ALT. 2 Long term average heat sum (day degrees), threshold 5 °C. 3 Altitude (m a.s.l.) | ||||
To illustrate the performance of the height transfer effect model, the establishment year was set to 1980 and the age of assessment to 30 years. The transfer span was chosen to be between 4° of latitude to the south and 2° of latitude to the north, to cover the most important dynamics and to facilitate comparison with previous studies.
At the harsher sites (62H and 66H), the optimal transfer for height growth is around 0.5° of latitude to the north and zero transfer seems to be near optimal (Fig. 3). Transfer to the south and too far to the north reduces height growth.
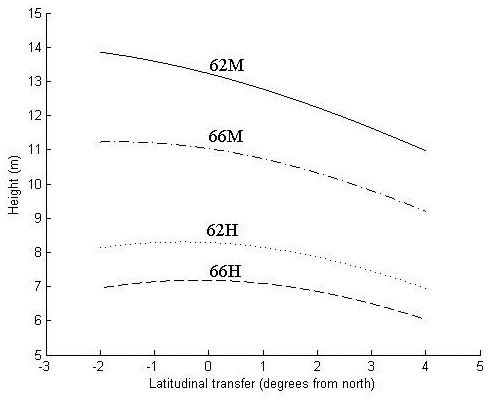
Fig. 3. Height in meters at age 30 years as a function of latitudinal transfer from four representative sites. Two sites are at latitude 62°N, where one is considered mild (62M) and one harsh (62H), and two at latitude 66°N, where one is considered mild (66M) and one harsh (66H). For detailed descriptions of the sites see Table 6.
At the northern, mild site (66M), optimal transfer is around 2° of latitude to the north, whereas the southern mild site (62M) trees exhibit a continued increase of height growth with even greater northward transfer. For all sites, transfer to the south reduces height growth.
The increase in height growth at optimal transfer is negligible at the harsh sites and around 2% and 6% at the northern (66M) and southern (62M) mild site, respectively. For all sites, a southward transfer of 3°, and for the two harsh sites a northward transfer of 4°, results in a decreased height growth of around 10%.
The first obvious thing with respect to the model performance for survival (Fig. 4) is that it is lower in Finland (Fig. 4b) than in Sweden (Fig. 4a), i.e., around 15% at zero transfer. Nevertheless, the transfer effects are similar in both countries, where optimal transfer for increased survival is around 2° of latitude to the south for the two milder sites (62M and 66M). For the harsher sites (62H and 66H), optimal transfer is even further to the south, around 3° of latitude.
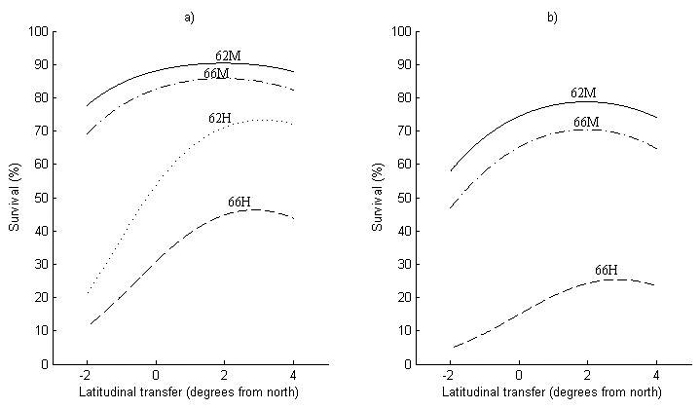
Fig. 4. Survival at 2.5 meters height for (a) Sweden and (b) Finland as a function of latitudinal transfer from four representative sites. Two sites are at latitude 62°N, where one is considered mild (62M) and one harsh (62H), and two at latitude 66°N, where one is considered mild (66M) and one harsh (66H). Note that (62H) represents a site type that does not occur in Finland and is therefore not shown in (b). For detailed descriptions of the sites see Table 6.
The increase in survival by transferring to the south can be substantial at harsh sites (62H and 66H), around 10–20% at optimal transfer, with an equally large decrease in survival when transferring a similar distance to the north. The increase in survival by transferring south is smaller at milder sites (62M and 66M), whereas the decrease in survival by northward transfer can be almost as large as at harsher sites.
The deviation between the recorded and predicted genetic-entry mean value from the progeny data for the logit-transformed survival and ln-transformed height (d) is shown in Fig. 5. Furthermore, the data is divided into latitude classes and the mean and standard deviation for each class is given (Fig. 5).
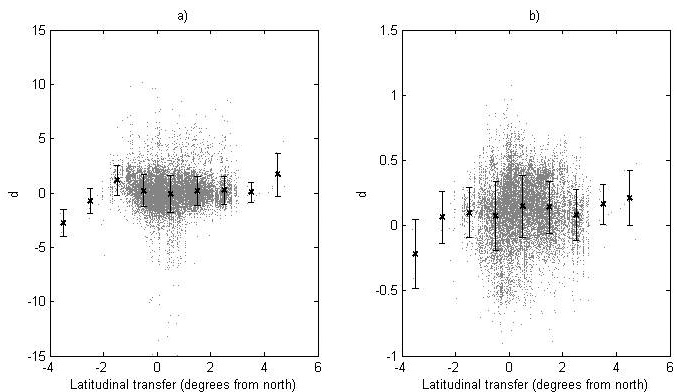
Fig. 5. The deviation, d, between the recorded value and the predicted value of (a) the logit transformed survival and (b) the ln-transformed height for the genetic entries in the progeny data. For each latitude class the mean value (black cross) and standard deviation (bars) are given.
The model performance was tested by comparing assessed heights and survival levels for progenies with predicted values from the model using the deviation (d). Using linear and quadratic regression to model d as functions of latitudinal transfer, we investigated if there were systematic structures showing differences in reaction patterns between modeling data and progeny data. No regression model explained more than 1.9% of the variation for either height or survival (data not shown) and no clear trends could be seen, indicating negligible differences in reaction patterns between modeling data and progeny data. For survival, no clear difference in the total level of survival could be found, whilst the recorded heights were in general somewhat greater than the predicted ones.
4 Discussion
4.1 Characteristics of the transfer effect models and comparison to earlier studies
The models developed in this study share the same general features as previous models of transfer effects for Scots pine in Sweden (Persson and Ståhl 1993; Persson 1994; Andersson et al. 2007). All models show an increase in height growth with transfer to the north but the models differ slightly in optimum transfer distance and the size of the increased height growth. Furthermore, survival increases with transfer to the south and decreases with transfer to the north in all models. All show that the increase in survival with transfer to the south is greater at harsher sites than at milder ones. A slight difference can be seen in the optimum of transfer to the south. In our model, the optimum southward transfer was approximately 2° at milder sites and 3° at harsher sites. In the model developed by Andersson et al. (2007), there is no optimum within the 4° transfer, but survival keeps increasing as the material is transferred further south. The model by Persson (1994) behaves in a similar way to that of Andersson et al. (2007), except for the mildest sites (temperature sum 1250 DD) where the optimum transfer to the south is similar to our model, around 2°. These differences in optima are probably due to the different datasets used in the respective studies, but compared to those with the most overlapping and comprehensive data the differences are small.
A direct comparison with earlier Finnish results is difficult due to a lack of explicit transfer models. Earlier experiences concerning provenance transfers in southern Finland can be summarized either as favoring the use of local seed sources or favoring material transferred a maximum of 200 km from the south (Heikinheimo 1949; Sarvas 1960; Koski 1989). In northern Finland, a transfer of 2.5° from the north resulted in maximum survival, and 1.5° transfer produced maximum height sum (not very different to the local value) (Mononen 1987). These results are roughly compatible with the results of our models. The practical seed transfer rules in Finland have, to date, been on the conservative side and favored the use of local seed sources (Tapio 2006).
The key factor describing the site (i.e., performance of local, unimproved material) in our models for both height and survival was temperature sum. For Scots pine in Sweden and Finland, temperature sum is well correlated with forest yield (Beuker 1994; Morén and Perttu 1994; Persson and Beuker 1997) and has been used as a key site descriptor in previous transfer-effect models (Persson and Ståhl 1993; Persson 1994; Andersson et al. 2007). Due to the large heterogeneity in both time and space of the field data used, age of assessment (cf. Andersson et al. 2007) and year of establishment were included in the height model to describe site performance. Assessment ages in the field trials varied from 8 to 35 years, under a wide variety of climatic conditions and, hence, this factor is used to account for the different growth phases of the trees. For survival, the effects of different developmental stages were instead captured by predicting the survival rate when a height of 2.5 m was reached. In a study using data from the Swedish National Forestry Inventory, Elfving and Tegnhammar (1996) found an increase in growth in both Scots pine and Norway spruce (Picea abies L. Karst.) during the time period 1953–1992 and attributed this to changes in silvicultural regimes, land use and improved regeneration methods, rather than the effects of climate change. Our main provenance data largely overlap the time period considered by Elfving and Tegnhammar (1996), but also span a later period, and we used climate data for 1961–2007 to represent current climate. Thus, establishment year may, besides the factors described by Elfving and Tegnhammar (1996), contain effects of climate change. For temperature sum, the average increase between 1961–1990 and 1988–2007 was only between 36 and 40 DD, and very small compared to the projected changes by 2050 (290–322 DD) (Bärring et al. 2016).
The significant interaction terms for both survival and growth models indicate that the reaction patterns of the provenances differ depending on a combination of climatic and photoperiodic conditions at the site as well as the transfer distance in terms of latitude (i.e. also, indirectly, the conditions at the origin of the provenance). Having an interaction term that simultaneously includes both site and provenance origin confers dynamic properties on the transfer functions and is considered crucial when developing a model structure for predicting performance of an arbitrary seed source at an arbitrary site (population and site specific reaction patterns) (cf. Wang et al. 2010; Leites et al. 2012a). The combination of the model terms (along with the non-linear properties of the functions in the re-transformed scale) entails climate adaptive properties of the transfer effect models. Thus, by changing temperature sum to correspond to future climatic conditions, the models can predict new reaction patterns and performance of height and survival.
4.2 Comparison between Sweden and Finland
One alternative model we investigated in detail used transfer in temperature sum instead of transfer in latitude. Previous studies and recommendations for Sweden advocated transfer in latitude (Persson and Ståhl 1993; Persson 1994), whereas temperature sum has been used in Finland (Tapio 2006). Temperature sum and latitude are closely correlated in Finland (Mikola 1982) and recommendations made with respect to one variable could therefore be transformed to the other, whereas the relationship between the two variables is more complex in Sweden (Bärring et al. 2016). We tested a set of models for both height and survival, including different site and interaction terms, using temperature sum as the main transfer effect both for the entire data set and separately for the individual countries, but none of those models was as good as the models presented here, based on their AICC-values.
The interaction between country (δ) and the transfer effects (ΔLAT, ΔLAT2) revealed significant effects for both height and survival, indicating a difference between the countries, although replacing country with other interaction terms we found that altitude for the survival model and temperature sum for the height model gave better AICC-values. The combined results from the model-development analyses lead us to consider that the transfer effect models for height and survival are, indeed, valid for both countries.
For the survival transfer effect model, we did not succeed in finding biological variables that would replace the strong effect of country for estimating non-transferred (local) survival. In the modeling data, Finnish trees exhibited, on average, 11% lower survival than those in Swedish (Table 2) and, with no transfer, there was 15% lower survival in Finland than in Sweden for the three common representative sites according to our model (Fig. 4). We considered three possible reasons for this difference: (i) there is a difference in performance and adaptation between the Swedish and Finnish populations of Scots pine; (ii) we are lacking one or several crucial site and/or climatic variables to model this difference; and (iii) there is a technical difference between Finnish and Swedish trials (e.g., soil preparation, scarification, plant material, trial design, establishment quality, planting spots, weed control, etc.) not described in our set of variables.
We find the first suggestion unlikely for a number of reasons. First, Savolainen et al. (2011) showed in a recent study that there was no evidence for adaptive differences between Scots pine populations in Sweden and Finland, and they are therefore expected to react similarly to a given set of climatic and photoperiodic conditions. Second, freezing tests including both Swedish and Finnish material show that Finnish material is equally or even more hardy than Swedish material from the same latitudinal origin (e.g., Andersson (1990) and unpublished studies). Third, genetic entries from one country present in field trials in the other country (49 entries spread over 19 trials) did not show any differences in performance compared to domestic entries. Fourth, at Finnish sites with similar geographic and climatic conditions compared to Swedish sites, where there is lower survival but no discernible difference in growth, the surviving trees could, hypothetically, also be selected for superior growth; that is, a possible population difference in height between Swedish and Finnish material could be concealed by selection effects. We tested this hypothesis by including survival and its interaction with country in the height model, but found no evidence suggesting any selection effects.
Regarding the second possible reason, one variable missing from our model is a measure of soil fertility, since we found it very difficult to standardize information from both countries and different time periods to provide something generally quantifiable to be used in a model. If soil fertility is indeed a main contributor to the difference in survival, we should also have seen an effect of country for the height model, but we did not. Freezing tests of Swedish, Finnish and Russian seedlings in nurseries have shown that seeds from a more continental climate are generally hardier than those from the same latitude with a more maritime climate (Andersson 1990; Andersson and Fedorkov 2004). In this study, however, the variable describing continentality (ContInd) did not improve model behavior and, thus, did not explain the difference in survival.
We believe that technical and organizational differences are the most likely reasons for the different levels of survival. In Sweden, the same research organization was responsible for designing, establishing and managing the field trials, whereas in Finland the trial design was undertaken by one research organization, but the provision of plants, establishment and early management of the trials was handled by and outsourced to another organization (State Forest Service). The Finnish trials were probably not monitored and managed in the same intensive way as those in Sweden, but rather more like ordinary forest plantations. To investigate this idea, we compared survival data from practical plantations of 216 fixed plots spanning latitudes 63.4–67°N in northern Sweden (Ackzell et al. 1994) with local (with origin ± 0.5° of latitude from the planting site) check-lots from the field trials spanning the same latitudinal range in our study. Although this comparison is not straightforward and is somewhat crude, it indicated that the survival levels in the Swedish field trials are higher than in operational plantations, with a magnitude similar to the country differences. This supports the idea of technical differences as a main factor affecting survival.
4.3 Selection of field data
In this study, we opted to use as many sources of information about reaction patterns as possible. This implied an analysis of a multitude of trial series with different design features and genetic entries. Most studies on transfer effects or reaction patterns have focused on a single trial series or a set of trial series with very similar design (Wang et al 2010; Kapeller et al. 2012; Farjat et al. 2015). Such an approach allows for including trial design features directly in the modeling step and more advanced statistical modeling (cf. Leites et al. 2012a,b). As the aim of our study was to develop transfer effect model valid for both Sweden and Finland, we decided to use trial series with diverse designs for a number of reasons. First, there were several different provenance trial series established in Sweden and Finland, with varying geographic (and thus climatic) coverage. Second, many progeny trial series in Sweden and Finland contained stand-seed check-lots with transfer effect information. Third, as no trial series (provenance or progeny) had parallel trials in both countries, inclusion of genetic entries tested across the border were important and these were found in both provenance and progeny trials. Finally, most provenance trials were established earlier than the progeny trials used here, so including progeny trials means accessing new performance data from a more recent time period.
4.4 Model performance for improved material
Using the progeny data to test model performance, we found only minor deviations between predicted and recorded values with regard to transfer effects. This implies that the models developed here (using unimproved seed sources) are also valid for phenotypically selected plus trees. This agrees with studies comparing improved and unimproved Scots pine in northern Sweden, where transfer effects for the two categories only differed marginally (Andersson et al. 2003; Andersson et al. 2007). Similar observations were also made by O’Neill et al. (2014), who suggested that the seed transfer guidelines developed for unimproved material of Douglas-fir and interior spruce (Picea glauca (Moench) Voss P. engelmannii Parry ex Englem. complex) in British Columbia could also be used for improved material.
The survival level at zero transfer for the progeny was predicted well by the model, suggesting only marginal differences in survival between phenotypically selected plus-trees and unselected local material and corresponding well to previous results (Andersson et al. 2007). The level of difference between recorded and predicted value for height at zero transfer was around 8%, which is reasonable considering the structure of the progeny data (Rosvall et al. 2001). There was a mix of both open-pollinated and control-pollinated progeny from phenotypically selected plus-trees, which means that the level of genetic gain is not homogenous. In addition, only a subset of the trials used in the testing of model performance overlapped with the modeling data.
4.5 Use and implementation of the new transfer effect models
The transfer effect models developed here are the first step in an endeavor to develop joint Scots pine deployment recommendations and seed-zone delineations in Sweden and Finland. For this to be achievable, the models need to be valid for both countries, include climate adaptive properties and be able to predict performance of contemporary seed orchards. This study suggests that the models developed, indeed have these desired properties.
In the current Swedish deployment recommendations of FRM (both provenances and seed orchard crops), a production index is calculated from the product of estimated survival projected to 2.5 m height (in current climatic conditions) and height projected to age 30 (in mid-century climatic conditions) adjusted with a function taking patchiness of mortality into account (Berlin et al. 2009a,b) to estimate per hectare volume production over a rotation (Berlin et al. 2014). The production index includes a trade-off between survival during the establishment phase and utilization of the increased growth potential in a future warmer climate (Berlin et al. 2014).
We suggest that the new transfer effect models should be implemented for both countries in the model structure described above. In this case, climate-adapted transfer rules can be calculated by using estimates of survival in the current climate and growth in a future climate. Such deployment recommendations would be a major accomplishment and could increase the exchange of FRM between the two countries. In addition, the performance of a given seed lot can be predicted for any scenario of changed future climate. We intend to analyze the effects of climate change on the performance and deployment recommendations of practical FRM in a forthcoming study.
Acknowledgements
The Skogforsk part of this study was funded by the Swedish Association of Forest Tree Breeding, Future Forests and the EU FP7 Noveltree project. The SMHI part of this project was funded by the Swedish Mistra-SWECIA program funded by Mistra (the Foundation for Strategic Environmental Research). All funding agencies are gratefully acknowledged. The Finnish Meteorological Institute kindly provided the climate data for the 10 × 10 km grids. The authors would also like to thank Sara Abrahamsson for assisting in the data compilation, Dag Lindgren, Bengt Persson, Björn Elfving, Urban Nilsson, Egbert Beuker, Jari Hynynen and Risto Ojansuu for helpful comments and suggestions during the model development and Tim Mullin for assisting in the final stages of the manuscript completion.
References
Ackzell L., Elfving B., Lindgren D. (1994). Occurrence of naturally regenerated and planted main crop plantations in boreal Sweden. Forest Ecology and Management 65(2–3): 103–115. http://dx.doi.org/10.1016/0378-1127(94)90162-7.
Akaike H. (1973). Information theory and an extension of the maximum likelihood principle. In: Petrov B.N., Csàki F. (eds). Second international symposium on inference theory, Budapest, Akadèmiai Kiadó: 267–281.
Andersson B. (1990). Härdighetsjämförelse med frystester av nordligt finskt och svenskt beståndsmaterial av tall (Pinus sylvestris L.). [Comparison of hardiness with freezing tests of northern Finnish and Swedish material from natural stands of Scots pine (Pinus sylvestris L.)]. Rapport nr. 16. Institutet för Skogsförbättring, Uppsala.
Andersson B., Elfving B., Ericsson T., Persson T., Gregorsson B. (2003). Performance of improved Pinus sylvestris in northern Sweden. Scandinavian Journal of Forest Research 18(3): 199–206. http://dx.doi.org/10.1080/02827581.2003.9728290.
Andersson B., Elfving B., Persson T., Ericsson T., Kroon J. (2007). Characteristics and development of improved Pinus sylvestris in northern Sweden. Canadian Journal of Forest Research 37(1): 84–92. http://dx.doi.org/10.1139/x06-224.
Andersson B., Fedorkov A. (2004). Longitudinal differences in Scots pine frost hardiness. Silvae Genetica 52(2): 76–80.
Bärring L., Berlin M., Andersson Gull B. (2016). Tailored climate indices for climate-proofing operational forestry applications in Sweden and Finland. International Journal of Climatology. http://dx.doi.org/10.1002/joc.4691.
Baskerville G.L. (1972). Use of logarithmic regression in the estimation of plant biomass. Canadian Journal of Forestry 49(2): 49–53. http://dx.doi.org/10.1139/x72-009.
Bergh J., Freeman M., Sigurdsson B., Kellomäki S., Laitinen K., Niinistö S., Peltola H., Linder S. (2003). Modelling the short-term effects of climate change on the productivity of selected tree species in Nordic countries. Forest Ecology and Management 183(1–3): 327–340. http://dx.doi.org/10.1016/S0378-1127(03)00117-8.
Bergh J., Nilsson U., Kjartansson B., Karlsson M. (2010). Impact of climate change on the productivity of Silver birch, Norway spruce and Scots pine stands in Sweden with economic implications for timber production. Ecological Bulletins 53(15): 185–195.
Berlin M., Danell Ö., Jansson G., Andersson B., Elfving B., Ericsson T. (2009a). A model to estimate economic weight of tree survival relative to volume production taking patchiness into account. Scandinavian Journal of Forest Research 24(4): 278–287. http://dx.doi.org/10.1080/02827580903117388.
Berlin M., Jansson G., Danell Ö., Andersson B., Elfving B., Ericsson T. (2009b). Economic weight of tree survival relative to volume production in tree breeding: a case study with Pinus sylvestris in northern Sweden. Scandinavian Journal of Forest Research 24(4): 288–297. http://dx.doi.org/10.1080/02827580903117396.
Berlin M., Ericsson T., Andersson Gull B. (2014). Plantval - manual med implementeringsteknisk bakgrund. [Plantval - manual and background to technical implementation]. Arbetsrapport nr. 851. Skogforsk. 58 p.
Beuker E. (1994). Long-term effects of temperature on the wood production of Pinus sylvestris L. and Picea abies (L.) Karst. in old provenance experiments. Scandinavian Journal of Forest Research 9(1–4): 34–45. http://dx.doi.org/10.1080/02827589409382810.
Carter K.K. (1996). Provenance tests as indicators of growth response to climate change in 10 north temperate tree species. Canadian Journal of Forest Research 26(6): 1089–1095. http://dx.doi.org/10.1139/x26-120.
Eiche V. (1966). Cold damage and plant mortality in experimental provenance plantations with Scots pine in northern Sweden. Studia Forestalia Suecica 36. 219 p.
Elfving B., Tegnhammar L. (1996). Trends of tree growth in Swedish forests 1953–1992: an analysis based on sample trees from the National Forest Inventory. Scandinavian Journal of Forest Research 11(1–4): 26–37. http://dx.doi.org/10.1080/02827589609382909.
Eriksson G., Andersson S., Eiche V., Ifver J., Persson A. (1980). Severity index and transfer effects on survival and volume production of Pinus sylvestris in northern Sweden. Studia Forestalia Suecica 156. 32 p.
Farjat A.E., Isik F., Reich B.J., Whetten R.W., McKeand S.E. (2015). Modeling climate change effects on the height growth of loblolly pine. Forest Science 61(4): 703–715. http://dx.doi.org/10.5849/forsci.14-075.
Heikinheimo O. (1949). Tuloksia kuusen ja männyn maantieteellisillä roduilla suoritetuista kokeista. [Results on experiments on the geographical races of spruce and pine]. Communications Instituti Forestalis Fenniae 37. 44 p.
Hurvich C.M., Tsai, C–L. (1989). Regression and times series model selection in small samples. Biometrika 76(2): 297–307. http://dx.doi.org/10.1093/biomet/76.2.297.
IPCC (2014). Climate change 2014: synthesis report. Contribution of working groups I, II and III to the fifth assessment report of the intergovernmental panel on climate change. Core Writing Team. R.K. Pachauri, L.A. Meyer (eds.). IPCC, Geneva, Switzerland.
Kapeller S., Lexer M.J., Geburek T., Hiebl J., Schueler S. (2012). Intraspecific variation in climate response of Norway spruce in the eastern Alpine range: selecting appropriate provenances for future climate. Forest Ecology and Management 271: 46–57. http://dx.doi.org/10.1016/j.foreco.2012.01.039.
Kjellström E., Abrahamsson R., Boberg P., Jernbäcker E., Karlberg M., Morel J., Sjöström Å. (2014). Uppdatering av det klimatvetenskapliga kunskapsläget. [An update of the existing knowledge in climatology]. Klimatologi nr. 9. SMHI, Norrköping. 66 p.
Koski V. (1989). Siemensiirrot ja ilmastoon sopeutuminen. [Seed transfers and adaptation to climate]. Metsäntutkimuslaitoksen tiedonantoja 328: 20–37.
Lee C.Y. (1982). Comparison of two correction methods for the bias due to the logarithmic transformation in the estimation of biomass. Canadian Journal of Forest Research 12(2): 326–331. http://dx.doi.org/10.1139/x82-047.
Leites L.P., Robinson A.P., Rehfeldt G.E., Marshall J.D., Crookston N.L. (2012a). Height-growth response to climatic changes differs among populations of Douglas-fir: a novel analysis of historic data. Ecological Applications 22(1): 154–165. http://dx.doi.org/10.1890/11-0150.1.
Leites L.P., Rehfeldt G.E., Robinson A.P., Crookston N.L., Jaquish B. (2012b). Possibilities and limitations of using historic provenance tests to infer forest species growth responses to climate change. Natural Resource Modeling 25(3): 409–433. http://dx.doi.org/10.1111/j.1939-7445.2012.00129.x.
Mikola J. (1982). Bud-set and phenology as an indicator of climatic adaptation of Scots pine in Finland. Silva Fennica 16(2): 178–184. http://doi.org/10.14214/sf.a15075.
Mononen S. (1987). Männynsiemenen siirrot Pohjois-Suomessa. [Scots pine transfer functions in Northern Finland]. Metsäntutkimuslaitoksen tiedonantoja 278: 80–91.
Morén A.S., Perttu K.L. (1994). Regional temperature and radiation indices and their adjustment to horizontal and inclined forest land. Studia Forestalia Suecica 194. 19 p.
O’Neill G.A., Hamann A., Wang T. (2008). Accounting for population variation improves estimates of the impact of climate change on species growth and distribution. Journal of Applied Ecology 45(4): 1040–1049. http://dx.doi.org/10.1111/j.1365-2664.2008.01472.x.
O’Neill G.A., Stoehr M., Jaquish B. (2014). Quantifying safe seed transfer distance and impacts of tree breeding on adaptation. Forest Ecology and Management 328: 122–130. http://dx.doi.org/ 10.1016/j.foreco.2014.05.039.
Odin H., Eriksson B., and Perttu K. (1983). Temperaturklimatkartor för svenskt skogsbruk. [Temperature climate maps for Swedish forestry]. Rapporter i skogsekologi och skoglig marklära 45. Institutionen för skoglig marklära, SLU, Uppsala. 57 p.
Persson B. (1994). Effects of provenance transfer on survival in nine experimental series with Pinus sylvestris (L.) in northern Sweden. Scandinavian Journal of Forest Research 9(1–4): 275–287. http://dx.doi.org/10.1080/02827589409382841.
Persson B. (1998). Will climate change affect the optimal choice of Pinus sylvestris provenances? Silva Fennica 32(2): 121–128. http://dx.doi.org/10.14214/sf.690.
Persson B., Beuker E. (1997). Distinguishing between the effects of changes in temperature and light climate using provenance trials with Pinus sylvestris in Sweden. Canadian Journal of Forest Research 27(4): 572–579. http://dx.doi.org/10.1139/x96-222.
Persson B., Ståhl E.G. (1993). Effects of provenance transfers in an experimental series of Scots pine (Pinus sylvestris L.) in northern Sweden. Swedish University of Agricultural Sciences, Department of Forest Yield Research. Report 35. 92 p. ISSN 034-7636. [In Swedish with English summary].
Rehfeldt G.E., Tchebakova N.M., Barnhardt L.K. (1999). Efficacy of climate transfer functions: introduction of Eurasian populations of Larix into Alberta. Canadian Journal of Forest Research 29: 1660–1668. http://dx.doi.org/10.1139/x99-143.
Rehfeldt G.E., Tchebakova N.M., Parfenova Y.I., Wykoff W.R., Kuzmina N.A., Milyutin L.I. (2002). Intraspecific responses to climate in Pinus sylvestris. Global Change Biology 8(9): 912–929.
Rosvall O., Jansson G., Andersson B., Ericsson T., Karlsson B., Sonesson J., Stener L.–G. (2001). Genetic gain from present and future seed orchards and clone mixes. Skogforsk, Redogörelse nr. 1. 41 p. http://dx.doi.org/10.1046/j.1365-2486.2002.00516.x.
Sarvas R. (1960). Metsänviljelyksessä käytetyn siemenen kotipaikan etäisyys viljelypaikasta. [The distance of the provenance of seed used in forest cultivation from the place of cultivation]. Metsätaloudellinen Aikakauslehti 77: 217–220.
Savolainen O., Kujala S.T., Sokol C., Pyhäjärvi T., Avia K., Knurr T., Kärkkäinen K., Hicks S. (2011). Adaptive potential of northernmost tree populations to climate change, with emphasis on Scots pine (Pinus sylvestris L.). Journal of Heredity 102(5): 526–536. http://dx.doi.org/10.1093/jhered/esr056.
Schmidtling R.C. (1994). Use of provenance tests to predict response to climatic change: loblolly pine and Norway spruce. Tree Physiology 14: 805–817. http://dx.doi.org/10.1093/treephys/14.7-8-9.805.
Tapio (2006). Hyvän metsänhoidon suositukset. [Guidelines for good silviculture]. Metsätalouden kehittämiskeskus Tapio. Metsäkustannus. 100 p.
Thomson A.M., Parker W.H. (2008). Boreal forest provenance tests to predict optimal growth and response to climate change. 1. Jack pine. Canadian Journal of Forest Research 38(1): 157–170. http://dx.doi.org/10.1139/X07-122.
Thomson A.M., Riddell C.L., Parker W.H. (2009). Boreal forest provenance tests to predict optimal growth and response to climate change: 2. Black spruce. Canadian Journal of Forest Research 39(1): 143–153. http://dx.doi.org/10.1139/X08-167.
Wang T., Hamann A., Yanchuk A., O’Neill G.A., Aitken S.N. (2006). Use of response functions in selecting lodgepole pine populations for future climates. Global Change Biology 12(12): 2404–2416. http://dx.doi.org/10.1111/j.1365-2486.2006.01271.x.
Wang T., O’Neill G.A., Aitken S.N. (2010). Integrating environmental and genetic effects to predict responses of tree populations to climate. Ecological Applications 20(1): 153–163. http://dx.doi.org/10.1890/08-2257.1.
Total of 49 references.
