Raul Fernandez-Lacruz  ,
Fulvio Di Fulvio,
Dan Bergström
,
Fulvio Di Fulvio,
Dan Bergström
Productivity and profitability of harvesting power line corridors for bioenergy
Fernandez-Lacruz R., Di Fulvio F., Bergström D. (2013). Productivity and profitability of harvesting power line corridors for bioenergy. Silva Fennica vol. 47 no. 1 article id 904. https://doi.org/10.14214/sf.904
Abstract
Trees growing under the wires and around the pylons carrying power lines (PL) represent a significant threat to the power supply because they can cause power outages and damage. The vegetation in these PL corridors is cleared motor-manually on a regular basis, which represents about 50% of the PL maintenance costs. In Sweden, PL corridors account for 140 000 ha of productive forest land, with an estimated bioenergy potential of 3 TWh/year. The aim of this study was to measure the productivity of a harvester (with an accumulating felling head) and a forwarder, performing PL corridor clearing (with the collection of whole trees for energy use) and to calculate how the cost and economic profitability is dependent on tree height, biomass removal, harvested area, forwarding distance and wood fuel price. The study also compared the economic profitability of the mechanized harvesting system with motor-manual clearing. Experimental units were inventoried along a PL corridor in central Sweden and a time study of one harvester and one forwarder (with a single operator per machine), working in those units, was carried out. The results showed that if the tree height was greater than about 6 m, the mechanized harvesting system became a more cost-efficient alternative, when compared to motor-manual clearing, but it was also found that mechanized clearing is not always the most cost-effective option. Nevertheless, mechanization of PL clearing has a huge potential for expansion, requiring further research in the combined management of the PL corridors and side areas.
Keywords
accumulating felling head;
clearing;
maintenance;
motor-manual;
power grid;
wood fuel
-
Fernandez-Lacruz,
Department of Forest Biomaterials and Technology, Swedish University of Agricultural Sciences, SE-901 83 Umeå, Sweden
E-mail
raul.fernandez@slu.se
- Di Fulvio, Department of Forest Biomaterials and Technology, Swedish University of Agricultural Sciences, SE-901 83 Umeå, Sweden E-mail fulvio.di.fulvio@slu.se
- Bergström, Department of Forest Biomaterials and Technology, Swedish University of Agricultural Sciences, SE-901 83 Umeå, Sweden E-mail dan.bergstrom@slu.se
Received 12 October 2012 Accepted 7 February 2013 Published 11 June 2013
Views 173349
Available at https://doi.org/10.14214/sf.904 | Download PDF

1 Introduction
1.1 Background
Trees growing under the wires and around the pylons of power lines (PL) represent a significant threat to the power supply, because they can cause power outages, line damage and fires as well as pose a risk to people’s safety (Government of South… 2011, E.ON Elnät… 2012, Svenska Kraftnät 2012a). To avoid trees growing over the vegetation-free zone around the wires, at a distance of 2.5 m and 3.5 m for the national grid (220 and 400 kV, respectively) (Svenska Kraftnät 2003, 2011), the vegetation growing in the PL corridors is cleared on a regular basis, usually every 8 years in south Sweden, or 12 years in the northern areas of the country (Svenska Kraftnät 2003). By taking into account the location in Sweden (which, in turn, determines the vegetative period) and the site fertility, the frequency of clearing is adjusted. The time between clearances has been reduced from 8 to 4 years for the regional and local grids that are more susceptible to storms (Swedish Energy Agency 2004). The distance from the ground to the wires between two pylons is approximately 10 m to 25 m (Larsson 1998) and this will also restrict the maximum tree height. When the PL is erected, the landowner receives a one-time payment for the “forever-lost” forest production in the land and another, later on, if dangerous trees on the side areas need to be felled (Larsson 1998). The biomass cleared from under PLs is currently only used to a limited degree; the biomass is normally just left on the ground. However, some of the areas under PLs could be suitable for conventional forestry, since there is no risk that trees could reach the wires.
In Sweden, 140 000 ha of productive forest land lie within PL corridors wider than 5 m (Statens energiverk 1989). 13 000 ha are annually cleared motor-manually with brush saws (Larsson 1998), representing around 50% of the maintenance costs of the PL (Vattenfall 1986). The work is carried out by the same professionals who carry out selective pre-commercial thinning (PCT) in conventional forestry. The productivity of motor-manual cleaning of PL areas, as with PCT operations, depends mostly on ground conditions, the density of stems and the height of trees. Attempts to mechanize the motor-manual PL corridor clearing/PCT work have been made in the past, but the different machines tested have shown a low cost-efficiency (high operational costs). One of the possible reasons for the low implementation of mechanization is that the development of the hourly cost (price) of forest contractors performing motor-manual corridor clearing has been relatively stable over the past few decades (Eriksson 1992).
In Sweden, the use of bioenergy in 2011 reached 120 TWh, representing 32% of the total energy usage (Svebio 2011). Wood fuels accounted for 28 TWh, which is 56% of the total input into district heating (Swedish Forest Agency 2012). A major source of these wood fuels are residues from industrial processes, such as black liquor, bark and sawdust, and are currently fully utilized in Sweden so their use cannot increase in the near future. In order to satisfy the increasing demand for wood fuels and fulfil the EU 20-20-20 renewable energy targets (European Commission 2008), new unexploited sources of primary energy wood, from both conventional forestry (e.g. stumps, small diameter trees) and set-aside areas, such as forest roadsides, field margins and PL corridors, must be taken into consideration. The national grid uses the highest voltage of all the Swedish grids, has a total length of overhead power lines of 15 000 km (Svenska Kraftnät 2012b) and a corridor width of 40–50 m. The regional (40–130 kV) and local grids (< 40 kV) have a corridor width ranging from 4 m to 40 m. PL corridor clearing is an unexploited biomass resource (Framstad et al. 2009), with an expected harvesting potential of 3 TWh/year by 2020 in Sweden, including biomass from roadsides and field margins (Jacobsson 2005). In Finland and Norway, this potential is estimated to be 2 TWh/year and 1.5 TWh/year (Kärhä et al. 2009; Langerud et al. 2007), respectively. The potential from clearing the 400 kV grid in the central area of North Sweden (with a length of 3307 km), is estimated to be 60 GWh/year, based on a biomass density of 12 oven-dry (OD) tonnes (t) per ha and an area of 11 900 ha (Hägglund 1992).
Several studies have shown large variations in the biomass density in PL corridors (Larsson 1998); for example, in the north of Sweden, biomass densities were found to be from 2.6 to 42.5 OD t/ha, with an average diameter at breast height (DBH) from 2.3 to 5.8 cm and height from 3.2 to 6.4 m (Hägglund 1992). Studies of the mechanized harvesting of biomass in PL areas with conventional thinning harvesters and forwarders have shown that it is difficult to obtain a positive economic result if the harvesting sites are small (high frequency of machine relocation) and if the biomass density is low (Vattenfall 1982). For example, a small thinning harvester (a Mini-Bruunett with a JH felling head) was studied in such conditions and showed 30–40% higher costs than motor-manual clearing (Vattenfall 1982). In a recent study (Iwarsson Wide 2009), a profit was obtained when carrying out PL corridor clearing with forest machines directly under the power lines, with a removal of 71.7 OD t/ha, an average DBH of 9.9 cm and a height of 11.8 m; however, these conditions do not represent the typical type of stands harvested in PL cleanings, due to the relative high biomass density and large trees. Other factors influencing the harvesting costs in PL corridors include forwarding distances, safety guidance (safety rules determine the distance the crane tip must maintain from the wires), and agreements with the landowner (Vattenfall 1982).
Over the last decade, there have been important developments in the improvement of forest technology for small tree harvesting from young dense forests, particularly more efficient accumulating felling heads (AFHs) and specific working techniques leading to significant increases in the harvesting productivity in early thinnings (Bergström et al. 2010a). However, there have been no studies performed recently on small tree harvesting in PL corridors using such innovative technologies.
The aim of this study was to measure the productivity of forest machines in PL corridor clearing, collecting whole trees for energy use and to calculate the cost and economic profitability when related to tree size, biomass removal per ha, harvested area and wood fuel market price. At the same time, this study aimed to compare the clearing cost of forest machines with the costs of performing motor-manual clearing.
2 Materials and methods
2.1 Study design
The study presented in this paper was performed as outlined below:
- Units to be harvested were identified and inventoried on PL corridor sites.
- A time study of a harvester and a forwarder (with a single operator per machine), working in the inventoried units, was carried out.
- The data from the field study (inventory and time study) were used for modelling the removal of biomass and time consumption of forest machines, as a function of tree height and removal of biomass under different stand conditions.
- Based on the derived models, the operational costs of forest machines were calculated and compared to the cost of conventional motor-manual cleaning found in the literature.
2.2 Study site
The field study was carried out in May 2012, in the municipality of Knivsta (Sweden), at two sites referred to as Area A (59°41ʹN, 17°48ʹE) and Area B (59°43ʹN, 17°57ʹE), at an altitude of 36 m a.s.l. During the study, the weather conditions were sunny, with a temperature of around 25ºC. The PL to be cleared carried a voltage of 400 kV with a corridor width of 50 m (a width equivalent to the outer wires’ projection). The average distance from the wires to the ground varied from 16 m to 26 m and the pylons were spaced at 450 m intervals. In Area A, 12 study units were marked out, with dimensions 20 m long (in the direction of the PL) and 40–50 m wide, which corresponded, approximately, to the corridor width. The effective harvested area of the units was measured after forwarding using a GPS on a personal data assistant (PDA), with ArcGIS®Mobile (see Table 1). Only one study unit was harvested in Area B. A 3.2 m wide strip road, in the middle of the PL corridor, starting from the main road and, following the direction of the wires, crossed the harvesting units and was used for the forwarding of harvested biomass (see Fig. 1). Following safety guidelines (i.e. to avoid electric shock) (Svenska Kraftnät 2011), the operating height of the cranes was restricted to 4.5 m below the wires and 6 m from the sides (i.e. the crane tip and trees must remain 4.5 and 6 m away from the wires, in the vertical and horizontal plane of the wires, respectively).
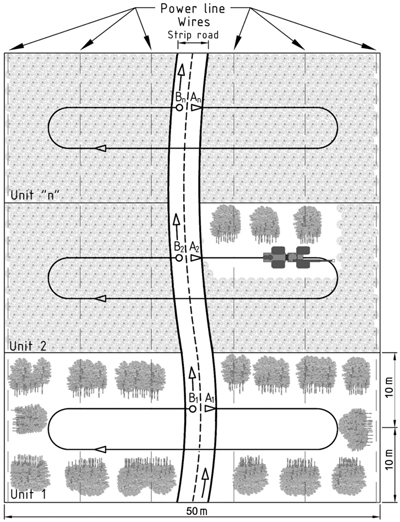
Fig. 1. Sketch of the working method of the harvester in the PL corridor (unit surface of 0.1 ha). The harvester started to work at “A1”, followed the path shown and finished when it reached the point “B1” (unit 1). The harvested moved from “B1” to “A2”, in the next unit (unit 2). The forwarder followed the same path as the harvester.
| Table 1. Main parameters of the harvesting units. | |||||||||
| Unit | Species a) % b/s/p | DBH b) (cm) | DSH b) (cm) | Height b) (m) | Density (trees/ha) | Harvested area (m2) | Harvested biomass c) (OD t) | Harvested volume d) (m3s) | Biomass removal (OD t/ha) |
| 1 | 86/12/2 | 2.7 | 4.0 | 3.7 | 15 717 | 908 | 2.52 | 5.1 | 27.8 |
| 2 | 93/7/0 | 2.3 | 3.4 | 3.5 | 30 239 | 795 | 1.64 | 3.3 | 20.6 |
| 3 | 73/24/2 | 2.3 | 3.5 | 3.4 | 20 640 | 812 | 1.85 | 3.7 | 22.8 |
| 4 | 86/11/4 | 3.1 | 4.4 | 4.0 | 14 854 | 819 | 1.90 | 3.8 | 23.2 |
| 5 | 86/14/0 | 4.7 | 6.5 | 4.9 | 15 385 | 592 | 2.16 | 4.3 | 36.5 |
| 6 | 93/7/1 | 4.7 | 6.2 | 4.7 | 15 099 | 677 | 2.17 | 4.4 | 32.1 |
| 7 | 85/15/0 | 3.1 | 4.5 | 4.0 | 13 396 | 659 | 1.51 | 3.0 | 22.9 |
| 8 | 94/6/0 | 2.5 | 3.7 | 3.8 | 15 648 | 921 | 1.76 | 3.5 | 19.1 |
| 9 | 92/8/0 | 2.4 | 3.6 | 3.7 | 15 252 | 1120 | 2.14 | 4.3 | 19.1 |
| 10 | 95/5/0 | 3.7 | 5.2 | 4.5 | 10 080 | 600 | 1.61 | 3.2 | 26.8 |
| 11 | 99/1/0 | 3.5 | 4.9 | 4.5 | 12 202 | 668 | 1.45 | 2.9 | 21.7 |
| 12 | 95/5/0 | 3.0 | 4.3 | 4.1 | 12 732 | 609 | 1.52 | 3.1 | 25.0 |
| 13 | 98/2/0 | 3.9 | 5.1 | 6.3 | 17 507 | 620 | 2.19 | 4.4 | 35.3 |
| Av. | 90/9/1 | 3.2 | 4.6 | 4.2 | 16 058 | 754 | 1.88 | 3.8 | 25.6 |
| a) b, broadleaves (mostly birch, Betula spp., and willow, Salix spp.); s, spruce (Picea abies); p, pine (Pinus sylvestris). b) DBH, diameter at breast height; DSH, diameter at stump height. The mean values are weighted by basal area. c) As weighed during the field study. d) Given the density 497 OD kg/m3s (m3s = solid cubic meters). | |||||||||
Prior to harvesting, a systematic stand inventory was carried out in each of the units, laying down 6 circular plots in each (radius = 2 m, surface = 12.6 m2). In every sample plot, the DBH of all trees with DBH ≥ 1 cm was recorded (Fig. 2). In addition, the diameter at stump height (DSH, located at around 10 cm above the ground, i.e. the estimated cutting height) and the tree height were measured for a sample of three trees per plot. The terrain conditions in each of the plots were assessed using the method described by Berg (1992), including bearing capacity (G), roughness (Y) and slope (L). The average GYL in the study area was 1.2.1., which means a good bearing capacity, a scarce slope, but with a few boulders of variable height (50–80 cm). The incidence of areas that were empty of trees and larger than 25 m2 was also measured in each of the units. After harvesting, the cutting height of the stumps was measured along a diagonal, from one corner to the opposite corner; in total, 315 stumps were measured (on average, 24 stumps per unit). The moisture content of the biomass was measured using CEN/TS (2004). For this, 10 trees (5 trees from Area A and 5 from B, respectively) were sampled. From each tree, a sample of 3 wood discs was collected from the butt, middle and top parts. The moisture content varied from 43.7 to 46.2%, averaging 44.9%.
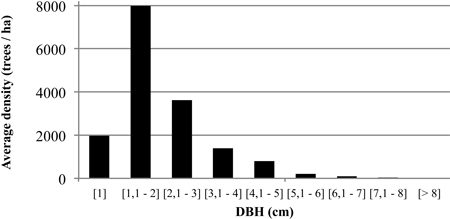
Fig. 2. Average distribution of DBH classes (cm) in the harvested units.
The harvested biomass from each of the units was forwarded to the roadside landing, one unit at a time. The forwarded load mass was weighed with an axle load scale system (Telub AB, Sweden). Based on these measurements, the removal of biomass per hectare, y (OD t/ha), was modelled as a function of the average tree height of the unit, h (m), and defined as in Eq. 1 (R2(adj) = 0.573; p = 0.0017):
y = 0.6712 + 5.8736 · h (1)
The regression analysis of biomass removal and tree heights, to derive Eq. 1, as well as the rest of regression analyses performed in this study, were carried out using Minitab™ 15 and results were considered significant if p < 0.05.
2.3 Biomass properties
In total, 43.5 fresh t (weighed) (24.4 OD t) of biomass was harvested from an area of 9800 m2. From Area A, there were 12 loads forwarded and unloaded in 2 stacks, giving bulk volumes of 167 and 169 m3 loose, respectively. From Area B, there was 1 load forwarded, giving a stacked bulk volume of 35 m3 loose. The average number of biomass piles bunched on the ground in each of the units was 14 (sd = 4), with an average pile mass of 260 fresh kg (146 OD kg). The average biomass per tree was 1.71 (sd = 0.5) OD kg. The average cutting height of the measured stumps was 22.3 cm, somewhat higher than the initially assumed cutting height (10 cm) at which we measured the DSH.
2.4 Time study
The harvester used in the study was a Skogsjan 495 (Skogsjan AB, Sweden) manufactured in 1998, with an engine power of 162 kW, a mass of 15 t, width of 2 m and four tyres (diameter 710 mm) fitted with chains. It was equipped with an 11.3 m CAT crane (Caterpillar Inc., US) able to rotate together with the cabin. The accumulating felling head (AFH) used in this study was a Bracke C16.b (Bracke Forest AB, Sweden), manufactured in 2010. The felling head is specifically designed for the early thinning of energy-wood and it has a cutting chain with rivets of 3/4’’, mounted on a saw disc of 795 mm diameter with a maximum cutting capacity of 260 mm. The head was equipped with four-jawed cutting arms and four-jawed accumulating arms. The weight of the head was 570 kg, the height 1120 mm, and the requirement of hydraulic flow 120 l/min. In similar working conditions, the driver usually changed the saw chain once a day and during this study, he used 2 chains. The harvester operator had 4 years experience, of which 2 years were spent harvesting with the Bracke C16.b felling head in young dense forests.
The forwarder was a Valmet 890.1 (Komatsu Forest AB, Sweden) manufactured in 2003, with an engine power of 154 kW, a mass of 18.4 t and load capacity of 18 t. The load bunk had a cross sectional area of 6 m2. The forwarder was equipped with 8 wheels of 650 mm, a CRF12 crane with a reach of 8.5 m (Cranab AB, Sweden) and an energy wood grapple CE360, which had a gripping area from tip to tip of 0.30 m2 (Cranab AB, Sweden). The slash grapple did not have wood blades, but had two forks with two legs per fork for effective handling of undelimbed wood and logging residues. The forwarder operator had 7 years experience of forwarding logging residues.
The harvester used the pre-existing strip road to move from the landing to each of the units (see Fig. 1). This relocation time was excluded from the time study of the harvester. The time study began when the harvester started to cut trees from point “A1”, on one side of the unit, felling a 10 m wide swath at the front part of the machine. The machine described the path shown in Fig. 1 and finished when it reached the point “B1”. After finishing the work in the unit, the harvester moved from the end point “B1” to the start point of the next unit, “A2”. This relocation time was also excluded from the time study. In most of the cases, the strip road divided the harvesting units into two areas, as shown in Fig. 1. The bunches of trees were placed on the left side of the machine, forming piles perpendicular to the working path, in such a way that the crowns of the trees were oriented outwards, towards the unit boundaries.
The forwarder followed the same path as the harvester in each of the units when loading the biomass piles. The time study in each of the units began when the forwarder started to drive unloaded from the landing directly to the harvested unit. During loading, the biomass was loaded only from the left side of the machine. When all piles in the unit were loaded, the forwarder drove back to the roadside landing, where the biomass was first weighed (Table 1) and then unloaded in two big stacks. In each of the units, one load was sufficient to complete the extraction of the whole harvested biomass.
The work time, including delays shorter than 15 minutes (WT), was recorded with an Allegro Field PC® equipped with SDI (Haglöf Sweden AB) software. The productive work time (PW) was defined in this study as the work time excluding delays. The WT of the harvester was recorded by means of a frequency study as defined by Harstela (1991), due to the repetition of short-time elements. The work element in progress was recorded once every 7 seconds, as shown in Table 2. The running time spent per study unit was recorded with a chronometer. This was recorded in order to correct the possible missing observations from the frequency measurement. The number of biomass piles produced per unit, number of trees per crane cycle and any other relevant observation (e.g. the reason for the delays) were also recorded.
| Table 2. Definition of the work elements in the harvester work cycle. | ||||
| Work element | Description | Priority a) | ||
| Boom out | Starts when an empty crane moves towards a tree to be harvested and stops when the tree has been reached. | 1 | ||
| Felling | Starts when the first tree has been reached and stops when the last tree has been felled (moving to successive trees included). | 1 | ||
| Boom in | Starts when the last tree in the crane cycle has been felled and stops when trees have been dropped on the ground (including fixing the bunch). | 2 | ||
| Moving | Starts when the base machine wheels are turning and ends when the base machine stops. | 3 | ||
| Miscellaneous | Other activities such as trees being dropped and then picked up again, bucking of long trees | 4 | ||
| Delays | Time not related to effective work time e.g. personal breaks, repairs. | 5 | ||
| a) If work elements were performed simultaneously, the element with the highest priority (lowest number) was recorded. | ||||
The time study of the forwarder was performed as a continuous time study (Harstela 1991), since the work elements had a sufficient length to be individually recorded with precision (Table 3). The total WT, the number of crane cycles during loading and unloading, the loading distances, the distances of driving unloaded and loaded (forwarding distances), the height of the load compared to the bunk stakes and the length of the load, as well as any other relevant observation (e.g. the reason for the delays) were also recorded.
| Table 3. Definition of the work elements in the forwarder work cycle. | ||||
| Work element | Description | Priority a) | ||
| Loading | Starts when the empty crane starts to move from the base position in the load bunk and stops when the crane returns to the base position and the machine starts to move to the next loading area (machine position). | 1 | ||
| Moving while loading | Starts when the base machine wheels are turning and ends when the base machine stops for loading. | 2 | ||
| Driving loaded | Starts when the base machine starts to move from the cutting area and ends when the machine stops at the landing. | 2 | ||
| Unload | Starts when the crane moves to grab the first bunch and ends when the crane returns in its base position in the loading space. | 1 | ||
| Driving unloaded | Starts when the base machine starts to move from the landing and ends when the machine stops at the cutting area. | 2 | ||
| Miscellaneous | Other activities e.g. bunches are dropped and then picked up again, load adjusting. | 3 | ||
| Delays | Time not related to effective work time e.g. personal breaks, repairs. | 4 | ||
| a) If work elements were performed simultaneously, the element with the highest priority (lowest number) was recorded. | ||||
2.5 Economic analyses
The profitability of performing PL corridor clearing with forest machines was calculated as the difference between the revenue from selling the whole unchipped trees at the roadside and the logging costs (harvester and forwarder), including the machines’ relocation cost, by modelling biomass removals as a function of the tree heights, as found in the field study.
The economic analysis was conducted for a stand size of 1 ha i.e. 50 m × 200 m. The forwarding distance was correlated to the size of the stand, by considering a constant 50 m wide section in the PL corridor. Given the size of the stand, the corresponding forwarding distance to the roadside was calculated using the following formula: forwarding distance (m) = size of the stand (m2) / 100 (m). The calculated forwarding distances are given by assuming a perfectly rectangular harvesting site, as represented in Fig. 1. If the harvesting site had a different geometry or orientation with respect to the central strip road, the forwarding distance to landing would be different. The total WT of the harvester, the forwarder and motor-manual clearing was calculated according to the relationships determined for each of the modelled stand conditions.
2.5.1 Revenues
The revenues corresponded to the market price for whole unchipped trees at the roadside. An average price of 210 SEK/m3s (solid cubic metres) was used for the calculation of the income, being the average for the Swedish wood fuel market in 2012. The biomass price per volume (m3s) was converted into a price per mass (OD t), by means of the calculated basic density of 497 OD kg/m3s, giving a value of 422 SEK/OD t. The basic density was calculated by considering the percentages in mass of stem wood, bark, branches and needles, obtained from the Swedish National Forest Inventory (2012), in an average tree with a DBH of 3 cm for each of the inventoried tree species. The OD densities for each of the components were obtained from Nylinder and Larsson (2012) and Söderström (1983). The values were averaged by weighting according to the percentages of tree species. The amount of harvested OD t in each of the modelled units was calculated using Eq. 1.
2.5.2 Costs of forest machines
The analytical calculation of the hourly operating costs of the machines returned 862 SEK/WT-hour for the harvester and 766 SEK/WT-hour for the forwarder (Table 4). The calculated costs referred to a thinning harvester (Komatsu 901TX, 150 kW) and a large-sized forwarder (Komatsu 890, 150 kW), similar to the ones used in the field study, since the original models were no longer produced. The calculation was carried out using the method defined by Nordfjell (2010). The purchase prices were obtained directly from the manufacturer and the salvage value was assumed to be 20% of the purchase price. For the calculation of the fuel costs, fuel consumption figures of 14.1 l/hour for the harvester and 12.4 l/hour for the forwarder were used with a diesel cost of 11.87 SEK/l (Europe’s Energy Portal 2012). The hourly fuel consumption of the machines was calculated using the method described by Brunberg (2006), as a function of the engine power output of the machines. The operating hours per year and driver salary are common values within the ones used by forest machine entrepreneurs in Sweden. The economic lifespan, interest rate and profit margin were assumed to be respectively 4.6 years, 6% and 5%. The fixed maintenance costs, variable maintenance costs and lubricant costs were assumed to be the same as those in the study by Jylhä et al. (2010) for similar machines, applying an exchange rate of 1 € = 9 SEK. The total cost of harvesting and forwarding was calculated by multiplying the hourly operating cost of the machines (SEK/WT-hour) by the total WT required to harvest and forward the biomass from each of the modelled units. The PW time was converted into total WT by including a 10% delay time, as this was the maximum percentage of delays found in this study. In addition to the calculated total cost, a relocation cost of 2000 SEK per machine per relocation was included.
| Table 4. Hourly operating cost of the harvester (including the accumulating felling head) and the forwarder, VAT excluded. | ||
| Harvester (including AFH) | Forwarder | |
| Economic lifespan (years) | 4.6 | 4.6 |
| Interest rate (%) | 6 | 6 |
| Purchase price (SEK) | 3 450 000 | 3 200 000 |
| Salvage value, present value (SEK) | 527 767 | 489 523 |
| Operating hours per year (WT-hours) | 2500 | 2500 |
| Fixed costs (SEK/WT-hour) | 330 | 309 |
| Capital costs (SEK/year) | 745 720 | 691 682 |
| Fixed maintenance costs (SEK/year) (insurance and administration) | 79 650 | 79 650 |
| Variable costs (SEK/WT-hour) | 491 | 421 |
| Variable maintenance costs (SEK/WT-hour) | 67 | 21 |
| Fuel costs (incl. lubricant) (SEK/WT-hour) | 174 | 150 |
| Driver salary (SEK/WT-hour) | 250 | 250 |
| Profit margin (5%) (SEK/WT-hour) | 41 | 36 |
| Operating hourly cost (SEK/WT-hour) | 862 | 766 |
2.5.3 Costs of motor-manual clearing
The cost of motor-manually clearing a PL corridor was calculated for each of the modelled units. The hourly cost of the operator with a cleaning saw was set to 300 SEK/WT-hour. The PW time of motor-manual clearing was calculated using Eq. 2 (SLA Norr 1991), a formula intended to be used for pre-commercial thinning (PCT). T denoted PW-min/ha, RA the tree density in the unit (× 103 trees/ha) and H the average tree height (m) in the unit. Since the modelled stands contained significant obstacles on the ground, giving an average GYL of 1.2.1, a time consumption of 5% was added to the model. The average tree density for each of the modelled units was calculated as a function of the average tree height, decreasing from 18 000 to 12 000 trees/ha, as the average heights of trees increased from 3.4 to 6.3 m.
T = 0.765 · ((15.08 · RA) + (9.5 · RA · H) – (0.15 · RA2 · H) + 91) (2)
The PW time was converted into total WT by including 25% delays, since in motor-manual clearing of PL corridors it’s common to assume 6 PW-hours, out of 8 WT-hours per day, discounting planning, refuelling etc. The total costs of motor-manual clearing were calculated by multiplying the hourly operating cost (SEK/WT-hour) by the total WT required to clear each of the modelled units.
2.5.4 Quality classes
The economic result was also studied by grouping harvested units in quality classes (C, B, A), using similarities in tree height/biomass removal. “Class C” was defined as an average of units 1, 2, 3, 8 and 9, defined by a tree height of 3.6 m and removal of 22.0 OD t/ha; “Class B” was defined by an average height of 4.4 m and removal of 26.5 OD t/ha, based on units 4, 5, 6, 7, 10, 11 and 12; “Class A” was defined by the value of the average height of unit 13, that is 6.3 m and removal of 37.6 OD t/ha. “Class Q” was created by defining a theoretical average tree height of 8 m and a calculated removal of 47.7 OD t/ha (Fig. 8). The size of the harvesting sites for each quality class ranged from 1 to 10 ha (i.e. forwarding distances from 100 to 1000 m).
2.5.5 Sensitivity analyses
A current price of whole unchipped trees at the roadside was chosen (210 SEK/m3s), but both regional and seasonal variations in Sweden were found, between the southern and northern part of the country and between summer and wintertime, respectively. In addition, prices were also a function of the technical and quality considerations set by the main purchasers in the market (forest owners’ associations and energy companies) and transport distances. For these reasons, when performing a sensitivity analysis, some of the possible variations in prices would need to be considered to study the effect on the profitability of the mechanized harvesting system. Accordingly, both a price increase of 10% (i.e. 231 SEK/m3s = 464 SEK/OD t) and a 10% decrease (189 SEK/m3s = 380 SEK/OD t) were considered. At the same time, a 1% increase of price (212 SEK/m3s = 426 SEK/OD t) and a 1% price decrease (208 SEK/m3s = 418 SEK/OD t) were also considered.
The effect of adding a variable distance from the unit border to the roadside landing was also included in the analyses (quality classes from C to Q with stand sizes from 1 to 10 ha). In one case, a distance to the roadside landing of 100 m was added to the forwarding distance, meaning that the total forwarding distance would be increased by 100 m for all the stands (i.e. for the stands of 3 ha, the total forwarding distance would be 400 m).
In the sensitivity analyses, the effect of longer delays on the working time of the machines was also considered, and the coefficients 1.3 and 1.2 (c.f. Laitila 2008) were applied to convert PW time to WT time for the harvester and the forwarder, respectively.
3 Results
3.1 Time study
3.1.1 Harvester work
The harvester was studied for a total WT of 14.62 hours, of which delay time accounted for 1.94% of total WT (0.28 WT-hours), giving a PW time of 14.34 PW-hours. The average time consumption per ha was 14.5 PW-hours (min. 7.90 PW-hours/ha, max. 20.15 PW-hours/ha). The average time consumption per harvested OD t was 34.98 PW-min. Felling and bunching work represented 60% of PW time (Table 5). The felling head cut and bunched an average of 13 stems (sd = 5) per crane cycle (Fig. 3), which corresponded to a handled biomass of 21 (sd = 8) OD kg/crane cycle. The average number of crane cycles per PW-hour was 92 (sd = 11), which is equivalent to 1147 (sd = 357) trees/PW-hour.
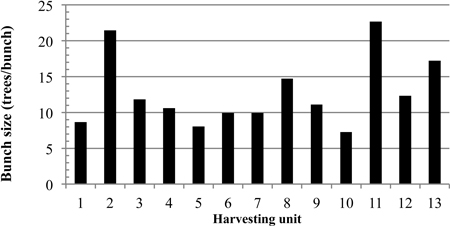
Fig. 3. Average bunch size (number of trees per bunch) in each of the harvested units.
| Table 5. Productive work time consumption (minutes) per oven-dry tonnes of the harvester (average, minimum, maximum, standard deviation and percentage), divided into the work elements (n = 13). | |||||
| Work element | Average | Min. | Max. | sd | (%) |
| Boom out | 5.80 | 2.73 | 7.83 | 1.28 | 16.6 |
| Felling | 20.88 | 11.10 | 28.56 | 6.55 | 59.7 |
| Boom in | 4.51 | 2.10 | 6.61 | 1.38 | 12.9 |
| Moving | 3.53 | 2.30 | 5.33 | 1.00 | 10.1 |
| Miscellaneous | 0.26 | 0.06 | 0.68 | 0.18 | 0.7 |
| Total time | 34.98 | 20.24 | 45.77 | 9.11 | 100.0 |
The average height of felled trees in each of the units was found to significantly affect PW time and accounted for more than 60% of its variability (Fig. 4). Accordingly, the efficiency of the harvester (PW-min/OD t) was modelled as a function of the average tree height, h (metres), as in Eq. 3 (R2(adj) = 0.617; p = 0.0009):
Total PW time (PW-min/OD t) = e5.4935 · h–1.379 (3)
As a consequence, the harvesters’ productivity increased with tree height and was, on average, 1.85 OD t/PW-hour (min. 1.31 OD t/PW-hour, max. 2.96 OD t/PW-hour, sd = 0.57 OD t/PW-hour).
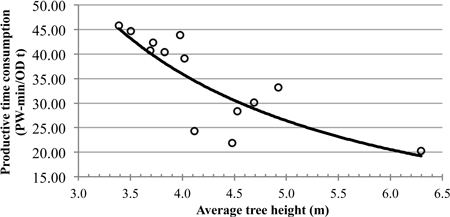
Fig. 4. Productive work time consumption per oven-dry tonne of the harvester as a function of the average tree height harvested.
3.1.2 Forwarder work
The forwarder was studied for a total of 4.73 WT-hours, of which delay time accounted for 1.3% of total WT (0.06 WT-hours), giving a PW time of 4.67 PW-hours.
Given the amount of harvested biomass in each of the units, one load per unit was sufficient to complete the extraction of the biomass. The average forwarder load contained 3.35 fresh t (1.88 OD t). A full load was only achieved in unit 1 and it corresponded to 4.48 fresh t (2.52 OD t), which represented 24.9% of the machine’s load capacity (18 t), giving a bulk volume of 32.3 m3 loose. During the loading of the piles into the forwarders’ load bunk, the average amount of biomass per grapple was 203 fresh kg (114 OD kg). During the unloading of the biomass at the landing, the average biomass per grapple was 477 fresh kg (268 OD kg).
The forwarding distance in the field study varied between 75 and 672 m and was 325 m on average. The speed whilst driving unloaded was not significantly correlated to the forwarding distance. Therefore, the “driving unloaded” PW time was modelled as a function of the forwarding distance, taking into account the average driving unloaded speed of 1.4 m/s and a full load. In the same way, the “driving loaded” PW time was modelled as a function of the forwarding distance, taking into account the average driving loaded speed of 1.1 m/s and a full load. Considering the driving distance while loading the biomass piles, it varied between 51–116 m, giving an average loading speed of 0.4 m/s. A significant linear relationship between the loading distance and the area of the units was found (p = 0.0064, R2(adj) = 0.462). Nevertheless, the regression analysis did not show a significant relationship between the “moving while loading” PW time and loading distance, either between the loading speed and loading distance. For these reasons, the average value of “moving while loading” PW time, 2.11 PW-min/OD t, was used when modelling the total PW time. Also, in the case of modelling the PW time for “unloading” and “miscellaneous”, the average values used were 1.08 and 0.51 PW-min/OD t, respectively. The “loading” PW time per OD t was modelled as a function of the removal of biomass per unit, denoted as x (OD t/ha) and defined by Eq. 4 (R2(adj) = 0.468; p = 0.0059):
Loading PW time (PW-min/OD t) = e3.6365 · x–0.7616 (4)
The total PW time of the forwarder per OD t was modelled as a function of the removal of biomass per unit, denoted as x (OD t/ha) and forwarding distance to landing, denoted as d (m) and was defined by Eq. 5:
Total PW time (PW-min/OD t) = Loading PW time (PW-min/OD t) + Moving while loading PW time (PW-min/OD t) + Unloading PW time (PW-min/OD t) + [( forwarding distance (m) / Driving unloaded speed (m/min) + (forwarding distance (m) / Driving loaded speed (m/min) ) / full load mass (OD t)] + Miscellaneous PW time (PW-min/OD t) =

Based on a forwarding distance of 100 m, a biomass removal of 25.6 OD t/ha (the average value from this study) and a full forwarding load of 2.52 OD t biomass, the distribution of the PW time was calculated (Table 6).
| Table 6. Productive work time consumption (min) per oven-dry tonne of the forwarder (average, standard deviation and percentage), divided into work elements (n = 13), given a full load and 100 m forwarding distance. | |||
| Work element | Average | sd | (%) |
| Loading | 3.21 | 0.78 | 40.3 |
| Moving while loading | 2.11 | 0.70 | 26.4 |
| Unloading | 1.08 | 0.25 | 13.6 |
| Driving unloaded | 0.48 | 1.56 | 6.0 |
| Driving loaded | 0.59 | 1.78 | 7.4 |
| Miscellaneous | 0.51 | 0.34 | 6.3 |
| Total time | 7.97 | 3.70 | 100.0 |
Using a fixed removal of biomass of 25.6 OD t/ha and increasing the forwarding distance from 100 to 600 m, the forwarders’ productivity decreased by 40% (from 7.52 to 4.51 OD t/PW-hour), as shown in Fig. 5.
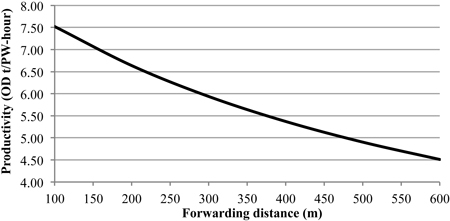
Fig. 5. Forwarding productivity given a fixed removal of biomass (25.6 OD t/ha), as a function of forwarding distance.
Given a fixed stand size of 1 ha (i.e. an average forwarding distance of 100 m) and an increased biomass removal of 83% (from 20.6 to 37.6 OD t/ha), the productivity increased by 20% (from 7.01 to 8.38 OD t/PW-hours) (Fig. 6).
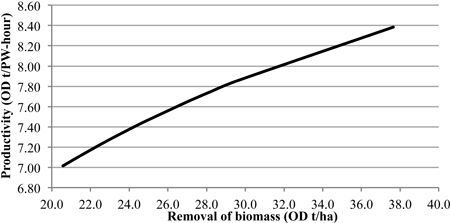
Fig. 6. Forwarding productivity as a function of the removal of biomass per ha (in turn, calculated as a function of the average tree height of the study units), given a constant forwarding distance of 100 m.
3.2 Economics
3.2.1 General results
For a stand of 1 ha, as the average height of felled trees increased from 3.4 to 6.3 m, the total logging costs per ha of the mechanized harvesting system decreased by 9%, while the costs per OD t reduced by 50% (Table 7). The costs of the harvester represented an average of 65% of the total costs per ha. This cost decreased by 22% as the height increased, while at the same time, there was a 57% reduction in the cost per OD t. The costs of the forwarder represented, on average, 16% of the total cost per ha and increased by 53% as the average height of felled trees increased, due to the greater quantity of biomass removed; however, the cost per OD t decreased by 16%. The relocation costs represented, on average, 20% of the total cost per ha. This cost per OD t decreased by 45% as tree height increased.
| Table 7. Economic result of the mechanized clearing system and motor-manual clearing, as a function of the average tree height (lowest height 3.4 m, highest 6.3 m), in a stand of 1 ha. The percentage (Δ) represents the variation between the lowest and the highest heights of trees in the modelled stands. | ||||||
| Stand types / Tree heights | ||||||
| 3.4 m | 6.3 m | 3.4 m | 6.3 m | |||
| SEK/ha | SEK/ha | Δ% | SEK/OD t | SEK/OD t | Δ% | |
| Mechanized clearing system | ||||||
| Harvester cost | 14 841 | 11 562 | –22 | 721 | 307 | –57 |
| Forwarder cost | 2499 | 3823 | +53 | 121 | 102 | –16 |
| Relocation cost | 4000 | 4000 | 0 | 194 | 106 | –45 |
| Total costs | 21 340 | 19 385 | –9 | 1037 | 515 | –50 |
| Revenues | 8692 | 15 896 | +83 | 422 | 422 | 0 |
| Net income | –12 647 | –3489 | +72 | –614 | –93 | +85 |
| Motor-manual clearing | ||||||
| Total cost | –4097 | –4681 | +14 | –199 | –124 | –38 |
The cost per ha of motor-manual clearing increased by 14%, as the average height of felled trees increased from 3.4 to 6.3 m and the average tree density decreased from 18 000 to 12 000 trees/ha (Fig. 7), while the cost per OD t decreased by 38%.
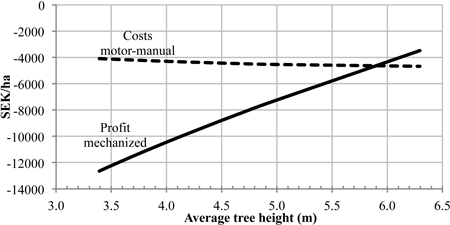
Fig. 7. Net income of the mechanized harvesting system (as a function of the average tree height, given a constant forwarding distance of 100 m) and costs of motor-manual clearing. Modelled stand size was 1 ha.
The revenues per ha for the mechanized harvesting increased by 83% with the average tree height, due to the larger quantity of biomass removed per ha. The net income per ha for the mechanized harvesting system was generally negative but it increased by 72% with the increase in the average tree height, reaching the same value as the cost of motor-manual clearing when the tree height was 5.9 m. This means that for larger stem sizes, the mechanized harvesting of the biomass was more cost efficient than the motor-manual clearing (Fig. 7).
3.2.2 Results in the quality classes
The net income of the mechanized system per harvested OD t was positive in class Q, when the size of the stand ranged between 1 and 7.2 ha and it was at a maximum at a stand size of 2.4 ha (49 SEK/OD t) (Fig. 8). The economic result of the mechanized harvesting system was negative for the rest of the classes, but, as was expected, it increased by improving the quality class (C, B, A). In class C, the economic result was maximum at a stand size of 4 ha (–445 SEK/OD t), in class B at a stand size of 3 ha (–275 SEK/OD t) and in class A at a size of 2.7 ha (–51 SEK/OD t). The economic profitability of the mechanized harvesting system was maximized when the logging costs were minimized in each of the quality classes (class C, 867 SEK/OD t; class B, 698 SEK/OD t; class A, 474 SEK/OD t; class Q, 373 SEK/OD t).
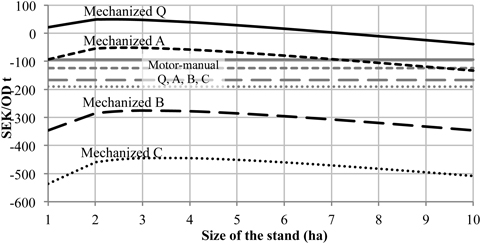
Fig. 8. Net income of the mechanized harvesting system and costs of motor-manual clearing, as a function of quality classes C, B, A and Q and the modelled size of the stands (from 1 to 10 ha).
As the class improved (from C to Q), the costs per OD t of motor-manual clearing decreased by 51%, from 190 to 94 SEK/OD t, whereas the costs per ha increased from 4180 to 4488 SEK/ha. The net income of mechanized harvesting in classes Q and A was greater than the costs of motor-manual clearing if stand sizes remained below 9 ha. For this reason, in the best stand quality classes (A, Q), the mechanized clearing system should be regarded as the most cost-efficient option.
At a minimum tree height of 5.4 m, if the stand size ranged from 2 to 4 ha, the profitability of mechanized harvesting was already greater than the costs of motor-manually clearing, with a net income ranging from –140 to –134 SEK/OD t, while the cost of motor-manual clearing at the same height was –142 SEK/OD t. This height of trees (5.4 m) is representative of the field study conditions and, therefore, we can expect that forest machines are the most economic and efficient alternative in many other PL corridor areas.
Unlike conventional forest harvesting operations, the increase in the size of the harvesting unit decreased the profitability of the mechanized harvesting system, as shown in Fig. 8. This is because in the study, the forwarding distance is connected to the size of the stand, so a bigger stand implies longer forwarding distances and higher costs, but with an insufficient increase in the revenue from harvesting larger volumes of biomass to compensate.
3.2.3 Sensitivity analyses
Considering a price increase of 10%, the economic result in classes C and B would improve by 9% and 15%, at a respective stand size of 4 and 3 ha (i.e. the stand size at which profit is maximized), but it would still be negative (–403 and –233 SEK/OD t, respectively). At the same time, the net income in class A would be –9 SEK/OD t, at a stand size of 2.7 ha, which would represent an 82% increase. In the class Q, a positive result would be found for all analysed stand sizes (from 1 to 10 ha) and the net income would increase by 85% (from 49 to 92 SEK/OD t), at a stand size of 2.4 ha. However, if a 10% decrease in wood fuel prices is considered, the net income is only positive in class Q, at stand sizes from 2 to 3 ha (i.e. it has decreased by 85%). For instance, by assuming a 1% increase of price, the increment of the profit in class C would be 1%, in class B 2%, in class A 8% and in class Q 9%, using the same stand sizes. If a 1% price decrease is considered, the profit would decrease by the same percentages as in the previous case.
If a distance from the border of the unit to the roadside landing of 100 m was included in the forwarding operation, the decrease of profit (at the maximal point of profitability) was 3% in class C, 5% in class B, 29% in class A and 31% in class Q. Considering a distance of 500 m, the reduction in profit was 17% in class C, 27% in class B, 147% in class A and 153% in class Q. However, even if the worst case is considered (i.e. a distance of 500 m), the mechanized clearing alternative would still be a more cost-efficient option than motor-manual clearing in stands of class Q smaller than 8 ha (total forwarding distance of 1300 m). However, if the variable distance is greater than 500 m, the motor-manual clearing would represent the most cost-efficient option, given the modelled stand conditions.
In the case where longer delays to the work of the machines were considered, at the maximum point of profitability, the decrease of profit was 28% in class C and 35% in class B. The decrease was 121% in class A, but still, it remained at similar levels to the costs of motor-manual clearing (–114 SEK/OD t). A positive result was only found in class Q (3 SEK/OD t), although the decrease of profit was 95%. As the sensitivity analysis showed, the effect of delay time was great, but given similar conditions as in the field study, delays were not expected to be as high as in conventional forest harvesting operations.
4 Discussion
4.1 The harvester
The productivity of the harvester was mostly affected by the height of the trees to be felled and increased with the increment in the average tree height. However, the presence of boulders and the pylons in some of the units affected harvesting productivity, since the driver had to work more carefully to avoid damaging the saw chain. In some of the units, the operator also cut trees with DBH < 1 cm, which increased the time consumption and decreased productivity, due to the low accumulation of biomass per crane cycle. Only one other recent study of mechanized harvesting in PL corridors in Sweden was found (Iwarsson Wide 2009), but the stand conditions and technologies used differed notably from our study, making a direct comparison of harvesting productivities impossible. A meaningful comparison with a study of the use of an AFH Bracke C16.a for thinning of young dense forests (Bergström et al. 2010a) was possible. In this case, a boom-corridor technique was used in a very similar way to PL corridor clearing. If the corresponding modelled DBHs of 2.3 cm, 3.4 cm and 3.7 cm, with average tree heights 3.6 m, 4.4 m and 6.3 m, respectively, are used in the boom-corridor productivity model (Bergström et al. 2010a), the productivities would be 2.17, 2.96 and 3.11 OD t/PW-hour, which, on average, are higher (27%) than the productivities found in the present study. Although the harvesting technologies were similar, the stand conditions were different. The same type and model of AFH was studied in the harvesting of short rotation willow coppice plantation, giving a time consumption of 0.36 PW-hour/OD t (productivity of 2.78 OD t/PW-hour), under normal growth conditions (biomass density 36 OD t/ha, average tree height 5.4 m and DSH 2.7 cm) (Di Fulvio et al. 2012). The modelled time consumption in our study, at an average tree height of 5.4 m, was 0.40 PW-hour/OD t (productivity of 2.53 OD t/PW-hour); this is in line with those results.
Direct comparisons with other studies of small tree harvesting become difficult, because of the different stand conditions and the cutting technology (i.e. generally bigger trees and lower tree densities in conventional forestry). Kärhä (2006) found that when the stem volume was under 5 dm3s the cutting productivity remained under 2 m3s/PW-hour (≈1 OD t/PW-hour, assuming a basic density of 497 OD kg/m3s) when using feller-bunchers and roller-fed harvester heads. In our study, the average stem volume ranged between 1.4–5.3 dm3s and the productivity 2.64–5.96 m3s/PW-hour, which is significantly higher. This can be mainly explained by the fact that an accumulating felling head was used in our study and it performed a clear-cut, in stands with a much higher tree density (between 10 000–30 000 trees/ha) than in the studies of Kärhä (2006).
The harvesting technology used in this study was originally designed for thinning in conventional forestry. Clearly, new machines and working methods should be developed specifically for use in PL corridors, such as felling heads coupled with chipper-harvesters as tested for PCT (Vattenfall 1992), chip-harvesters (as a single machine system) equipped with AFH and chipper with a container, or as a two machine system, by including a bin-forwarder (Talbot and Suadicani 2005). As in PL corridor clearing, rather than the quality, only the quantity of biomass harvested is important, other technologies specifically designed for bulk harvesting should be considered, such as the FECON®Bio-Harvester™ which is actually used in the US for removing biomass from areas with a high wildfire risk. This biomass harvester is able to cut, chip and haul small trees at the same time, reaching a maximum productivity of 8.98 fresh t/PW-hour (4.94 OD t/PW-hour at 45% MC), when the biomass removal in the stand was 45.1 fresh t/ha (24.8 OD t/ha at 45% MC) (Catts et al. 2011).
4.2 The forwarder
The productivity of the forwarder increased with the removal of biomass per ha. Assuming a forwarding distance of 250 m and tree height of 5.4 m (biomass removal of 32.4 OD t/ha), the modelled productivity was 6.6 OD t/PW-hour (time consumption 4.9 PW-hours/ha). Compared to the value calculated by Di Fulvio et al. (2012) of 7.2 OD t/PW-hour (5.0 PW-hours/ha), the modelled productivity was slightly lower (9%). Laitila (2008) has shown that when a removal of biomass of 60 m3/ha was considered (≈30 OD t/ha) with a forwarding distance of 250 m, the productivity of the forwarder was about 12 m3/PW-hour (≈6 OD t/PW-hour), which was similar to our results. However, the number of observations in our study was limited and it was not possible to model all the components of the PW-time of the forwarder in respect of the biomass removal and stand conditions (i.e. average values had to be used for “moving while loading”, “unloading” and “miscellaneous” time elements) (Eq. 5). In any case, the aim of the present study was not to model the PW-time consumption of the forwarder in detail, as described by Laitila et al. (2007), but to assess the level of productivities when forwarding small trees in PL corridor clearing.
On average, 18.6% of the forwarder’s load capacity was reached (3.35 fresh t on a payload capacity of 18 t), which denoted the bulkiness of the harvested biomass. The bulk density of biomass, on the load bunk, was, on average, 139 fresh kg/m3 loose (78 OD kg/m3 loose). The low value of the bulk density shows the need for densification, which could improve the forwarder’s productivity and the efficiency of the operation. As suggested by Bergström et al. (2010b), one possibility could be the compression and rough delimbing of tree bunches with a boom-tip mounted unit, or the compression of the forwarder loads with the use of compressing stakes on the load bunk. The results of that study showed that it was possible to increase the energy density of the material up to 80–160% when processing the tree bunches with a specific head. A compression of the forwarder load increased the bulk density by 16–32% and the result was significant especially in the case of small birch trees.
4.3 Motor-manual cleaning
The productivity levels of motor-manual clearing in PL corridors were investigated and several sources (forest consultants and entrepreneurs) reported a huge variability, depending on the PL corridor conditions (e.g. ground conditions, height and density of trees, etc.). These levels range from about 0.3–0.5 ha/day in the worst cases and 0.7 ha/day in medium conditions to 1–1.5 ha/day at the best sites. Compared to PCT in young forests, productivity in PL corridors is considered to be lower, because although it is not necessary to make a selection of the stems to fell (which, for an experienced operator, would not affect productivity), for PL corridor clearing, all the trees must be cut, the patrol road (strip road) must be kept free from felled trees and vegetation cannot be left “hanging out”. Comparing previous reference productivities to the ones modelled using Eq. 2 (0.6 ha/day in class C and 0.5 ha/day in classes B, A and Q), these conditions can be classified as “medium-difficult” and “difficult” clearings. The average productivity of motor-manual clearing in PL corridors was also estimated at 0.5 ha/day (Hägglund 1992). For this reason, the figures for motor-manual productivity that were used in the modelled stands must be regarded as consistent, compared with the available sources. The formula and input variables used to calculate PCT productivity are based on performance tables from Swedish experience (SLA Norr 1991) and based on tree density and height. In other countries like Finland, the productivity of motor-manual PCT can also be a function of tree density and DSH.
4.4 Economic analyses
As shown in Fig. 7, the net income from carrying out mechanized harvesting increases with the height of the harvested trees (biomass removal), until it reaches a point where the net income from mechanized clearing equals the costs of motor-manual clearing. If tree height/biomass removal continues to increase, there will be also a point (“the break-even point”) at which the mechanized harvesting system will give a net income equal to zero.
This “break-even point” (theoretical average tree height) was calculated for stands with sizes from 1 to 5 ha (i.e. forwarding distance from 100 to 500 m) (Table 8). The minimum height of trees at which the costs and revenues in the mechanized harvesting system became equal (both per hectare and per OD t) was 7.1 m, when the size of the harvesting unit ranged from 2 to 3 ha.
| Table 8. The “Break-even point” (tree height) of the mechanized clearing system for stand sizes from 1 to 5 ha. | ||
| Stand size (ha) | Forwarding distance (m) | “Break-even point” (Tree height) (m) |
| 1 | 100 | 7.6 |
| 2 | 200 | 7.1 |
| 3 | 300 | 7.1 |
| 4 | 400 | 7.2 |
| 5 | 500 | 7.4 |
Although the calculated average tree height, 7.1 m, did not correspond to the average tree height of any of the units in the field study, the frequency of trees with heights from 7.1 m to 8 m represented 11% of the total number of stems in unit 13, meaning that this height is expected to be reached in those sites with similar fertility conditions. This fact proves the expediency of re-adjusting the clearing frequency of the PL corridors, without compromising the safe distance of trees from the PL wires. In the PL corridor studied, the shortest distance from the wires to the ground was approximately 16 m; by subtracting 4.5 m (the working safety distance under the highest voltage of 400 kV) (Svenska Kraftnät 2011), the maximum allowed height of trees would be 11.5 m, which is much higher than the current height of harvested trees. Thus, in some cases, the net income from PL clearing would be notably increased if trees are allowed to grow a few additional years than at present, by taking into consideration the growth conditions in each section of the PL corridor.
Even if the “break-even point” height was not reached in the PL corridor clearing experiment, the mechanized harvesting system turned out to be more economically efficient than motor-manual clearing, when tree height reached around 6 m. (Fig. 7).
We should also consider that PL corridor clearing offers an opportunity to maximize the annual utilization of forest machines, representing an extra source of jobs for forest entrepreneurs and, for this reason, the hourly operating costs of forest machines are expected to decrease. As a consequence, it is expected that, at lower tree heights, the net income of mechanized PL corridor clearing would already be equal (or greater) to the costs of motor-manual clearing. Similar economic results with a two forest machine system were obtained in willow plantations (Di Fulvio et al. 2012). In fact, when considering average tree height of 5.4 m and stand size of 4 ha, the total harvesting cost in a willow plantation was 480 SEK/OD t (17 210 SEK/ha), which is similar to the total harvesting costs of PL corridor clearing, that is 561 SEK/OD t (18 182 SEK/ha).
The transportation distance to the power plant is also expected to have an effect on the revenues from PL corridor clearing, due to the fact that this cost is actually discounted from the roadside revenue. Nevertheless, the harvested biomass from PL corridors may be used directly by the owner of the PL to generate energy, so that the roadside price may not be a limitation. However, the forest land occupied by PL corridors belongs, usually, to individual private owners, so new agreements should be signed to allow the extraction of the biomass and to allow forest machines to cross estates owned by different people. Therefore, in the total costs of the mechanized clearing system, an additional cost should also be included, to compensate the landowner for the biomass, which could represent around 22% of the total harvesting cost, as found by Hägglund (1992).
4.5 Strengths and Weakness of the study
Due to the relatively small number of observations (13 study units) from which the models were extrapolated, the results should only be applied to similar PL corridor conditions (similar height, density of trees, DBH, and biomass removal), using similar technology. This limitation should be considered when applying similar technologies in other areas of Sweden, or even in Europe. The study was planned to be completely executed in Area A, but the trees in that area were not as tall as expected. Despite the time limitation regarding machines’ availability and the difficulties to obtain the permission from the landowner, it was possible to find an additional unit in Area B, with much better stand conditions. By performing a more detailed analysis in a broader range of PL corridors, more robust models may be built up, providing more accurate and reliable results. However, the models presented in this study and the results of the economic analyses may represent a powerful tool for decision makers.
It’s important to be aware of the fact that PL corridors represent a particular sort of harvesting stands, in comparison to conventional forest conditions. The common practice in forest thinning operation is to use tree volume or DBH to model the biomass removal and harvester’ productivity, but in this study, tree height was chosen. This was due to the notably greater effect of height on cutting productivity, but also, because the maintenance operations of PL rely mostly on tree height. Furthermore, flights conducting laser scanning over PLs measure the tree height to estimate the biomass removal, so it can be more convenient to use height rather than DBH or tree volume in those conditions.
The percentage of delay time (10%) to convert PW time into WT (for the work of both the harvester and the forwarder) can be considered somewhat small, if compared to conventional forest harvesting operations. As shown in the study of Laitila (2008), the coefficients used to transform PW time into WT are 1.3 for the harvester and 1.2 for the forwarder (in early thinnings). Although our study was carried out over a short time, the work conditions can be considered to be easier than in conventional forestry (even easier than a clear-cut), and for this reason, the 10% delay time is expected to be a reasonable value.
Although the machine drivers in the experiment were very skilled and had several years of experience, multiple studies have showed that machine operators have a huge effect on forest systems’ performance (Pürfürst and Erler 2011; Purfürst and Lindroos 2011). As shown by Kärhä et al. (2004), the variation in productivity between drivers of the same thinning harvesters can be as much as 40%. This fact reflects the limitations of our experiment, in which, only one operator per machine participated. It is obvious that studying the work of different drivers would notably improve the models and would give more general results. Although the effect of the machine operator is a different issue to the delays in the work of the machines, the sensitivity analysis performed on delays may also give a general idea of the effect of the drivers on productivity and profitability.
5 Conclusion
The clearing of PL corridors represents about 50% of the total maintenance costs of PL areas. There is, therefore, an obvious need to decrease this cost by means of innovative methods and technologies. The results of the present study conclude that if the tree height in these areas is greater than 6 m, the mechanized harvesting of PL corridors becomes a more cost-efficient alternative when compared to motor-manual clearing.
The study has also shown that the mechanization of PL corridor clearing is not always the most cost-effective option, since it is strongly affected by the height of trees, biomass removal, forwarding distances and wood fuel prices. Due to these factors, together with the availability of forest machines, technical restrictions (i.e. the lack of main traffic roads nearby, safety regulations) and legal constraints (i.e. the need to make new agreements with the landowner to drive forest machines across their land and extract the biomass from PL corridors), motor-manual clearing will continue to be a more feasible and cheaper option in many cases.
Despite these limitations, mechanization of PL corridor clearing still has a huge potential to be expanded, both by using the machines studied or alternative technologies. For these reasons, more research is needed to promote the supply of biofuels at more competitive prices, by developing new technologies and work methods. Future research into the combined management of the PL corridors and side areas is required, in particular through developing cost-efficient harvesting technology adapted to power line harvesting conditions and GIS mapping of the potential areas to implement forest mechanization.
Acknowledgements
The Mid Nordic Business Arena is gratefully acknowledged for financial support.
References
Berg S. (1992). Terrain classification system for forestry work. The Forest Operations Institute of Sweden, Kista. 28 p. ISBN 91-7614-078-4.
Bergström D., Bergsten U., Nordfjell T. (2010a). Comparison of boom-corridor thinning and thinning from below harvesting methods in young dense Scots pine stands. Silva Fennica 44(4): 669–679.
Bergström D., Nordfjell T., Bergsten U. (2010b). Compressing processing and load compression of young Scots pine and birch trees in thinnings for bioenergy. International Journal of Forest Engineering 21(1): 31–39.
Brunberg T. (2006). Bränsleförbrukningen hos skördare och skotare 2006. [Fuel consumption of harvesters and forwarders 2006]. Skogforsk, The Forestry Research Institute of Sweden, Uppsala, Resultat 22 2006. 4 p. [In Swedish].
Catts G., Roise J., Hannum L. (2011). Toward the development of a commercial system to effectively harvest small-diameter woody biomass for energy production, habitat management and wildfire risk reduction. Proceedings: IBBC 04, International Bioenergy & Bioproducts Conference 2011, March 14–16, Atlanta, GA, USA. http://www.tappi.org/content/Events/11BIOPRO/2.3Catts.pdf. [Cited 20 September 2012].
Di Fulvio F., Bergström D., Kons K., Nordfjell T. (2012). Productivity and profitability of forest machines in the harvesting of normal and overgrown willow plantations. Croatian Journal of Forest Engineering 33(1): 25–37.
E.ON Elnät Sverige AB. (2012). Faktablad röjning. Vi underhållsröjer vid våra ledningar för tryggare el till dig. [Booklet clearing. We perform maintenance clearing in our transmission lines for a safer electricity to you]. 2 p. [In Swedish].
Eriksson P.A. (1992). Mångbruk av kraftledningsgator – en idesammanställning. [Multiple use of power line corridors – a compilation of ideas]. Examensarbete vid Södra Skogsinstitutet i ämnet Naturvård. Södra Skogsinstitutet, Värnamo, Sweden. 56 p. [In Swedish].
Europe’s Energy Portal. (2012). Fuel prices. [Internet site]. http://energy.eu/. [Cited 20 August 2012].
European Commission. (2008). The EU climate and energy package. The “20-20-20” targets. [Internet site]. http://ec.europa.eu/clima/policies/package/index_en.htm. [Cited 3 August 2012].
European Committee for Standardization. (2004). CEN/TS 14774-2:2004. Solid biofuels – Methods for the determination of moisture content – Oven dry method – Part 2: Total moisture – Simplified method. 8 p.
Framstad E., Berglund H., Gundersen V., Heikkilä R., Lankinen N., Peltola T., Risbøl O., Weih M. (2009). Increased biomass harvesting for bioenergy – effects on biodiversity, landscape amenities and cultural heritage values. Nordic Council of Ministers, Copenhagen 2009, TemaNord 2009:591. 161 p.
Government of South Australia. (2011). Trees and powerlines. Office of the Technical Regulator, Government of South Australia. 8 p.
Harstela P. (1991). Work studies in forestry. Silva Carelica, 18. University of Joensuu, Faculty of Forestry, Joensuu, Finland. 41 p.
Hägglund L. (1992). Skogsbränsle från kraftledningsgator. [Forest fuel from power line corridors]. Projekt Bioenergi Nr U(B)91-405.Vattenfall Utveckling och Miljö. Vattenfall Energisystem AB, Sundsvall, Sweden. 28 p. [In Swedish].
Iwarsson Wide M. (2009). Teknik och metod Ponsse EH25. Trädbränsleuttag med Ponsse EH25 i kraftledningsgata. [Technique and method Ponsse EH25. Wood fuel removal with Ponsse EH25 in power line corridor]. Skogforsk, The Forestry Research Institute of Sweden, Uppsala, Arbetsrapport 681-2009. 18 p. [In Swedish].
Jacobsson J. (2005). En uppdatering av kunskapsläget beträffande tillgång och efterfrågan på biobränsle. [An update of the state of knowledge regarding supply and demand on biofuels]. Skogsindustrierna (Swedish Forest Industries Federation). 27 p. [In Swedish].
Jylhä P., Dahl O., Laitila J., Kärhä K. (2010). The effect of supply system on the wood paying capability of a kraft pulp mill using Scots pine harvested from first thinnings. Silva Fennica 44(4): 695–714.
Kärhä K. (2006). Whole-tree harvesting in young stands in Finland. Forestry Studies | Metsanduslikud Uurimused 45: 118–134. ISSN 1406-9954.
Kärhä K., Rönkkö E., Gumse, S-I. (2004). Productivity and cutting costs of thinning harvesters. International Journal of Forest Engineering 15(2): 43–56.
Kärhä K., Elo J., Lahtinen P., Räsänen T., Pajuoja H. (2009). Puupolttoaineiden saatavuus ja käyttö Suomessa 2020. [Availability and use of wood-based fuels in Finland in 2020]. Metsätehon Katsaus 40/2009. 4 p. [In Finnish].
Laitila J. (2008). Harvesting technology and the cost of fuel chips from early thinnings. Silva Fennica 42(2): 267–283.
Laitila J., Asikainen A., Nuutinen Y. (2007). Forwarding of whole trees after manual and mechanized felling bunching in pre-commercial thinnings. International Journal of Forest Engineering 18(2): 29–39.
Langerud B., Størdal S., Wiig H., Ørbeck M. (2007). Bioenergi i Norge – potensialer, markeder og virkemidler. [Bioenergy in Norway – potentials, markets and instruments]. ØF-rapport 17/2007, Lillehammer, Norway. 198 p. [In Norwegian].
Larsson U. (1998). Kraftledningsgator – en resurs för skogsbränsleproduktion? Studentuppsatser 17. [Power line corridors – a resource for forest fuel production? Students’ reports 17]. Swedish University of Agricultural Sciences, Department of Operation Efficiency, Forest Technology. 32 p. [In Swedish with English summary].
Nordfjell T. (2010). Kostnadskalkylering avseende skogsmaskiner, generella formler. [Costs calculation regarding forest machines, general equations]. Swedish University of Agricultural Sciences, Dept. of Forest Resource Management, Forest Technology, Umeå. 1 p. [In Swedish].
Nylinder M., Larsson F. (2012). WeCalc, Wood Energy Calculations. [Internet site]. Sveriges Lantbruksuniversitet, Institutionen för skogens produkter, Uppsala, Sweden. http://woodenergy.sites.djangoeurope.com/conversion/. [Cited 9 August 2012].
Purfürst F.T., Erler J. (2011). The human influence on productivity in harvester Operations. International Journal of Forest Engineering 22(2): 15–22.
Purfürst F.T., Lindroos O. (2011). The correlation between long-term productivity and short-term performance ratings of harvester operators. Croatian Journal of Forest Engineering 32(2): 509–519.
SLA Norr. (1991). Prognosunderlag – motormanuell röjning och förrensning. [Forecast basis – Motor-manual clearing and pre-clearing]. Skogs- och Lantarbetsgivareförbundet (SLA) Norr, Sweden. 4 p. [In Swedish].
Statens energiverk. (1989). Kraftledningar i fysisk planering. [Power lines in the physical planning]. Statens Energiverk/Statens Naturvårdsverket /Boverket/Vattenfall. PBL/NRL 27. 67 p. [In Swedish].
Svebio. (2011). Facts about bioenergy. [Internet site]. Svebio (Swedish Bioenergy Association). http://svebio.se/english/bioenergy-facts. [Cited 2 Aug 2012].
Svenska Kraftnät. (2003). Riktlinjer för skogligt underhåll av 400 och 220 kV ledningar. [Guidelines for forest maintenance of 400 and 220 kV transmission lines]. Svenska Kraftnät, Drift och underhåll, Skogligt underhåll, TR 12-013:2. 19 p. [In Swedish].
Svenska Kraftnät. (2011). Svenska Kraftnät kompletterande elsäkerhets-anvisning. [Svenska Kraftnät supplementary electrical safety-instructions]. Svenska Kraftnäts Tekniska Riktlinje TR10-01. 64 p. [In Swedish].
Svenska Kraftnät. (2012a). Underhållet i våra kraftledningsgator. [The maintenance in our power line corridors]. Faktablad 2012 03 27. 4 p. [In Swedish].
Svenska Kraftnät. (2012b). The power transmission network in the Nordic countries in 2012. 1 p.
Swedish Energy Agency (Energimyndigheten). (2004). Uppföljning av nätföretagens åtgärder mot elavbrott på grund av snöoväder. Investeringar och skogsåtgärder under 2003 samt erfarenheter från vintern 2003/2004 - ER13:2004. [Follow-up of electric companies’ actions against power outages due to snowy weather in Sweden. Investments and actions in the forest during 2003 as well as experiences from the winter 2003/2004]. 66 p. ISSN 1403-1892. [In Swedish].
Swedish Forest Agency (Skogsstyrelsen). (2012). Wood fuel statistics. [Internet site]. http://www.skogsstyrelsen.se/en/AUTHORITY/Statistics/Subject-Areas/Wood-Fuel/Wood-Fuel/. [Cited 3 August 2012].
Swedish National Forest Inventory (Riksskogstaxeringen). (2012). Beräkning av mängden biomassa i olika delar av ett träd. [Calculation of the amount of biomass in different parts of a tree]. [Internet site]. Swedish University of Agricultural Sciences, Dept. of Forest Resource Management, Umeå, Sweden. http://www.slu.se/sv/centrumbildningar-och-projekt/riksskogstaxeringen/hur-vi-jobbar/efterarbete-och-redovisning/analys-och-redovisning/berakna-volymen-for-ett-trad/. [Cited 8 August 2012].
Söderström O. (1983). Träddelssortimentets egenskaper, sammansättning och värde. [Tree parts assortments properties, composition and value]. Swedish University of Agricultural Sciences, Dept. of Wood Products, Uppsala, Sweden. p. 78–79. ISBN 91-576-1766-X. [In Swedish].
Talbot B., Suadicani K. (2005). Analysis of two simulated in-field chipping and extraction systems in spruce thinnings. Biosystems Engineering 91(3): 283–292.
Vattenfall. (1982). Röjning i kraftledningsgator och nyttiggörande av röjningsprodukterna. [Clearing in power line corridors and utilization of the clearing products]. Slutrapport 1982-07-01. 22 p. [In Swedish].
Vattenfall. (1986). Underhåll-Kraftledningar. Skogsgata jämte sidoområden, Intern stencil, kapitel 9 samt bilaga. [Maintenance-Power lines. Forest corridor and side areas]. Solna, Sweden. 12 p. [In Swedish].
Vattenfall. (1992). Teknik för tillvaratagande av röjningsvirke. [Techniques for the utilization of clearing-wood]. Projekt Skogskraft Rapport 11. Vattenfall Research Bioenergi, Vällingby, Sweden. 162 p. [In Swedish].
Total of 44 references
