Korotimi Ouédraogo  ,
Kangbéni Dimobe,
Adjima Thiombiano
,
Kangbéni Dimobe,
Adjima Thiombiano
Allometric models for estimating aboveground biomass and carbon stock for Diospyros mespiliformis in West Africa
Ouédraogo K., Dimobe K., Thiombiano A. (2020). Allometric models for estimating aboveground biomass and carbon stock for Diospyros mespiliformis in West Africa. Silva Fennica vol. 54 no. 1 article id 10215. https://doi.org/10.14214/sf.10215
Highlights
- Biomass estimation models developed for Diospyros mespiliformis
- Models based on DBH alone predicted aboveground biomass with 97.11% accuracy
- Published models had relative error between –72% and +98%
- Models for branch and stem biomass were more accurate than those for leaf biomass.
Abstract
Accurate estimates of aboveground biomass (AGB) strongly depend on the suitability and precision of allometric models. Diospyros mespiliformis Hochst. ex A. DC. is a key component of most sub-Sahara agroforestry systems and, one of the most economically important trees in Africa. Despite its importance, very few scientific information exists regarding its biomass and carbon storage potential. In this study direct method was used to develop site-specific biomass models for D. mespiliformis tree components in Burkina Faso. Allometric models were developed for stem, branch and leaf biomass using data from 39 tree harvested in Sudanian savannas of Burkina Faso. Diameter at breast height (DBH), tree height, crown diameter (CD) and basal diameter (D20) were regressed on biomass component using non-linear models with DBH alone, and DBH in combination with height and/or CD as predictor variables. Carbon content was estimated for each tree component using the ash method. Allometric models differed between the experimental sites, except for branch biomass models. Site-specific models developed in this study exhibited good model fit and performance, with explained variance of 81–98%. Using models developed from other areas would have underestimated or overestimated biomass by between –72% and +98%. Carbon content in aboveground components of D. mespiliformis in Tiogo, Boulon and Tapoa-Boopo was 55.40% ± 1.50, 55.52% ± 1.06 and 55.63% ± 1.00, respectively, and did not vary significantly (P-value = 0.909). Site-specific models developed in this study are useful tool for estimating carbon stocks and can be used to accurately estimate tree components biomass in vegetation growing under similar conditions.
Keywords
Burkina Faso;
biometric variables;
African ebony;
biomass estimation equations;
carbon storages;
jackalberry;
Sudanian savanna
-
Ouédraogo,
University Joseph Ki-Zerbo, UFR/SVT, Laboratory of Plant Biology and Ecology, 03 B.P. 7021 Ouagadougou 03, Burkina Faso
E-mail
okorotimi@yahoo.fr
-
Dimobe,
University Joseph Ki-Zerbo, UFR/SVT, Laboratory of Plant Biology and Ecology, 03 B.P. 7021 Ouagadougou 03, Burkina Faso; University of Dédougou, Institut des Sciences de l’Environnement et du Développement Rural (ISEDR), BP 139 Dédougou, Burkina Faso; West African Science Service Center on Climate Change and Adapted Land Use, Competence Center, Avenue Muamar Ghadhafi, Ouagadougou, BP 9507, Burkina Faso
 https://orcid.org/0000-0001-5536-9700
E-mail
kangbenidimobe@gmail.com
https://orcid.org/0000-0001-5536-9700
E-mail
kangbenidimobe@gmail.com
- Thiombiano, University Joseph Ki-Zerbo, UFR/SVT, Laboratory of Plant Biology and Ecology, 03 B.P. 7021 Ouagadougou 03, Burkina Faso E-mail adjima_thiombiano@yahoo.fr
Received 19 June 2019 Accepted 23 January 2020 Published 29 January 2020
Views 113239
Available at https://doi.org/10.14214/sf.10215 | Download PDF

1 Introduction
Biomass estimates remain essential for understanding the role of forests as carbon sinks and sustainable forest management (IPCC 2006; Pan et al. 2011). Tropical forests play an important role for the climate change as a main carbon sink for the whole world. Biomass and carbon accounting in natural and semi-natural vegetation types has rapidly become the focus over the last decades (Brown 2002; Chave et al. 2005; Chauhan et al. 2010, 2012), as being paramount step towards the implementation of the emerging carbon credit market mechanism such as Reducing Emission from Deforestation and Forest Degradation (REDD+) (Bernard et al. 2014). Aboveground biomass (AGB) is a useful measure for comparing structural and functional attributes of forest and savanna ecosystems across a wide range of environmental conditions (Brown et al. 1999). AGB also serves as an indicator for the distribution and abundance of vegetation above the ground.
Tree biomass can be estimated by: (1) destructive methods (Balima et al. 2019; Dimobe et al. 2018a,b; Bayen et al. 2015), (2) Non-destructive methods (Dimobe et al. 2018c,d, 2019), and (3) remote sensing techniques (Qureshi et al. 2012; Galidaki et al. 2017). Destructive methods which involve harvesting of trees, drying and weighing different components (Brown 1997) are time consuming and costly. They are also not applicable to large areas and are restricted in protected areas or for species that are endangered compared to non-destructive methods, while remote sensing is limited by access to technology and cloud cover. Allometric biomass models are statistical formulas relating tree biometric variables (e.g. diameter at breast height, tree height, basal diameter or crown diameter) to tree dry biomass. These models can be developed by destructive sampling (Kuyah et al. 2013; Dimobe et al. 2018a,b), semi-destructive (Mensah et al. 2016, 2017) and non-destructive (MacFarlane et al. 2014; Dimobe et al. 2019), and used based on predictors such as diameter at breast height (DBH), tree height, wood density, crown diameter or basal diameter, or the combination of these variables. Although allometric models are developed by destructive sampling, once developed, they allow non-destructive estimation of biomass over a large area at relatively low cost. Allometric models for estimating AGB can be linear, logarithmic, exponential or power law (Návar 2009; Bayen et al. 2015; Mensah et al. 2016). Power law however remain the most common used model because it is supported by growth that assumes a constant scaling rate across ontogenies (Mensah et al. 2017).
A limited number of studies have developed allometric models for species in dryland environments. These are based on data derived from wider geographical range; for example Brown (1997) developed allometric models from field measurements in savanna ecosystems of South America and dry forests of India; Chave et al. (2014) reported allometric models for pantropical forests. Recent studies (Shirima et al. 2011; Kuyah et al. 2012; Chave et al. 2014; Mensah et al. 2017) have also reported allometric models specific to African ecosystems. However, few of them refer directly to Sudanian savanna ecosystems of West Africa (Sawadogo et al. 2010; Bayen et al. 2015; Dimobe et al. 2018a,b). Accurate estimates of biomass in many tropical dryland regions are still lacking because of lack of allometric models. Challenges in obtaining measured field data in these species-rich ecosystems have made it difficult to develop models for predicting biomass of individual trees (Dimobe et al. 2018a,b). This is a major constraint given that accurate estimates of biomass depend on the appropriateness of the allometric models that are used (Sileshi 2014; Picard et al. 2015). There is mounting evidence that application of models not suitable to target vegetation results in large systematic deviations from observed data.
Diospyros mespiliformis Hochst. ex A. DC. is a species of the family Ebenaceae providing important ecosystem services to local population in sub-Saharan Africa. The tree serves as wind breaks, controls soil erosion and provides a habitat for other organisms. It also has potential for climate mitigation through carbon sequestration – a function that has not been quantified. The role of D. mespiliformis in climate change mitigation is therefore poorly understood. Carbon storage potential of the species can be underestimated or overestimated depending on the allometric model chosen for biomass estimation. To fill this gap, we developed allometric model for prediction of aboveground biomass and the biomass of tree components for D. mespiliformis in Burkina Faso. The specific objectives were to (i) develop species-specific allometric models for estimating total biomass and biomass of tree components (stem, branch, leaf) using basal diameter, DBH, total height and crown diameter, (ii) compare the performance of the selected model to predict the AGB with previously published and well‐established global models, and (iii) predict the carbon content in leaf, branch, stem components of D. mespiliformis trees.
2 Material and methods
2.1 Study area
The study was conducted in three protected areas located in the Eastern and Southwestern Regions of Burkina Faso, namely, Boulon, Tapoa-Boopo and Tiogo (Fig. 1). Description of the biophysical contexts of the three forests areas are presented in Table 1. Boulon and Tiogo forests were classified by the colonial administration in 1955 and 1940, while that of Tapoa-Boopo was classified in the 80s (FAO 2004). In terms of climate, the forest of Boulon is located in the Sudanian zone while Tapoa-Boopo and Tiogo are located in the Sudano-Sahelian zone (Guinko 1984). All three locations experience a single rain season from May to October with annual precipitation ranging between 600–1000 mm; the rest of the year is dry. The mean annual temperature across the three sites is 35 °C; temperatures above 35 °C occur during peak period in the month of April (Bognounou 2009). Vegetation is dominated by shrub savannas, tree savannas and woodlands.
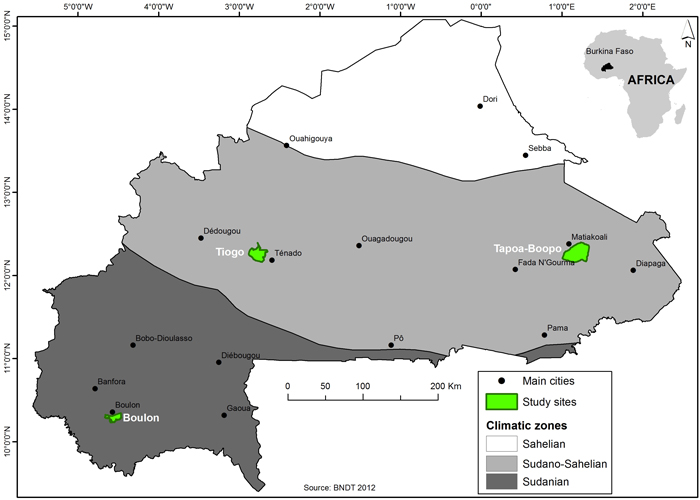
Fig. 1. Location of the study area (Bolon, Tapoa-Boopo and Tiogo forests) in Burkina Faso. View larger in new window/tab.
| Table 1. Biophysical characteristics of Bolon, Tapoa-Boopo and Tiogo forests (Guinko 1984). | |||
| Protected areas | Boulon | Tapoa-Boopo | Tiogo |
| Region | Cascades | Eastern | Central-West |
| Location | 10°15´–10°22´N; 4°20´–4°38´W | 12°10´–12°23´N; 0°58´–1°13´W | 12°10´–12°25´N; 2°39´–2°54´W |
| Area (ha) | 13 521.70 | 36 202.30 | 30 339 |
| Climate | Sudanian | Sudano-Sahelian | Sudano-Sahelian |
| Annual rainfall (mm) | 900–1100 | 600–900 | 600–900 |
| Rainfall regime | Unimodal | Unimodal | Unimodal |
| Temperature range (°C) | 17–36 | 25–33 | 25–35 |
| Main vegetation | Dense dry forest, savannas | Tree and shrub savannas | Tree and shrub savannas |
2.2 Description of the species
Diospyros mespiliformis is a mesopharenophyte that belongs to the family of Ebenaceae with a maximum height of 25 m (Arbonnier 2002). The species is widely distributed in sub-Saharan Africa, occurring from Senegal east to Eritrea, Ethiopia and Kenya, and south to Namibia, northern South Africa and Swaziland, but it is nearly absent in the more humid forest zones of West and Central Africa. It is also found in Yemen. D. mespiliformis is widely distributed in agroforestry parklands, woodlands, savannas and along riverbanks. Also known as African ebony or jackalberry, D. mespiliformis is a multipurpose species. For instance, the wood of D. mespiliformis is used for posts in construction, making musical instruments (e.g. drums) and household utensils (e.g. cups, spoons, pestles and mortars). The fruit are directly consumed for their vitamins and energy contents. The seeds are also eaten. The leaves are occasionally eaten as vegetable and serve as fodder for livestock. D. mespiliformis is commonly managed as a crop, but also grows in the wild and parklands across the sub-Saharan African savannas. It contributes ecosystem service such as wind breaks, controls soil erosion, and climate regulation.
2.3 Forest inventory and biomass sampling
Data were collected through two phases of sampling. For the first phase, forest inventory was conducted using 180 plots (60 plots for each site) of 1000 m² (50 m × 20 m) to collect data on DBH, total tree height, crown diameter and basal diameter on all individual trees of D. mespiliformis with DBH ≥ 5 cm inside each plot. The plots were established based on a stratified random sampling design. For the second phase, a destructive sampling of the species was carried out for quantification of tree biomass in 39 plots (13 plots for each site). Thirteen (13) individual trees of the species (one felled tree per selected plot) were harvested at each of the three sites (Boulon, Tapoa-Boopo and Tiogo), giving a total of 39 trees for measurements of biomass and subsequent development of allometric models (Table 2). To facilitate sampling, the individuals in each site were grouped into seven stem diameter classes: 10–20 (4 individual trees in Boulon, 6 in Tapoa-Boopo and 5 in Tiogo), 20–30 (5; 1 and 3), 30–40 (2; 3 and 1), 40–50 (1; 1 and 1), 50–60 (1; 0and 2), 60–70 (0; 1 and 0) and 70–80 (0; 1 and 1). Individual trees were selected during the rainy season in June 2018 when all vegetation was in leaf. Prior to the harvesting, biometric variables, including DBH, total height, crown diameter and basal diameter were measured for all individual trees of D. mespiliformis. Crown diameter, DBH and basal diameter were measured using a diameter tape graduated in cm. Total tree height was measured from the base of the trunk to the tip of the tree using a clinometer. To avoid measurement error and to account for structural variety, the crown diameter was measured twice, along the east–west direction and the north–south one (Meyer et al. 2014). The diameter of all ramification was measured for tree forking below 1.30 m and quadratic mean diameter was computed.
| Table 2. Summary statistics of sample tree characteristics and biomass data. | |||||||||||||
| Site | Sample trees | DBH (cm) | Height (m) | D20 (cm) | CD (m) | Aboveground tree biomass (kg) | |||||||
| Mean | Range | Mean | Range | Mean | Range | Mean | Range | Stem | Branch | Leaves | Aboveground | ||
| Boulon | 13 | 29.6±4.6 | 14.6–73.5 | 8.5±0.7 | 6.0–14.9 | 35.8±6.3 | 18.1–98.5 | 6.8±0.8 | 3.7–13.6 | 119.7±55.4 | 224.1±97.7 | 12.7±3.7 | 356.6±153.1 |
| Tapoa | 13 | 26.1±4.4 | 11.5–61.5 | 6.6±0.5 | 3.5–9.2 | 31.9±5.6 | 14.5–76.1 | 5.7±0.8 | 2.9–11.9 | 78.2±24.6 | 157.9±73.9 | 18.2±7.1 | 254.3±102.0 |
| Tiogo | 13 | 27.58±4.5 | 9.4–59.5 | 7.1±0.8 | 1.7–12.0 | 33.2±5.4 | 13.5–75.5 | 5.9±1.1 | 1.9–16.1 | 94.4±34.2 | 213.8±87.5 | 36.2±11.6 | 344.4±129.1 |
| DBH: Diameter at breast height; D20: basal diameter; CD: height and crown diameter. | |||||||||||||
Selected trees were cut at ground level using a chain saw. Felled trees were separated into stem, branches and leaves. Branches were removed from the stem and cut into weighable sections. Leaves were separated from branches and collected into bags for weighing. Fresh weights of stem, branches and leaves for each individual tree were separately determined in the field using a 100 kg scale balance. Subsamples of leaves, stem and branches were taken, and their fresh weight determined using a 5 kg electronic balance (precision 0.5 g). The subsamples of branches and stem were taken as discs of 5 cm thickness depending on the diameter of the trunk or branch. The fresh weight of each disc was recorded in the field immediately after harvesting the trees. Two hundred grams (200 g) of leaf subsample for each tree was collected into bags to facilitate weighing.
The discs and leaf samples were transported to the laboratory where they were oven dried to a constant weight at 105 °C (samples of branches and stems) or 75 °C (samples of leaves). The dry weight of the samples was recorded immediately after removal from the oven. The sample dry weight was divided by corresponding fresh weight to obtain the dry–to–green weight ratio for each tree component. Component dry weight (biomass) was computed by multiplying subsample dry–to–fresh weight ratio by the fresh weight of the respective tree component. Total aboveground biomass of the tree was calculated as the sum of the biomass of all components in kilograms.
2.4 Estimation of carbon content and carbon stocks
Carbon content in selected individuals of Diospyros mespiliformis was estimated using ash method (Allen et al. 1986; Jana et al. 2009; Chavan and Rasal 2011) as follows. Composite samples were obtained from the dry matter samples of leaves, branches and stems for determination of their total carbon content. The samples were crushed in a cutting mill. Five 2-g samples of each component were then collected and submitted for analysis to the Laboratory of Plants and Soils at the University Ouaga1 Joseph Ki-Zerbo (Burkina Faso). Each 2-g sample was placed in a lidless porcelain crucible and placed for 2 h inside a muffle furnace set at 550 °C, until calcination was completed. The samples were then removed and cooled in a desiccator to be weighed later. After cooling, the crucible with ash was weighed and the percentage of carbon was calculated according to the formula by Allen et al. (1986):
![]()
![]()
where W1 is weight of crucibles, W2 is weight of oven-dried grind samples with crucibles, and W3 the weight of ash with crucibles; 0.58 is the content of carbon in dry organic matter (Allen et al. 1986).
The carbon stock in leaves, branches and stems of each individual tree was calculated separately and summed up to determine the total organic carbon stock for each individual tree.
2.5 Data analysis
Biomass data were screened for outliers in scatter plots that assisted also in visually assessing the relationships between dependent variables (aboveground biomass and the biomass of components) and independent variables (basal diameter, crown diameter, DBH and total tree height). We examined the relationship between dependent variables and independent variables using linear, logarithmic, exponential and power models. Scatter plots were set to identify the theoretical distribution that fitted well with the data. As a result, the power law model (Eq. 3) outperformed the linear, logarithmic and exponential models; and therefore, was used to fit the biomass data. We, therefore, developed site-specific allometric models for each of the tree biomass components (leaf, branch, and stem) using the following linearized form of the power-law model (Eq. 4).
![]()
where Y denotes the leaf biomass, branch biomass or stem biomass; X stands for D20, DBH or CD; β0 and β1 the parameters, and ε is the random error.
This model was logarithmically transformed into its linear equivalent form defined as followed:
![]()
where ε′ is the additive error.
Based on the selected aboveground biomass model, we developed allometric models for stem, branch, leaves and aboveground components based on (i) DBH or basal diameter as lone predictor variable, (ii) DBH2× H, and (iii) DBH2× H and CD, as independent variables for equation (5), (6) and (7), respectively:
![]()
![]()
![]()
where Yi represents stem biomass, branch biomass and leaf biomass.
We tested whether additional use of total height or/and crown diameter as predictor would improve the precision of the prediction. As separate use of potentially correlated independent variables in regression models could give rise to collinearity (Sileshi 2014), we only considered the allometric model that combined DBH (or basal diameter) with tree height and crown diameter as single predictor variable. DBH and height were used as combined predictor to account for variation of height for the same value of diameter while solving collinearity issue in linear regression (Dimobe et al. 2018a).
The use of natural logarithmic transformations helped to normalize the response variable, and thus to meet the prerequisites of linear regression for simple estimation of the parameters (Dimobe et al. 2018a). However, the use of natural logarithmic transformations, induces a systematic bias in the final estimation of the response variable, which can generally be corrected (predicted values were back-transformed into the original values) by applying the correction factor (Baskerville 1972):
![]()
where RSE is the residual standard error of the regression.
Normality and homoscedasticity of the residuals were tested using the Shapiro-Wilks normality and Breusch-Pagan tests, respectively. The performance of the fitted models was compared using adjusted determination coefficient (R2), residual standard error (RSE), Akaike information criterion (AIC), a likelihood criterion that penalizes the number of parameters (Burnham and Anderson, 2002) and root mean squared error (RMSE), calculated as:

where AGBobs is the observed AGB and AGBest is the estimated AGB.
The site-specific AGB models were compared to four published global models in predicting the individual AGB. Published models selected were:
![]() by Chave et al. (2014) for pantropical forests,
by Chave et al. (2014) for pantropical forests,
where AGB is the aboveground biomass per tree in kg per tree, DBH is the diameter at breast height, ρ is wood density in g cm–3, and H is the total height of the tree.
![]() by Chave et al. (2005) for dry forest stands.
by Chave et al. (2005) for dry forest stands.
![]() a global tree model proposed by Jucker et al. (2017) for angiosperms, using tree height and crown diameter as predictive variables,
a global tree model proposed by Jucker et al. (2017) for angiosperms, using tree height and crown diameter as predictive variables,
where AGB is the aboveground biomass per tree in kg per tree, H is the total height of the tree, and CD is the mean crown diameter.
![]() a model proposed by Brown et al. (1989), using DBH as the only predictor.
a model proposed by Brown et al. (1989), using DBH as the only predictor.
Differences between the selected model developed in this study and published models were assessed graphically, and the models were also compared using adjusted R2, RMSE and mean prediction error. The average relative systematic error was calculated as follow:
where AGBest and AGBobs are the estimated and observed aboveground biomass, respectively.
The significance of the estimated parameters at α < 0.05 was considered. Allometric models with greater adjusted R2, and smaller RMSE and AIC were considered to be the best fitting.
All statistical analyses were performed using R statistical software version 3.4.2 (R Core Team 2018).
3 Results
3.1 Allometric models for estimating stem, branch and leaf biomass
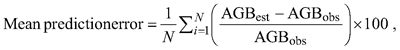
Allometric models fitted to stem, branch and leaf biomass of Diospyros mespiliformis showed AIC values between 7.35 and 34.79, adjusted R2 between 64.93 and 96.70, and RMSE between 0.256 and 0.677 (Table 3). Candidate allometric models and their regression coefficients are presented in Table 3. The coefficients of log-transformed allometric biomass models were significant for all biomass components (p < 0.001, Table 3). In general, the fitted allometric models for the biomass components were more accurate for branch and stem biomass than for foliage biomass (Table 3). For instance, the fitted models explained more than 90% of the total variations, except for leaf. Stem biomass was more accurate predicted in Tiogo and Tapoa-Boopo when DBH and height were used (DBH2 × H) as compound variable (Table 3) than in Boulon. In Boulon, stem biomass was more accurately predicted using basal diameter (D20) alone than in Tiogo and Tapoa-Boopo. Similarly, leaf biomass was more accurately predicted when using DBH and crown diameter (DBH2 × CD) as single variable in Tiogo and Tapoa-Boopo while in Boulon addition of crown diameter to basal diameter as compound variable (D202 × CD) provided accurate estimation of leaf biomass (Table 3). However, in the three sites, branch biomass was more accurately predicted when DBH and crown diameter were used as compound variable (Table 3). The predictive ability and accuracy of these models are demonstrated by the homoscedastic trend and good coincidence to the y = x linear equation shown in the diagnostic graphs of residuals (and observed values) versus predicted values of stem biomass, branch biomass and leaf biomass (Fig. 2).
| Table 3. Allometric models developed for estimation of biomass of stem, branches and leaves of Diospyros mespiliformis in Burkina Faso. ln(β0), β1 and γ represent the intercept and regression coefficients of the models, and their respective standard errors. The indicators of performance for the models include the adjusted coefficient of determination (Adj.R2), residual standard error (RSE), root mean squared error (RMSE), Akaike information criterion (AIC) and correction factor (CF). | |||||||||
| Regression coefficients | Performance criteria | ||||||||
| Equation | Predictors | ln(β0) | β1 | γ | Adj.R2 | RSE | RMSE | AIC | CF |
| Boulon (Sudanian zone) | |||||||||
| Stem biomass | |||||||||
| Eq(5) | DBH | –3.25***±0.48 | 2.22***±0.15 | 94.70 | 0.327 | 0.300 | 11.62 | 1.055 | |
| D20 | –4.27***±0.48 | 2.39***±0.14 | 96.02 | 0.283 | 0.260 | 07.89 | 1.041 | ||
| CD | 0.29ns ±0.53 | 2.14***±0.31 | 79.85 | 0.637 | 0.586 | 28.98 | 1.225 | ||
| Eq(6) | DBH2×H | –3.08**±0.84 | 0.84***±0.10 | 84.83 | 0.552 | 0.508 | 25.28 | 1.165 | |
| DBH2×CD | –2.22***±0.49 | 0.76***±0.06 | 92.76 | 0.382 | 0.351 | 15.68 | 1.076 | ||
| D202×H | –3.68**±0.96 | 0.87***±0.11 | 83.61 | 0.574 | 0.528 | 26.29 | 1.179 | ||
| D202×CD | –2.85***±0.51 | 0.79***±0.06 | 93.59 | 0.359 | 0.330 | 14.09 | 1.067 | ||
| Eq(7) | DBH2×H; CD | –2.11ns ±1.14 | 0.56*±0.24 | 0.78ns ±0.65 | 85.48 | 0.540 | 0.474 | 25.48 | 1.157 |
| D202×H; CD | –2.37ns ±1.28 | 0.54ns ±0.24 | 0.90ns ±0.62 | 85.17 | 0.546 | 0.479 | 25.75 | 1.161 | |
| Branch biomass | |||||||||
| Eq(5) | DBH | –4.47***±0.64 | 2.73***±0.20 | 93.93 | 0.591 | 0.395 | 18.77 | 1.097 | |
| D20 | –5.58***±0.81 | 2.89***±0.24 | 92.37 | 0.482 | 0.444 | 21.76 | 1.123 | ||
| CD | –0.32ns±0.50 | 2.76***±0.29 | 87.91 | 0.607 | 0.558 | 27.73 | 1.202 | ||
| Eq(6) | DBH2×H | –4.62***±0.72 | 1.07***±0.09 | 92.49 | 0.478 | 0.440 | 21.55 | 1.121 | |
| DBH2×CD | –3.32***±0.50 | 0.94***±0.06 | 95.03 | 0.389 | 0.358 | 16.18 | 1.079 | ||
| D202×H | –5.32***±0.95 | 1.10***±0.11 | 89.42 | 0.568 | 0.522 | 26.00 | 1.175 | ||
| D202×CD | –4.02***±0.60 | 0.98***±0.07 | 94.06 | 0.425 | 0.391 | 18.49 | 1.095 | ||
| Eq(7) | DBH2×H; CD | –3.30**±0.87 | 0.69**±0.19 | 1.08ns ±0.49 | 94.41 | 0.413 | 0.362 | 18.46 | 1.089 |
| D202×H; CD | –3.36*±1.08 | 0.62*±0.21 | 1.34*±0.52 | 93.00 | 0.462 | 0.405 | 21.39 | 1.112 | |
| Leaf biomass | |||||||||
| Eq(5) | DBH | –3.71***±0.58 | 2.09***±0.18 | 91.65 | 0.390 | 0.359 | 16.26 | 1.079 | |
| D20 | –4.58***±0.70 | 2.22***±0.21 | 90.48 | 0.417 | 0.383 | 17.97 | 1.091 | ||
| CD | –0.53ns ±0.43 | 2.10***±0.25 | 84.94 | 0.524 | 0.482 | 23.92 | 1.147 | ||
| Eq(6) | DBH2×H | –3.85***±0.62 | 0.82***±0.07 | 90.76 | 0.411 | 0.378 | 17.57 | 1.088 | |
| DBH2×CD | –2.82***±0.48 | 0.72***±0.06 | 92.44 | 0.371 | 0.342 | 14.97 | 1.071 | ||
| D202×H | –4.39***±0.78 | 0.85***±0.09 | 88.05 | 0.467 | 0.429 | 20.92 | 1.115 | ||
| D202×CD | –3.37***±0.55 | 0.75***±0.06 | 91.73 | 0.389 | 0.357 | 16.14 | 1.078 | ||
| Eq(7) | DBH2×H; CD | –2.95**±0.81 | 0.56**±0.17 | 0.74ns ±0.46 | 91.93 | 0.384 | 0.336 | 16.58 | 1.076 |
| D202×H; CD | –3.03*±0.97 | 0.51*±0.19 | 0.93ns ±0.47 | 90.60 | 0.414 | 0.363 | 18.56 | 1.090 | |
| Tapoa-Boopo (Sahelo-Sudanian zone) | |||||||||
| Stem biomass | |||||||||
| Eq(5) | DBH | –3.89 ***±0.63 | 2.39***±0.20 | 92.19 | 0.401 | 0.369 | 16.96 | 1.084 | |
| D20 | –4.37***±0.71 | 2.40***±0.21 | 91.43 | 0.420 | 0.386 | 18.17 | 1.092 | ||
| CD | –0.97ns ±0.64 | 2.77***±0.38 | 81.58 | 0.616 | 0.567 | 28.12 | 1.209 | ||
| Eq(6) | DBH2×H | –4.50***±0.51 | 0.99***±0.06 | 95.43 | 0.307 | 0.282 | 09.99 | 1.048 | |
| DBH2×CD | –3.15***±0.61 | 0.85***±0.08 | 91.07 | 0.429 | 0.394 | 18.69 | 1.096 | ||
| D202×H | –4.89***±0.59 | 0.99***±0.07 | 94.64 | 0.332 | 0.305 | 12.06 | 1.057 | ||
| D202×CD | –3.48***±0.67 | 0.85***±0.08 | 90.33 | 0.446 | 0.410 | 19.73 | 1.104 | ||
| Eq(7) | DBH2×H; CD | –4.66***±0.74 | 1.05***±0.19 | –0.17ns ±0.57 | 95.02 | 0.320 | 0.281 | 11.88 | 1.053 |
| D202×H; CD | –5.06**±0.89 | 1.05**±0.21 | –0.16ns ±0.63 | 94.15 | 0.347 | 0.304 | 13.97 | 1.062 | |
| Branch biomass | |||||||||
| Eq(5) | DBH | –4.99***±0.49 | 2.83***±0.16 | 96.39 | 0.316 | 0.291 | 10.78 | 1.051 | |
| D20 | –5.56***±0.58 | 2.84***±0.17 | 95.65 | 0.347 | 0.319 | 13.21 | 1.062 | ||
| CD | –1.68*±0.54 | 3.36***±0.32 | 90.15 | 0.522 | 0.480 | 23.83 | 1.146 | ||
| Eq(6) | DBH2×H | –5.46***±0.69 | 1.15***±0.08 | 93.97 | 0.408 | 0.376 | 17.44 | 1.087 | |
| DBH2×CD | –4.17***±0.43 | 1.02***±0.05 | 96.70 | 0.302 | 0.278 | 09.62 | 1.047 | ||
| D202×H | –5.90***±0.76 | 1.15***±0.09 | 93.20 | 0.434 | 0.399 | 19.00 | 1.099 | ||
| D202×CD | –4.56***±0.50 | 1.02***±0.06 | 95.96 | 0.334 | 0.307 | 12.23 | 1.057 | ||
| Eq(7) | DBH2×H; CD | –4.34***±0.85 | 0.76***±0.22 | 1.23ns ±0.65 | 95.12 | 0.367 | 0.322 | 15.45 | 1.069 |
| D202×H; CD | –4.53**±1.02 | 0.73*±0.24 | 1.31ns ±0.71 | 94.41 | 0.393 | 0.345 | 17.22 | 1.080 | |
| Leaf biomass | |||||||||
| Eq(5) | DBH | –4.64***±0.65 | 2.17***±0.21 | 90.17 | 0.412 | 0.379 | 17.65 | 1.088 | |
| D20 | –5.09***±0.70 | 2.18***±0.21 | 89.93 | 0.417 | 0.383 | 17.95 | 1.091 | ||
| CD | –2.19*±0.47 | 2.62***±0.28 | 88.10 | 0.453 | 0.417 | 20.12 | 1.108 | ||
| Eq(6) | DBH2×H | –5.02***±0.74 | 0.88***±0.109 | 88.63 | 0.443 | 0.407 | 19.53 | 1.103 | |
| DBH2×CD | –4.04***±0.55 | 0.78***±0.07 | 91.60 | 0.381 | 0.350 | 15.59 | 1.075 | ||
| D202×H | –5.38***±0.79 | 0.88***±0.09 | 88.29 | 0.449 | 0.413 | 19.92 | 1.106 | ||
| D202×CD | –4.36***±0.58 | 0.78***±0.07 | 91.24 | 0.389 | 0.357 | 16.14 | 1.078 | ||
| Eq(7) | DBH2×H; CD | –3.85**±0.93 | 0.47ns ±0.24 | 1.30ns ±0.71 | 90.62 | 0.402 | 0.353 | 17.79 | 1.084 |
| D202×H; CD | –3.99**±1.06 | 0.46ns ±0.25 | 1.33ns ±0.74 | 90.25 | 0.410 | 0.359 | 18.29 | 1.088 | |
| D202×H; CD | –3.82***±0.52 | 0.84***±0.12 | 0.76ns ±0.36 | 97.09 | 0.201 | 0.176 | –0.285 | 1.020 | |
| Tiogo (Sahelo-Sudanian zone) | |||||||||
| Stem biomass | |||||||||
| Eq(5) | DBH | –5.11***±0.91 | 2.75***±0.28 | 89.44 | 0.348 | 0.318 | 12.54 | 1.062 | |
| D20 | –5.78***±1.10 | 2.82***±0.33 | 86.95 | 0.387 | 0.353 | 15.08 | 1.078 | ||
| CD | –0.74ns ±0.97 | 2.49***±0.54 | 64.93 | 0.634 | 0.579 | 26.94 | 1.223 | ||
| Eq(6) | DBH2×H | –5.58***±0.93 | 1.09***±0.11 | 90.10 | 0.337 | 0.308 | 11.77 | 1.058 | |
| DBH2×CD | –3.92**±0.95 | 0.93***±0.12 | 85.36 | 0.410 | 0.374 | 16.46 | 1.088 | ||
| D202×H | –6.18***±1.06 | 1.12***±0.12 | 88.67 | 0.360 | 0.329 | 13.38 | 1.067 | ||
| D202×CD | –4.37***±1.07 | 0.95***±0.13 | 83.71 | 0.432 | 0.395 | 17.74 | 1.098 | ||
| Eq(7) | DBH2×H; CD | –6.02***±1.20 | 1.23***±0.25 | –0.41ns ±0.66 | 89.44 | 0.348 | 0.301 | 13.28 | 1.062 |
| D202×H; CD | –6.56**±1.44 | 1.22**±0.28 | –0.30ns ±0.71 | 87.66 | 0.376 | 0.326 | 15.15 | 1.073 | |
| Branch biomass | |||||||||
| Eq(5) | DBH | –4.58***±0.85 | 2.80***±0.27 | 90.93 | 0.326 | 0.298 | 10.99 | 1.055 | |
| D20 | –5.32***±1.00 | 2.89***±0.29 | 89.49 | 0.351 | 0.321 | 12.75 | 1.064 | ||
| CD | –0.63ns ±0.66 | 2.83***±0.37 | 84.16 | 0.431 | 0.394 | 17.68 | 1.097 | ||
| Eq(6) | DBH2×H | –4.98***±0.94 | 1.11***±0.11 | 90.08 | 0.341 | 0.312 | 12.06 | 1.060 | |
| DBH2×CD | –3.63***±0.65 | 0.98***±0.08 | 93.30 | 0.280 | 0.256 | 07.35 | 1.040 | ||
| D202×H | –5.63***±1.03 | 1.14***±0.12 | 89.46 | 0.352 | 0.321 | 12.79 | 1.064 | ||
| D202×CD | –4.13***±0.73 | 1.00***±0.09 | 92.50 | 0.297 | 0.271 | 08.69 | 1.045 | ||
| Eq(7) | DBH2×H; CD | –3.77***±1.04 | 0.73***±0.22 | 1.10*±0.57 | 92.19 | 0.303 | 0.262 | 09.92 | 1.047 |
| D202×H; CD | –4.13**±1.19 | 0.74*±0.23 | 1.15ns ±0.59 | 91.80 | 0.310 | 0.269 | 10.52 | 1.049 | |
| Leaf biomass | |||||||||
| Eq(5) | DBH | –4.90***±1.07 | 2.23***±0.33 | 80.10 | 0.407 | 0.372 | 16.30 | 1.086 | |
| D20 | –5.31**±1.31 | 2.25***±0.38 | 74.64 | 0.459 | 0.419 | 19.19 | 1.111 | ||
| CD | –1.84*±0.66 | 2.29***±0.37 | 77.52 | 0.433 | 0.395 | 17.76 | 1.098 | ||
| Eq(6) | DBH2×H | –5.27***±1.11 | 0.89***±0.13 | 80.36 | 0.405 | 0.369 | 16.14 | 1.085 | |
| DBH2×CD | –4.18**±0.86 | 0.79***±0.10 | 83.41 | 0.372 | 0.339 | 14.11 | 1.072 | ||
| D202×H | –5.64**±1.30 | 0.89***±0.15 | 76.53 | 0.442 | 0.404 | 18.28 | 1.103 | ||
| D202×CD | –4.48**±1.01 | 0.79***±0.12 | 79.82 | 0.410 | 0.374 | 16.46 | 1.088 | ||
| Eq(7) | DBH2×H; CD | –4.11*±1.32 | 0.53*±0.28 | 1.05ns ±0.73 | 82.26 | 0.384 | 0.333 | 15.65 | 1.077 |
| D202×H; CD | –3.98*±1.57 | 0.45ns ±0.30 | 1.27ns ±0.77 | 79.97 | 0.408 | 0.354 | 17.11 | 1.087 | |
| Models selected as most appropriate are indicated in bold. | |||||||||
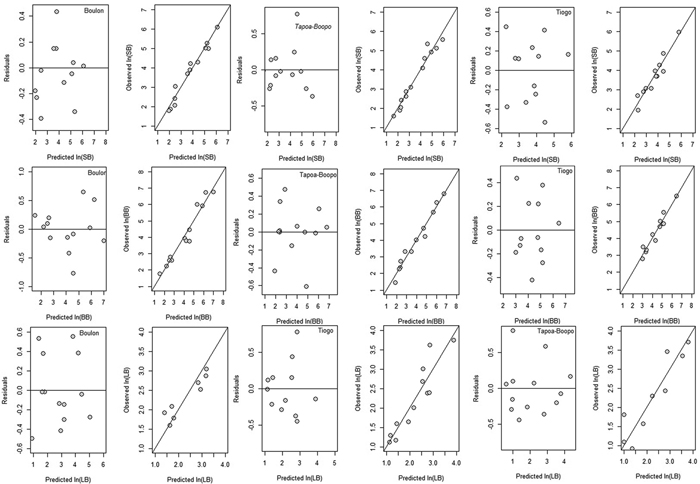
Fig. 2. Residuals and observed values versus predicted values of stem (SB), branch (BB) and leaf biomass (LB) for Boulon, Tapoa-Boopo and Tiogo forests, respectively. View larger in new window/tab.
3.2 Allometric models for estimating aboveground biomass
For each study site, nine allometric models were developed for aboveground biomass (AGB). Metrics for evaluation the performance of candidate allometric models developed for estimating AGB of D. mespiliformis in Burkina Faso are presented in Table 4. The adjusted coefficient of determination for the selected models was greater, explaining between 92.26–98.92% of the variance observed in the biomass. The AIC and RMSE values ranged from –9.02 to 21.76 and 0.119 to 0.425, respectively. In the three sites, DBH alone was the most suitable predictor variable than basal diameter and crown diameter for AGB (Table 3). Compared with model based on DBH as single predictor, adding tree total height to DBH as compound variable (DBH2× H) did not significantly improve the statistical fits (Table 4). However, addition of DBH to crown diameter and height as compound variable (DBH2 × H × CD) in Tiogo and Tapoa-Boopo reduced the RMSE, AIC and RSE and made further significant change except in Boulon where DBH provided greater adjusted R2, smaller RSE, smaller RMSE and smaller AIC (Table 3 and 4). Graphs of residuals (and observed values) versus predicted values of aboveground biomass for the selected models (Fig. 3) suggested homogeneity of residuals and y = x linear trend. These results indicate that the selected models were the most suitable and can be used to predict aboveground biomass of D. mespiliformis in the study area.
| Table 4. Site-specific allometric equations for estimating aboveground biomass of Diospyros mespiliformis in Burkina Faso. ln(β0), β1 and γ represent the intercept and regression coefficients of the models, and their respective standard errors. The indicators of performance for the models include the adjusted coefficient of determination (Adj.R2), residual standard error (RSE), root mean squared error (RMSE), Akaike information criterion (AIC) and correction factor (CF). View in new window/tab. |
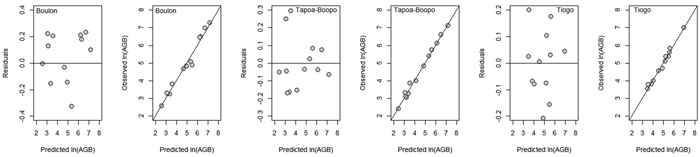
Fig. 3. Residuals and observed values versus predicted values of aboveground biomass (AGB) in Boulon, Tapoa-Boopo and Tiogo. View larger in new window/tab.
3.3 Performance of published models
Models developed in this study performed more accurately than published models for general purpose (Figs. 4a,4b,4c). The performance of models developed in this study was comparable to that of Brown (1997) in terms of RMSE. However, it had less mean prediction error and greater adjusted R2 (Fig. 4a). The model by Brown (1989) had the less RMSE but a greater mean prediction error (+97.18%; +80.34% ; and +60.92% for Tapoa-Boopo; Tiogo and Boulon respectively), while the models developed in this study presented comparatively a greater adjusted R2 and the lowest average systematic bias (+2.28%; +3.10% and –3.28% for Tiogo; Tapoa-Boopo and Boulon respectively). The comparison of model developed by Chave et al. (2014) with Brown’s model showed that Chave et al.’s model fitted the data more accurately than the model of Brown (1989), which leads to an overestimation of observed AGB (Figs. 4a,4b,4c). The model proposed by Jucker et al. (2017) was the least appropriate; it generally underestimated aboveground biomass with greater RMSE and average systematic bias. Compared to the model developed in this study, Brown’s model greatly overestimated the observed AGB, while the Jucker et al.’s underestimated it.
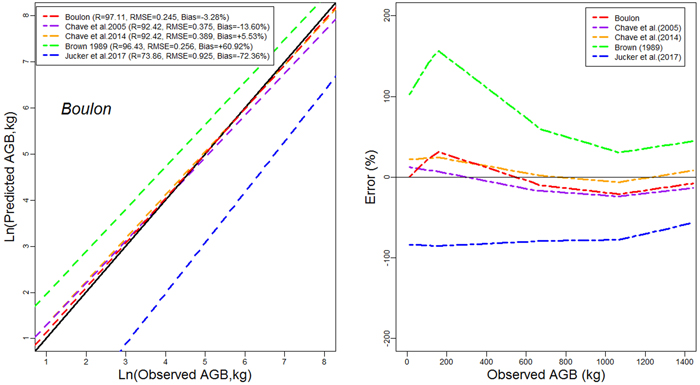
Fig. 4a. Comparison of models’ performances using the fitting dataset in Boulon. (left) Predicted and observed aboveground biomass values for the selected models. (right) Mean relative errors for the compared models across the observed aboveground biomass values. View larger in new window/tab.
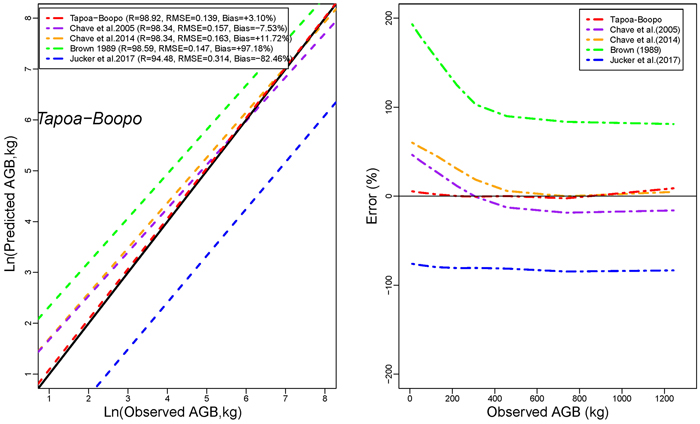
Fig. 4b. Comparison of models’ performances using the fitting dataset in Tapoa-Boopo. (left) Predicted and observed aboveground biomass values for the selected models. (right) Mean relative errors for the compared models across the observed aboveground biomass values. View larger in new window/tab.
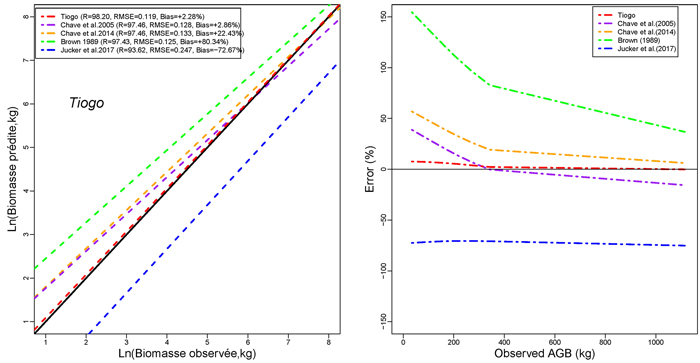
Fig. 4c. Comparison of models’ performances using the fitting dataset in Tiogo. (left) Predicted and observed aboveground biomass values for the selected models. (right) Mean relative errors for the compared models across the observed aboveground biomass values. View larger in new window/tab.
3.3 Carbon content of Diospyros mespiliformis tree components
Carbon content in aboveground components of Diospyros mespiliformis in Tiogo, Boulon and Tapoa-Boopo was 55.40% ± 1.50, 55.52% ± 1.06 and 55.63% ± 1.00, respectively, and did not vary significantly (P-value = 0.909). The Fig. 5 showed that stem had the largest carbon content in Tapoa-Boopo (56.24 ± 0.61%) and Tiogo (56.72 ± 0.27%) while in Boulon the largest carbon content is stored in branches (55.95 ± 0.07%). Leaves had the smallest amount of carbon content in the three sites (Fig. 5). The mean carbon stocks were 125.13 kg C tree–1(±164.9) in Boulon, 141.48 kg C tree–1(±15.74) in Tapoa-Boopo and 190.77 kg C tree–1(±19.84) in Tiogo.
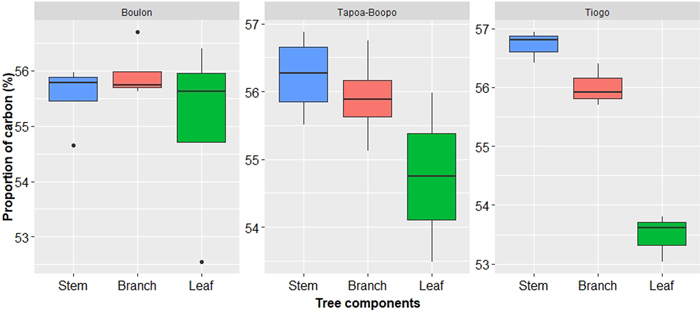
Fig. 5. Carbon content in Diospyros mespiliformis tree components (from 5 samples) in Boulon, Tapoa-Boopo and Tiogo forests.
4 Discussion
4.1 Allometric biomass components models
Several allometric models for estimating tree components’ biomass are used to describe the relationship between tree parameters and biomass (Kuyah et al. 2014; Mensah et al. 2016; Dimobe et al. 2018b). Power law model was used in this study to predict tree components’ biomass. This result is consistent with previous reports (Xiang et al. 2016; Dimobe et al. 2018a). The models tested to estimate the relationships between biomass and explanatory variables are of the log-log form, which have been shown to predict the biomass of woody species with great accuracy (Chaturvedi et al. 2013). Chave et al. (2005) pointed out that biological data are heteroskedastic and that it is necessary to log-transform the variables to comply with the conditions of normality and homoscedasticity. The explained variance of the fitted allometric models at stem, branch and leaf level, ranging from 81.41% to 98.92% and was smaller for leaf biomass models than for branch and stem biomass models, as also reported by Mensah et al. (2017) and Morote et al. (2012) in previous studies. These results indicate that foliage allometries are less responsive to tree size than are branch and stem allometries(Dimobe et al. 2018a). This is probably because leaves are more sensitive to light exposure than branches and stem (Antin et al. 2013). These results also showed that the predictors for biomass components were not the same in the three sites. DBH and height used as compound variable appears to be good predictor for stem biomass in Tapoa-Boopo and Tiogo (Sahelo-Sudanian zone) whereas in Boulon (Sudanian zone), the reliable predictor is basal diameter. This finding accords with that of Balima et al. (2019) who also found in Burkina Faso that basal diameter is a good predictor for the stem biomass of Afzelia Africana in the Sudanian zone whereas in Sahelo-Sudanian zone, it was basal diameter and height (D202× h), indicating that stem biomass vary according to climatic gradient. The somewhat smaller adjusted R2 values for component biomass in Sudanian zone compared to Sahelo-Sudanian zone seen in this study have also been reported by Balima et al (2019). The additional use of height and crown diameter in this study is expected to account for variation in biomass of trees having the same diameter. The inclusion of tree height as additional predictor in allometric models was studied by Picard et al. (2015) and Dimobe et al. (2018a). It helps accounting for variation in AGB among trees with same value of DBH (Picard et al. 2015), thus reducing the estimate errors (Chave et al. 2005). For instance, in this study, inclusion of tree height as additional predictor improved the models for stem biomass for both Tapoa-Boopo and Tiogo. Dimobe et al. (2018a) reported improved biomass models due to inclusion of tree height. Moreover, according to Mensah et al. (2017), the use of DBH2× H as compound variable helps avoiding collinearity issues while accounting for within species variation of height for a given value of DBH. Other authors recommend the use of wood density, crown diameter, and site as additional predictor variables to improve biomass prediction (Chave et al. 20005; Fayole et al. 2013; Ngomanda et al. 2014; Chave et al. 2014;). We found in this study that inclusion of crown diameter reduced the RMSE of branch and leaf biomass estimates and improved the goodness of fit for the three sites.
4.2 Aboveground biomass model
In this study, nine allometric models were tested for their relative performance in predicting aboveground biomass. These models were satisfactory for predicting the AGB with explained variance ranging from 87 to 95%. Among the candidate allometric models, only the one with DBH as single predictor in Boulon (Sudanian zone) and the compound variable (CD × DBH2× h) in Tapoa-Boopo and Tiogo (Sahelo-Sudanian zone) appeared to be the most suitable for estimating the total aboveground biomass of D. mespiliformis. This concurs with for instance, Balima et al (2019) who found that DBH is the reliable predictor of AGB of Afzelia africana in the Sudanian zone of Burkina Faso while in the Sahelo-Sudanian zone it is DBH2× CD. The difference in terms of predictors used in the two climatic zones might be due to rainfall impact on growth and morphology on individual trees of D. mespiliformis. In Boulon, the model with DBH as single predictor produced greater adjusted coefficient of determination (R2= 97.11%) compared to the other predictors. This finding is in line with previous study that showed that DBH is the most commonly used independent variable (Henry et al. 2011; Mbow et al. 2013; Vahedi et al. 2014) since it is the easiest tree variable to measure. However, according to other authors such as Alvarez et al. (2012), models based on DBH only may underestimate the aboveground biomass and may show uncertainty. In Tapoa-Boopo and Tiogo, it was expected that the addition of tree height and crown diameter to DBH will improve the estimates of the allometric models. To account for that, the inclusion of tree height, crown diameter and DBH (CD × DBH2× h) in the allometric models as a compound predictor reduced the RMSE, RSE and AIC, and produced greater adjusted R² in Tapoa-Boopo and Tiogo. Although the differences were small, the selected biomass models with CD × DBH2× h as compound variable performed slightly more accurately in terms of adjusted R2, RSE, RMSE and AIC than the model with DBH alone.
4.3 Comparison with previously published models
We compared the models developed in this study with four previously published models developed by Brown et al. (1989), Chave et al. (2005), Chave et al. (2014), and Jucker et al. (2017). We choose these models for comparison with our own model because they are commonly used for biomass estimation in Burkina Faso by previous studies (Qasim et al. 2016; Dimobe et al. 2018d; Dimobe et al. 2019). The general lack of agreement between the models developed for D. mespiliformis in this study and the generic models, can only be viewed as discouraging. Actually, the previously published models of Brown et al. (1989), Chave et al. (2005), Chave et al. (2014), and Jucker et al. (2017) are not wrong; they are simply not right for this species or the study sites. Ducey et al. (2009) made similar observation in the eastern Amazon and found errors from –33% to +29% that occurred when using off-site relationships, indicating that site- and species specific allometric models differ with species, tree status, climate and soil (Zianis and Mencuccini 2004), and are generally preferred over generic allometric models (Montagu et al. 2005). Kim et al. (2011), in their study, emphasize that the site-specific allometric models are more accurate in predicting the forest biomass estimates on the local level as they take into account the site effects. Among the previous published models used in this study, Brown’s model greatly overestimated the observed AGB when applied to our dataset, while the Jucker et al.’s model underestimated it. This suggests that the models developed in this study are adequate for AGB estimation for D. mespiliformis in Burkina Faso. The previous published models were widely used because of the great goodness of fit to the sample data used to develop them (Nath et al. 2019). The limitation of these site-specific models inherent to the cost of biomass measurement and they are generally based on a small sample size.
4.4 Carbon stock
In this study, the predicted values of carbon content are greater compared to the one (0.5) which was recognized as an acceptable average to be used as conversion factor (Sarmiento et al. 2005; Redondo-Brenes 2007). Hence, the application of the recommended value would underestimate the value of carbon content in leaf biomass, branch biomass, stem biomass and AGB. Our findings are consistent to the observation in Central Panama (Elias and Potvin 2003), Costa Rica (Fonseca et al. 2012), and in Burkina Faso (Bayen et al. 2015; Dimobe et al. 2018a) where authors detected underestimations of aboveground carbon when the recommended value of carbon, 0.5, is used or applied. Furthermore, our results revealed that the average carbon content varied among the different parts of the tree. It has been reported that carbon content of tree components was dependent on the ash content which in turn, depends on the amount of structural components (Negi et al. 2003). The carbon content in stems of D. mespiliformis, was slightly greater than the amount in branches and leaves. This can be explained by the fact that woody tissues of trunk, roots, branches and twigs were greater carbon content pools than soft tissues of leaves, flowers and fine roots (Kraenzel et al. 2003). The results are also in conformity with findings by Fonseca et al. (2012),Wani and Qaisar (2014), Bayen et al. (2015) and Dimobe et al. (2018a).
5 Conclusion
To our knowledge, this is the first attempt to develop site-specific allometric models for Diospyros mespiliformis in Burkina Faso. Diameter at breast height alone is a good predictor of AGB in Boulon forest (Sudanian climatic zone), while in Tapoa-Boopo and Tiogo forests (Sahelo-Sudanian climatic zone), the inclusion of crown diameter and height are required to improve the AGB predictions. The models developed in this study can be used accurately to estimate the aboveground and tree components biomass in similar environments (climatic zones). The applicability of these models is therefore restricted to the climatic zones and range of data covered by trees used in this study. The results revealed also that D. mespiliformis contains greater amount of carbon than the reference value suggested by the IPCC, indicating a greater potential for carbon sequestration for mitigating adverse effects of climate change over large areas of West African savannas.
Acknowledgments
This work was financially supported by the Ministry of Environment, Green Economy and Climate Change of Burkina Faso, Forest Investment Program (PIF) and African Climate Change Fellowship Program (ACCFP). Special thanks to the staff of Boulon, Tapoa-Boopo and Tiogo forests for logistical support during the field work, and to Alain Bambara, Ahmed Sangaré, Sibiri Sory, Nekilbié Bationo, Bapounguini Tandanba and Sidiki Belemgnegré for their help in the field and laboratory. We would like to express our appreciation to two anonymous reviewers for their constructive comments that helped to substantially improve an earlier version of this manuscript.
References
Allen S.E., Grimshaw H.M., Rowland A.P. (1986). Chemical analysis. In: Methods in plant ecology. Moore P.D., Chapman S.B. (eds.). p. 285–344.
Alvarez E., Duque A., Saldarriaga J., Cabrera K., de Las Salas G., del Valle I., Lema A., Moreno F., Orrego S., Rodríguez L. (2012). Tree above-ground biomass allometries for carbon stocks estimation in the natural forests of Colombia. Forest Ecology and Management 267: 297–308. https://doi.org/10.1016/j.foreco.2011.12.013.
Antin C., Pélissier R., Vincent G., Couteron P. (2013). Crown allometries are less responsive than stem allometry to tree size and habitat variations in an Indian monsoon forest. Trees 27(5): 1485–1495. https://doi.org/10.1007/s00468-013-0896-7.
Arbonnier M. (2002). Arbres, arbustes et lianes des zones sèches d’Afrique de l’Ouest. [Trees, shrubs and lianas of West African dry zones]. Editions Quae.
Baker T.R., Phillips O.L., Malhi Y., Almeida S., Arroyo L., Di Fiore A., Erwin T., Killeen T.J., Laurance S.G., Laurance W.F. (2004). Variation in wood density determines spatial patterns inAmazonian forest biomass. Global Change Biology 10(5): 545–562. https://doi.org/10.1111/j.1365-2486.2004.00751.x.
Balima L.H., Nacoulma B.M.I., Bayen P., Dimobe K., Kouamé F.N.G., Thiombiano A. (2019). Aboveground biomass allometric equations and distribution of carbon stocks of the African oak (Afzelia africana Sm.) in Burkina Faso. Journal of Forestry Research. 13 p. https://doi.org/10.1007/s11676-019-00955-4.
Baskerville G. (1972). Use of logarithmic regression in the estimation of plant biomass. Canadian Journal of Forest Research 2(1): 49–53. https://doi.org/10.1139/x72-009.
Bayen P., Bognounou F., Lykke A.M., Ouédraogo M., Thiombiano A. (2015). The use of biomass production and allometric models to estimate carbon sequestration of Jatropha curcas L. plantations in western Burkina Faso. Environment, Development and Sustainability 18: 143–156. https://doi.org/10.1007/s10668-015-9631-4.
Bernard F., Minang P.A., Adkins B., Freund J.T. (2014). REDD+ projects and national-level Readiness processes: a case study from Kenya. Climate Policy 14(6): 788–800. https://doi.org/10.1080/14693062.2014.905440.
Brown S. (1997). Estimating biomass and biomass change of tropical forests: a primer. FAO Forestry Paper 134. ISBN 92-5-103955-0.
Brown S., Gillespie A.J.R., Lugo A.E. (1989). Biomass estimation methods for tropical forests with applications to forest inventory data. Forest Science 35(4): 881–902. https://doi.org/10.1093/forestscience/35.4.881.
Brown S.L., Schroeder P., Kern J.S. (1999). Spatial distribution of biomass in forests of the eastern USA. Forest Ecology and Management 123(1): 81–90. https://doi.org/10.1016/S0378-1127(99)00017-1.
Burnham K.P., Anderson D.R. (2002). Model selection and multimodel inference: a practical information-theoretic approach. Springer Science & Business Media, New York.
Chaturvedi R.K., Raghubanshi A.S. (2013). Aboveground biomass estimation of small diameter woody species of tropical dry forest. New Forests 44(4): 509–519. https://doi.org/10.1007/s11056-012-9359-z.
Chavan B.L., Rasal G.B. (2011). Potentiality of carbon sequestration in six year ages young plant from University campus of Aurangabad. Global Journal of Research In Engineering 11(7): 14–20.
Chave J., Condit R., Aguilar S., Hernandez A., Lao S., Perez R. (2004). Error propagation and scaling for tropical forest biomass estimates. Philosophical Transactions of the Royal Society of London. Series B: Biological Sciences 359 (1443): 409–420. https://doi.org/10.1098/rstb.2003.1425.
Chave J., Andalo C., Brown S., Cairns M.A., Chambers J.Q., Eamus D., Fölster H., Fromard F., Higuchi N., Kira T., Lescure J.P., Nelson B.W., Ogawa H., Puig H., Riéra B., Yamakura T. (2005). Tree allometry and improved estimation of carbon stocks and balance in tropical forests. Oecologia 145: 87–99. https://doi.org/10.1007/s00442-005-0100-x.
Chave J., Réjou-Méchain M., Búrquez A., Chidumayo E., Colgan M.S., Delitti W.B.C., Duque A., Eid T., Fearnside P.M., Goodman R.C., Henry M., Martínez-Yrízar A., Mugasha W.A., Muller-Landau H.C., Mencuccini M., Nelson B.W., Ngomanda A., Nogueira E.M., Ortiz-Malavassi E., Pélissier R., Ploton P., Ryan C.M., Saldarriaga J.G., Vieilledent G. (2014). Improved allometric models to estimate the aboveground biomass of tropical trees. Global Change Biology 20(10): 3177–3190. https://doi.org/10.1111/gcb.12629.
Dimobe K., Goetze D., Ouédraogo A., Mensah S., Akpagana K., Porembski S., Thiombiano A. (2018a). Aboveground biomass allometric equations and carbon content of the shea butter tree (Vitellaria paradoxa C.F. Gaertn., Sapotaceae) components in Sudanian savannas (West Africa). Agroforestry Systems 93: 1119–1132. https://doi.org/10.1007/s10457-018-0213-y.
Dimobe K., Mensah S., Goetze D., Ouédraogo A., Kuyah S., Porembski S., Thiombiano A. (2018b). Aboveground biomass partitioning and additive models for Combretum glutinosum and Terminalia laxiflora in West Africa. Biomass and Bioenergy 115: 151–159. https://doi.org/10.1016/j.biombioe.2018.04.022.
Dimobe K., Kouakou J., Tondoh J., Zoungrana B., Forkuor G., Ouédraogo K. (2018c). Predicting the potential impact of climate change on carbon stock in semi-arid West African savannas. Land 7(4) article 124. 21 p. https://doi.org/10.3390/land7040124.
Dimobe K., Tondoh J.E., Weber J.C., Bayala J., Ouédraogo K., Greenough K. (2018d). Farmers’ preferred tree species and their potential carbon stocks in southern Burkina Faso: implications for biocarbon initiatives. PloS One 13(12) article e0199488. 21 p. https://doi.org/10.1371/journal.pone.0199488.
Dimobe K., Kuyah S., Dabré Z., Ouédraogo A., Thiombiano A. (2019). Diversity-carbon stock relationship across vegetation types in W National park in Burkina Faso. Forest Ecology and Management 438: 243–254. https://doi.org/10.1016/j.foreco.2019.02.027.
Ducey M.J., Zarin D.J., Vasconcelos S.S., Araújo M.M. (2009). Biomass equations for forest regrowth in the eastern Amazon using randomized branch sampling. Acta Amazonica 39(2): 349–360. https://doi.org/10.1590/S0044-59672009000200013.
Elias M., Potvin C. (2003). Assessing inter-and intra-specific variation in trunk carbon concentration for 32 neotropical tree species. Canadian Journal of Forest Research 33(6): 1039–1045. https://doi.org/10.1139/x03-018.
Fayolle A., Doucet J.-L., Gillet J.-F., Bourland N., Lejeune P. (2013). Tree allometry in Central Africa: testing the validity of pantropical multi-species allometric equations for estimating biomass and carbon stocks. Forest Ecology and Management 305: 29–37. https://doi.org/10.1016/j.foreco.2013.05.036.
Fonseca W., Alice F.E., Rey-Benayas J.M. (2012). Carbon accumulation in aboveground and belowground biomass and soil of different age native forest plantations in the humid tropical lowlands of Costa Rica. New Forests 43(2): 197–211. https://doi.org/10.1007/s11056-011-9273-9.
Galidaki G., Zianis D., Gitas I., Radoglou K., Karathanassi V., Tsakiri–Strati M., Woodhouse I., Mallinis G. (2017). Vegetation biomass estimation with remote sensing: focus on forest and other wooded land over the Mediterranean ecosystem. International Journal of Remote Sensing 38 (7): 1940–1966. https://doi.org/10.1080/01431161.2016.1266113.
Guinko S. (1984). Végétation de la Haute-Volta. [Vegetation of the Haute-Volta]. Bordeaux III.
Henry M., Picard N., Trotta C., Manlay R.J., Valentini R., Bernoux M., Saint-André L. (2011). Estimating tree biomass of sub-Saharan African forests: a review of available allometric equations. Silva Fennica 45(3B): 477–569. https://doi.org/10.14214/sf.38.
Hollinger D.Y. (2008). Defining a landscape-scale monitoring tier for the North American Carbon Program. Field Measurements for Forest Carbon Monitoring. Springer, Dordrecht. 13 p.
IPCC (2006). Guidelines for national greenhouse gas inventories. Institute for Global Environmental Strategies, Japan. https://www.ipcc-nggip.iges.or.jp/public/2006gl/index.html.
Jana B.K., Biswas S., Majumder M., Roy P.K., Mazumdar A. (2009). Comparative assessment of carbon sequestration rate and biomass carbon potential of young Shorea robusta and Albizzia lebbek. Journal of Hydro-Climatic Engineering 1(2):1–15.
Jucker T., Caspersen J., Chave J., Antin C., Barbier N., Bongers F., Dalponte M., van Ewijk K.Y., Forrester D.I., Haeni M. (2017). Allometric equations for integrating remote sensing imagery into forest monitoring programmes. Global Change Biology 23(1): 177–190. https://doi.org/10.1111/gcb.13388.
Keith H., Mackey B.G., Lindenmayer D.B. (2009). Re-evaluation of forest biomass carbon stocks and lessons from the world’s most carbon-dense forests. Proceedings of the National Academy of Sciences 106(28): 11635–11640. https://doi.org/10.1073/pnas.0901970106.
Kraenzel M., Castillo A., Moore T., Potvin C. (2003). Carbon storage of harvest-age teak (Tectona grandis) plantations, Panama. Forest Ecology and Management 173(1–3): 213–225. https://doi.org/10.1016/S0378-1127(02)00002-6.
Kuyah S., Dietz J., Muthuri C., Jamnadass R., Mwangi P., Coe R., Neufeldt H. (2012). Allometric equations for estimating biomass in agricultural landscapes: II. belowground biomass. Agriculture, Ecosystems & Environment 158: 225–234. https://doi.org/10.1016/j.agee.2012.05.010.
Kuyah S., Dietz J., Muthuri C., van Noordwijk M., Neufeldt H. (2013). Allometry and partitioning of above- and below-ground biomass in farmed eucalyptus species dominant in Western Kenyan agricultural landscapes. Biomass and Bioenergy 55: 276–284. https://doi.org/10.1016/j.biombioe.2013.02.011.
Kuyah S., Sileshi G.W., Njoloma J., Mng’omba S., Neufeldt H. (2014). Estimating aboveground tree biomass in three different miombo woodlands and associated land use systems in Malawi. Biomass and Bioenergy 66: 214–222. https://doi.org/10.1016/j.biombioe.2014.02.005.
MacFarlane D.W., Kuyah S., Mulia R., Dietz J., Muthuri C., Van Noordwijk M. (2014). Evaluating a non-destructive method for calibrating tree biomass equations derived from tree branching architecture. Trees 28: 807–817. https://doi.org/10.1007/s00468-014-0993-2.
Mbow C., Verstraete M.M., Sambou B., Diaw A.T., Neufeldt H. (2013). Allometric models for aboveground biomass in dry savanna trees of the Sudan and Sudan–Guinean ecosystems of Southern Senegal. Journal of Forest Research 19(3): 340–347. https://doi.org/10.1007/s10310-013-0414-1.
Mensah S., Veldtman R., Du Toit B., Glèlè Kakaï R., Seifert T. (2016). Aboveground biomass and carbon in a South African mistbelt forest and the relationships with tree species diversity and forest structures. Forests 7(4): 1–17. https://doi.org/10.3390/f7040079.
Mensah S., Veldtman R., Seifert T. (2017). Allometric models for height and aboveground biomass of dominant tree species in South African Mistbelt forests. Southern Forests: a Journal of Forest Science 79(1): 19–30. https://doi.org/10.2989/20702620.2016.1225187.
Meyer T., D’Odorico P., Okin G.S., Shugart H.H., Caylor K.K., O’Donnell F.C., Bhattachan A., Dintwe K. (2014). An analysis of structure: biomass structure relationships for characteristic species of the western Kalahari, Botswana. African Journal of Ecology 52(1): 20–29. https://doi.org/10.1111/aje.12086.
Montagu K.D., Düttmer K., Barton C.V.M., Cowie A.L. (2005). Developing general allometric relationships for regional estimates of carbon sequestration—an example using Eucalyptus pilularis from seven contrasting sites. Forest Ecology and Management 204(1): 115–129. https://doi.org/10.1016/j.foreco.2004.09.003.
Morote F.A.G., Serrano F.R.L., Andrés M., Rubio E., Jiménez J.L.G., de las Heras J. (2012). Allometries, biomass stocks and biomass allocation in the thermophilic Spanish juniper woodlands of Southern Spain. Forest Ecology and Management 270: 85–93. https://doi.org/10.1016/j.foreco.2012.01.007.
Nath A.J., Tiwari B.K., Sileshi G.W., Sahoo U.K., Brahma B., Deb S., Devi N.B., Das A.K., Reang D., Chaturvedi S.S. (2019). Allometric models for estimation of forest biomass in North East India. Forests 10(2): 103. https://doi.org/10.3390/f10020103.
Návar J. (2009). Biomass component equations for Latin American species and groups of species. Annals of Forest Science 66(2): 1–21. https://doi.org/10.1051/forest/2009001.
Negi J.D.S., Manhas R.K., Chauhan P.S. (2003). Carbon allocation in different components of some tree species of India: a new approach for carbon estimation. Current Science 85(11): 1528–1531. https://www.jstor.org/stable/24110013.
Ngomanda A., Engone Obiang N., Lebamba J., Moundounga Mavouroulou Q., Gomat H., Mankou G., Loumeto J., Midoko Iponga D., Kossi Ditsouga F., Zinga Koumba R. (2014). Site specific versus pantropical allometric equations: which option to estimate the biomass of a moist central African forest? Forest Ecology and Management 312: 1–9. https://doi.org/10.1016/j.foreco.2013.10.029.
Pan Y., Birdsey R.A., Fang J., Houghton R., Kauppi P.E., Kurz W.A., Phillips O.L., Shvidenko A., Lewis S.L., Canadell J.G., Ciais P., Jackson R.B., Pacala S.W., McGuire A.D., Piao S., Rautiainen A., Sitch S., Hayes D. (2011). A large and persistent carbon sink in the world’s forests. Science 333(6045): 988–993. https://doi.org/10.1126/science.1201609.
Peichl M., Arain M.A. (2006). Above-and belowground ecosystem biomass and carbon pools in an age-sequence of temperate pine plantation forests. Agricultural and Forest Meteorology 140(1–4): 51–63. https://doi.org/10.1016/j.agrformet.2006.08.004.
Picard N., Boyemba Bosela F., Rossi V. (2015). Reducing the error in biomass estimates strongly depends on model selection. Annals of Forest Science 72(6): 811–823. https://doi.org/10.1007/s13595-014-0434-9.
Ploton P., Barbier N., Momo S.T., Réjou-Méchain M., Boyemba Bosela F., Chuyong G.B., Dauby G., Droissart V., Fayolle A., Goodman R.C. (2016). Closing a gap in tropical forest biomass estimation: taking crown mass variation into account in pantropical allometries. Biogeosciences 13: 1571–1585. https://doi.org/10.5194/bg-13-1571-2016.
Qasim M., Porembski S., Sattler D., Stein K., Thiombiano A., Lindner A. (2016). Vegetation structure and carbon stocks of two protected areas within the South-Sudanian Savannas of Burkina Faso, West Africa. Environments 3(4): 1–16. https://doi.org/10.20944/preprints201608.0154.v1.
Qureshi A., Badola R., Hussain S.A. (2012). A review of protocols used for assessment of carbon stock in forested landscapes. Environmental Science & Policy 16: 81–89. https://doi.org/10.1016/j.envsci.2011.11.001.
R Core Team (2018). R: a language and environment for statistical computing. R Foundation for Statistical Computing.
Redondo-Brenes A. (2007). Growth, carbon sequestration, and management of native tree plantations in humid regions of Costa Rica. New Forests 34(3): 253–268. https://doi.org/10.1007/s11056-007-9052-9.
Sarmiento G., Pinillos M., Garay I. (2005). Biomass variability in tropical American lowland rainforests. Ecotropicos 18(1): 1–20.
Sawadogo L., Savadogo P., Tiveau D., Dayamba S.D., Zida D., Nouvellet Y., Oden P.C., Guinko S. (2010). Allometric prediction of above-ground biomass of eleven woody tree species in the Sudanian savanna-woodland of West Africa. Journal of Forestry Research 21: 475–481. https://doi.org/10.1007/s11676-010-0101-4.
Shirima D.D., Munishi P.K.T., Lewis S.L., Burgess N.D., Marshall A.R., Balmford A., Swetnam R.D., Zahabu E.M. (2011). Carbon storage, structure and composition of miombo woodlands in Tanzania’s Eastern Arc Mountains. African Journal of Ecology 49(3): 332–342. https://doi.org/10.1111/j.1365-2028.2011.01269.x.
Sierra C.A., del Valle J.I., Orrego S.A., Moreno F.H., Harmon M.E., Zapata M., Colorado G.J., Herrera M.A., Lara W., Restrepo D.E. (2007). Total carbon stocks in a tropical forest landscape of the Porce region, Colombia. Forest Ecology and Management 243(2–3): 299–309. https://doi.org/10.1016/j.foreco.2007.03.026.
Sileshi G.W. (2014). A critical review of forest biomass estimation models, common mistakes and corrective measures. Forest Ecology and Management. 329: 237–254. https://doi.org/10.1016/j.foreco.2014.06.026.
Vahedi A.A., Mataji A., Babayi-Kafaki S., Eshaghi-Rad J., Hodjati S.M., Djomo A. (2014). Allometric equations for predicting aboveground biomass of beech-hornbeam stands in the Hyrcanian forests of Iran. Journal of Forest Science 60(6): 236–247. https://doi.org/10.17221/39/2014-JFS.
Wani N.R., Qaisar K.N. (2014). Carbon percent in different components of tree species and soil organic carbon pool under these tree species in Kashmir valley. Current World Environment 9(1): 174–181. https://doi.org/10.12944/CWE.9.1.24.
Xiang W., Zhou J., Ouyang S., Zhang S., Lei P., Li J., Deng X., Fang X., Forrester D.I. (2016). Species-specific and general allometric equations for estimating tree biomass components of subtropical forests in southern China. European Journal of Forest Research 135(5): 963–979.
Zianis D., Mencuccini M. (2004). On simplifying allometric analyses of forest biomass. Forest Ecology and Management 187(2–3): 311–332. https://doi.org/10.1016/j.foreco.2003.07.007.
Total of 67 references.
