Joanne C. White 
Characterizing forest recovery following stand-replacing disturbances in boreal forests: contributions of optical time series and airborne laser scanning data
White J. C. (2024). Characterizing forest recovery following stand-replacing disturbances in boreal forests: contributions of optical time series and airborne laser scanning data. Silva Fennica vol. 58 no. 2 article id 23076. https://doi.org/10.14214/sf.23076
Highlights
- Remote sensing contributions to monitoring of post-disturbance forest recovery in the boreal are synthesized
- Definitions of forest recovery need to be clear and measurable and will vary by application
- Landsat time series represent a significant innovation in recovery assessments, but the boreal biome is underrepresented in this research
- Opportunities for future research directions and priorities are highlighted.
Abstract
The success and rate of forest regeneration following disturbance has implications for sustainable forest management, climate change mitigation, and biodiversity, among others. Systematic monitoring of forest regeneration over large and often remote areas of the boreal forest is challenging. The use of remotely sensed data to characterize post-disturbance recovery in the boreal forest has been an active research topic for more than 30 years. Innovations in sensors, data policies, curated data archives, and increased computational power have enabled new insights into the characterization of post-disturbance forest recovery, particularly following stand-replacing disturbances. Landsat time series data have emerged as an important data source for post-disturbance forest recovery assessments, with Landsat’s 40-year archive of 30-m resolution data providing consistent observations on an annual time step and enabling retrospective capacity to establish spatially explicit recovery baselines. The application of remote sensing for monitoring post-disturbance forest recovery is a rapidly growing area of research globally; however, despite the large amount of disturbance and the disproportionate effects of climate change in the boreal, the boreal biome is relatively underrepresented in the remote sensing forest recovery literature. Herein, the past and present contributions of optical time series and airborne laser scanning data to the characterization of forest recovery in boreal forests are highlighted, and future research priorities are identified.
Keywords
regeneration;
fire;
time series;
Landsat;
harvest;
forest change
-
White,
Canadian Forest Service, Pacific Forestry Centre, Natural Resources Canada, 506 West Burnside Road, Victoria, B.C., V8Z 1M5, Canada
 https://orcid.org/0000-0003-4674-0373
E-mail
joanne.white@nrcan-rncan.gc.ca
https://orcid.org/0000-0003-4674-0373
E-mail
joanne.white@nrcan-rncan.gc.ca
Received 14 December 2023 Accepted 18 March 2024 Published 4 April 2024
Views 78905
Available at https://doi.org/10.14214/sf.23076 | Download PDF

1 Introduction
The capacity to monitor forests in a manner that is scientifically informed, consistent, repeatable, and transparent is paramount. Forest monitoring is defined by the International Union of Forest Research Organizations as the periodic measurement of forest parameters for establishing baselines and for detecting and quantifying changes in forests over time (Päivinen et al. 1994). Forest monitoring is “viewed as a comprehensive process that includes the systematic collection, analysis, and dissemination of forest-related data, and the derivation of information or knowledge at regular intervals to allow for the monitoring of changes over time” (FAO 2017). As both forest disturbances and their subsequent recovery have important impacts on regional and global forest carbon budgets, both processes are key targets of forest monitoring programs. The frequency and intensity of natural disturbances are being altered by climate change (Dale et al. 2001), as is the rate and effectiveness of post-disturbance forest regrowth (Anderson-Teixeira et al. 2013). To capture and quantify these evolving trends, it is essential to have baseline information on both forest disturbance and recovery.
Fundamentally, one of the greatest challenges to forest monitoring over large areas is that of observation capacity. For example, field surveys are typically the primary information source for regeneration assessments, but they can be subjective, are constrained in space and time, and often focus on post-harvest recovery (Bartels et al. 2016). Forest monitoring is becoming increasingly reliant on remotely sensed data. In the Global Forest Resource Assessment of the FAO in 2015, 70% of reporting nations used some form of remotely sensed data in their national forest inventories (Barrett et al. 2016). However, remote sensing is not a panacea, with recent attempts to characterize global forest change having falsely equated change in tree cover as change in forest area, thereby ignoring the important processes of regeneration and reforestation (Guindon et al. 2018). Synoptic remotely sensed data is well suited to disturbance detection over large areas, especially stand replacing disturbances, which are punctual in both space and time, and for this reason, remote sensing science has long focused on accurately characterizing forest disturbance (Hermosilla et al. 2016). However, as more and more earth observation data are acquired and archived, new opportunities for forest monitoring are emerging that allow both disturbance and recovery to be characterized.
The rate of forest recovery is required to inform forest management, monitoring, and reporting activities. Delayed recovery can have broad implications for sustainable forest management, policy, and science, resulting in a need for spatially-explicit, large-area, characterizations of forest recovery (Frolking et al. 2009; Pugh et al. 2019). As forest recovery is a process and not a state, the structure, composition, and function of forests will typically return gradually over time through successional processes (Oliver and Larson 1996). The absence of a universally accepted definition for forest recovery (Bartels et al. 2016) implies that the timing of when a forest is considered recovered hinges on the specific definition adopted and the information requirements of the particular application (White et al. 2019a). For example, a silvicultural definition of recovery may specify the stocking densities of well-spaced trees and may also include requirements for specific tree species (Franklin et al. 2002). Alternatively, a land reclamation definition of recovery may be limited to the re-establishment of herbaceous vegetation at a site (McKenna et al. 2020). Recovery definitions for other ecosystem goods and services, such as habitat, may focus more on forest function (Amiro et al. 2010; Kearney et al. 2019). Precise definitions of forest recovery are essential as they facilitate the establishment of measurable indicators. This, in turn, allows for objective assessments of forest recovery that remain unaffected by evolving perceptions of naturalness over time. In the context of remote sensing research however, forest recovery is typically not clearly defined, or there may be a poor understanding of the linkage between what is being measured spectrally, and what is happening on the ground post-disturbance. The lack of a universal definition of forest recovery remains one of the greatest challenges to the application of remotely sensed data for forest recovery assessments.
For a country the size of Canada, which has a large and diverse forest area, and wherein each province or territory is vested with the responsibility for forest management, monitoring post-disturbance forest recovery is particularly challenging. Requirements, data sources, and methods used for regeneration surveys are not nationally consistent, nor do they focus equally on areas impacted by harvesting and wildfire (Brand et al. 1991). Other jurisdictions likewise face similar challenges. Given this, there is a need for nationally consistent observations of forest recovery to support, science, management, and reporting needs. These data must be synoptic, spatially explicit, and spatially detailed so that the impacts of anthropogenic changes on the landscape can be captured. Such data enables a quantitative and objective assessment of recovery that comes with a permanent spatial record (i.e., a map).
The objective of this review was to synthesize research on the past and current applications of remotely sensed data, specifically optical time series and airborne laser scanning data, to characterize post-disturbance forest recovery in boreal forest environments. Monitoring of post-disturbance forest recovery with remotely sensed data is a rapidly expanding area of research and Landsat time series (LTS) data in particular have enabled innovations in the characterization of forest disturbance and subsequent recovery. Insights gained from past and current studies are highlighted and used to identify future research priorities and directions.
2 The importance of Landsat time series data for recovery assessments
Of the remotely sensed data sources available to support forest recovery assessments, the data source that most fully satisfies the requirements of a national monitoring context are time series of earth observation data from sensors such as Landsat and Sentinel-2 (Kennedy et al. 2012). Landsat data in particular offer many advantages for recovery monitoring: open access since 2008 (Woodcock et al. 2008), a spatial resolution capable of capturing anthropogenic impacts on the landscape (30 m) since 1984 (Wulder et al. 2022), a temporal resolution (i.e., 8-day revisit) that enables annual best-available pixel composites within the growing season (Wulder et al. 2019), a curated archive (Wulder et al. 2016), investment in sensor cross-calibration that ensures radiometric fidelity across sensors (Markham and Helder 2012), and automated pre-processing tools and analysis ready data products (i.e., surface reflectance; Dwyer et al. 2018).
The change of data policy that resulted in the opening of the Landsat archive in 2008, whereby data were made freely and openly available for download, combined with advances in computational power, have resulted in a significant innovation in remote sensing science (Banskota et al. 2014), and have transformed approaches to the use of these data in two important ways. First, we are no longer limited to selecting the best available image and can now utilize the best available observation for any given pixel within an image to generate best-available pixel composites (Griffiths et al. 2013; White et al. 2014). These approaches provide cloud-free observations over large areas, enabling increased opportunities for forest monitoring. Second, free and open access to the Landsat archive allows us to take full advantage of the temporal dimension (Zhu 2017). Analytical approaches that use dense stacks of repeat Landsat observations acquired over time have advanced remote sensing science, enabling the characterization of a broader range of change types and magnitudes, as well as pre- and post-change conditions (Vogelmann et al. 2012; Coops et al. 2020). For forest recovery monitoring specifically, LTS data offer many advantages: consistent observations on an annual (or semi-annual) time step; retrospective capacity for establishing recovery baselines (i.e., pre-disturbance state; Potapov et al. 2018; White et al. 2022); and integration with other data sources, such as field plots or airborne laser scanning (ALS) data into a monitoring framework (Bolton et al. 2015; White et al. 2018; Shvetsov et al. 2019).
3 Early research on the application of remote sensing for boreal forest recovery assessments
Prior to the free and open availability of Landsat data in 2008, numerous studies had investigated forest recovery in boreal forests (Table 1). All studies focused on post-fire recovery exclusively and used the Normalized Difference Vegetation Index (NDVI; Tucker 1979) or a similar index (i.e. Enhanced Vegetation Index, EVI, Huete et al. 2002), which are based on red and near-infrared wavelengths. Exceptions were the study of Epting and Verbyla (2005), which used both NDVI and the Normalized Burn Ratio (NBR, Key and Benson 2006), and Cuevez-Gonzalez et al. (2013), which used NDVI and the Normalized Difference Shortwave Infrared Reflectance index (NDSWIR, Gerard et al. 2003). Definitions of recovery were typically not explicit in these studies; recovery was characterized as the return of a specified indicator to pre-fire levels, often without an associated ecological expectation (e.g., the return of trees) articulated. Pre-fire baselines were either determined based on pre-fire observations (Hicke et al. 2003), or more often, determined by using unburned control regions in similar forest types (Amiro et al. 2000; Goetz et al. 2006; Cuevez Gonzalez et al. 2009). Both Amiro et al. (2000) and Hicke et al. (2003) used net primary productivity (NPP) as their indicator of post-fire forest recovery, with remotely sensed data (Advance Very High Resolution Radiometer, AVHRR) used to provide estimates of leaf area index (LAI), land cover, or Fraction of Absorbed Photosynthetically Active Radiation (fAPAR) for the modeling of NPP. Except for the study of Epting and Verbyla (2005), which used Landsat 30 m data, all the studies included in Table 1 used coarse spatial resolution data (500 m – 8 km), which limited recovery assessments to larger wildfires. While Hicke et al. (2003) and Goetz et al. (2006) used a time series of AVHRR data (8 km), most other studies relied on a single date of imagery (or multiple dates of imagery, but not a time series) and implemented a chronosequence approach (i.e., substituting space for time).
| Table 1. Summary of studies that have used remotely sensed data to investigate boreal post-disturbance forest recovery prior to opening of Landsat archive in 2008. NDVI: Normalized Different Vegetation Index; NPP: Net Primary Productivity; NBR: Normalized Burn Ratio; NDSWIR: Normalized Difference Shortwave Infrared Index; EVI: Enhanced Vegetation Index, TCB: Taseled Cap Brightness; TCW: Taseled Cap Wetness; TCG: Taseled Cap Greenness; NIR: Near Infrared; NDWI: Normalized Difference Wetness Index; FRI: Forest Recovery Index; FVC: Fractional Vegetation Cover; SAVI: Soil Adjusted Vegetation Index; NDMI: Normalized Difference Moisture Index. | ||||||
| Study | Location/ extent | Sensor | Spatial resolution | Temporal resolution | Spectral index | Key findings |
| Kasischke and French (1997) | Alaska boreal | AVHRR | 1 km | 1990–1992 Chrono-sequence | NDVI | Sample based: 14 fires ranging in size from 400 to 16 900 ha. Patterns of pre-fire vegetation cover influence patterns of post-fire regrowth. Early season fires recovered more rapidly. Strong seasonal impact on NDVI that differs by forest type. |
| Amiro et al. (2000) | Canada boreal | AVHRR | 1 km | 1994 Chrono-sequence | NPP | Sample based: 502 fires that were > 1000 ha; ~7 Mha. NPP derived from Boreal Ecosystem Productivity Simulator (BEPS) model. BEPS uses AVHRR-derived LAI and land cover as model inputs. Linear increase in NPP 15 years post-fire. Forested areas had larger and more rapid increases in NPP than and tundra-dominated ecoregions. |
| Hicke et al. (2003) | Canada boreal | AVHRR | 8 km | 1982–1998 Monthly AVHRR composites | NPP | Sample based: 61 fires > 100 000 ha. NPP derived from Carnegie-Ames-Stanford Approach (CASA). CASA uses fAPAR from NDVI. 9 years for NPP in the most severely burned pixels to return to pre-fire levels. Forests of the Alaska boreal interior recovered more slowly than those of Taiga Plains. |
| Epting and Verbyla (2005) | Alaska boreal | Landsat | 30 m | 1986 (pre-fire), 1988, 1991, 1994, 2000, 2002 | NDVI, NBR | 1 fire, 17 000 ha. Unburned control areas. NDVI and NBR peaked 14 years post-fire, neither returned to pre-fire levels by 2002 (end of time series). More rapid recovery in more severely burned areas. Recovery rate varied by forest type. Self-replacement was the dominant successional pathway. |
| Goetz et al. (2006) | Canada boreal | AVHRR | 8 km | 1981–1997 Analysis focused on 1981,1989, and 1995 | NDVI | Sample based: 327 fires > 64 000 ha, ~4Mha. Unburned control areas. 5 years for NDVI to return to pre-fire levels (related primarily to establishment of herbaceous vegetation post-fire). No differences in recovery rates noted between different regions. |
| Cuevez-Gonzalez et al. (2009) | Siberia boreal | MODIS | 1 km | 2001–2005 Chrono-sequence | NDVI, NDSWIR | Sample based: 78 fires, ~781 400 ha; Unburned control areas. >13 years for NDVI and NDSWIR to return to pre-fire levels. NDVI recovered more rapidly than NDSWIR. Differences with Goetz et al. (2006) attributed to spatial resolution differences, bandwidth and spectral response differences in R and NIR between MODIS and AVHRR, and more extreme growing conditions in the boreal. |
| Jin et al. (2012) | Canada boreal | MODIS | 500 m | 2001–2011 | EVI | Sample based: 1346 fires > 100 ha in size. By 5–8 years after fire, summer EVI for all severity classes had recovered to within 90%–108% of pre-fire levels. More rapid recovery in more severely burned areas; differences in recovery rates between Boreal and Taiga Shield ecozones. |
Several insights were gained from these earlier investigations. First, Epting and Verbyla (2005) and Jin et al. (2012) both reported that recovery rates were more rapid in areas with greater burn severities. These studies hypothesized that severe fires are more likely to combust surface vegetation and expose mineral soils, which is considered advantageous for rapidly colonizing herbaceous vegetation and deciduous tree species. Epting and Verbyla (2005) however noted that the by their nature, remotely sensed indices characterized changes in surface properties, that in turn impact reflectance (e.g., canopy removal, surface blackening) rather than subsurface properties (e.g. depth of organic layer). Second, the constraints of using coarse spatial resolution data, which limited analyses to large fire events and resulted in mixed pixels of burned and unburned patches, were identified by several authors as a limitation of the data and methods applied (Kasischke and French 1997; Hicke et al. 2003; Goetz et al. 2006; Cuevez-Gonzales et al. 2009). The study by Goetz et al. (2006) used the same AVHRR 8-km data for almost the same time period as that of Hicke et al. (2003), but used NDVI directly as the indicator of recovery rather than NPP. Whereas Hicke et al. (2003) used pre-fire NPP as the baseline for assessing NPP recovery and focused on areas with the greatest burn severity, Goetz et al. (2006) used unburned control areas within similar land cover types as a baseline for recovery assessment and did not distinguish by severity. Hicke et al. (2003) reported that it took 9 years for NPP to recover to pre-fire levels, whereas Goetz et al. (2006) reported that it took only 5 years for NDVI to recover to pre-fire levels (indicating that this was primarily driven by the return of herbaceous vegetation).
The study of Cuevez-Gonzalez et al. (2009) was the only study listed in Table 1 that was conducted outside of the North American boreal forest. The authors reported that it took more than 13 years (the limit of their time series) for NDVI and NDSWIR to recover to pre-fire levels and hypothesized that the longer recovery times they reported relative to those of Goetz et al. (2006) were likely the result of different spatial resolutions of the data (1 km versus 8 km), different sensors with different spectral bandwidths (MODIS versus AVHRR), more extreme growing conditions in the Siberian boreal, species composition differences, and differences in fire behaviour (i.e. crown fires dominate in North America, resulting in high tree mortality, whereas ground fires are more dominant in Siberia and result in more variable levels of mortality; Cuevez-Gonzalez et al. 2009).
Finally, these earlier studies reported conflicting results regarding whether recovery rates varied by ecoregion. While Amiro et al. (2000), Hicke et al. (2003), and Jin et al. (2012) all noted differences in recovery rates between forest- and tundra-dominated ecoregions, Goetz et al. (2006) observed no such differences, reporting that the time required for vegetation to establish was similar among the ecoregions they investigated, a difference which the authors attributed to the spectral index they used (NDVI) and its sensitivity to the early colonization of herbaceous vegetation post-fire.
4 Landsat time series data for boreal forest recovery assessments
With the opening of the Landsat archive in 2008, there has been a profusion of research on the use of Landsat time series data for forest recovery assessments. A search in Scopus (using terms [“forest” AND “recovery” AND “Landsat”] OR [“forest” AND “recovery” AND “Landsat” AND “boreal”] within article title, abstract and keywords) indicates that the boreal forest remains relatively under-represented in forest recovery research (Fig. 1). Published studies have focused both on boreal forests in North America (Table 2) and Eurasia (Table 3), with post-fire recovery dominating (Chu and Guo 2014). LTS have allowed for a more complete view of forest dynamics: whereas previously, remote sensing science focused almost exclusively on disturbance detection, LTS data have enabled the characterization of what happens after the disturbance in order to inform on forest demographics, sustainable forest management, and the long-term consequences of forest disturbances. A key innovation enabled by using LTS is the capacity to automate the attribution of detected disturbances to a causal agent (e.g. wildfire, harvest; Hermosilla et al. 2016), which has proven critical for forest recovery assessments and insights on differences between recovery rates in areas impacted by wildfire and harvest (White et al. 2017).
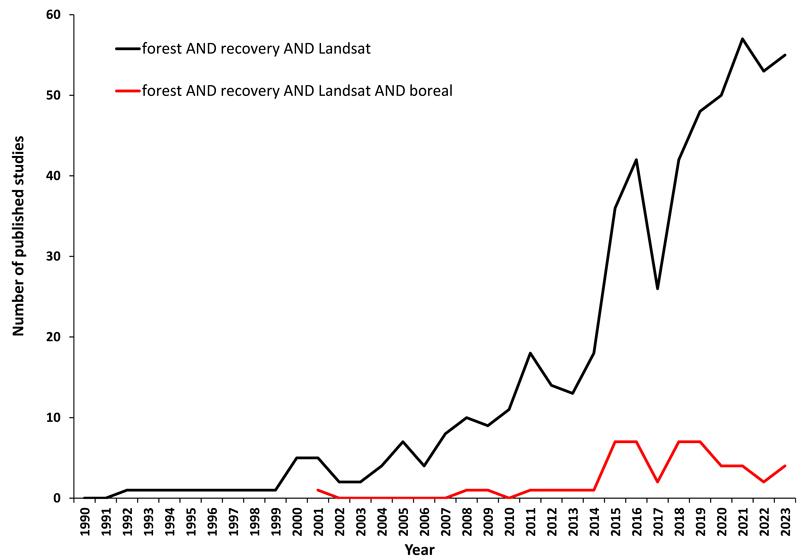
Fig. 1. Number of published research studies using Landsat data to investigate forest recovery globally, and in boreal forests specifically. Search terms included (“forest” AND “recovery” AND “Landsat”) or (“forest” AND “recovery” AND “Landsat” AND “boreal”) within the article title, abstract, and keywords (Source: Scopus:2023-12-14).
| Table 2. Summary of studies that have investigated the use of Landsat time series (LTS) data to characterize post-disturbance recovery in North American boreal forests following the opening of the Landsat archive in 2008. For a complete list of spectral index acronyms, see Table 1. | |||
| Study | Data | Spectral index | Key findings |
| Madoui et al. (2015) | Landsat images 1985, 1995, 2000, 2005 | N/A | Sample-based: study area contained 316 000 ha of wildfire and 417 000 ha of harvesting. Recovery assessed by land cover transitions for 1985, 1995, 2000, and 2005.Revegetation rates (transition to forest classes) more rapid post-harvest than post-fire and broadleaf was more common after harvest than fire. |
| Frazier et al. (2015) | LTS (1985–2012) | TCB, TCW, TCG | Sample-based: 8 Landsat scenes, ~20 Mha; no differentiation by disturbance type. Stronger recovery response in eastern Boreal Shield compares to western. Different indices relate to short- (TCG) and longer-term (TCW) recovery. |
| Pickell et al. (2016) | LTS (1985–2010) | NBR, NDVI, TCG, NIR | Sample based: 40 Landsat scenes representing 136 Mha. No differentiation by disturbance type. Recovery defined as number of years required for a pixel to return to 80% of its pre-disturbance value. Slowest for NBR, 5.6 years; fastest for TCG, 1.7 years. NDVI, TCG indices more sensitive to herbaceous vegetation and saturate rapidly post-disturbance. |
| White et al. (2017) | LTS (1985–2010) | NBR | Wall-to-wall; 650 Mha of forested ecosystems; wildfire and harvest; both short and long-term (Y2R) metrics of recovery were applied in a wall-to-wall assessment of recovery; Y2R recovery rates differed for wildfire (10.6 years, SD = 5.6 years) and harvest (6.6 years, SD = 3.9 years) Time since disturbance is important for interpreting spectral measures of forest recovery. Recovery rates varied by ecozone. |
| Frazier et al. (2018) | LTS (1986–2006) | TCG, TCW, TBR | Wall-to-wall within Boreal Shield and Taiga Shield ecozones. Post-fire short-term (@ 5 years) recovery rates increased by 18% in the Taiga Shield East and 9% in the Taiga Shield West. Recovery rates in the Boreal Shield varied temporally and were not consistently positive or negative. |
| Hermosilla et al. (2019) | LTS (1985–2015) | NBR | Wall-to-wall; 650 Mha of forested ecosystems of Canada; considered the impact of multiple disturbances on short-term recovery (i.e. at 5 years) following harvest and wildfire. Used Recovery Indicator of Kennedy et al. (2012). Compared recovery rates following multiple disturbances to those after only a single disturbance. More rapid (24%) short-term recovery from fires that burned previously harvested areas; slower (39%) short-term recovery when harvesting followed fire (salvage); fastest short-term recovery in areas disturbed by two harvest events. |
| Hird et al. (2021) | LTS (1985–2018) | NBR | Sample-based: Y2R for 57 979 harvested areas in Alberta, Canada; Mean Y2R = 8.7 years, average of 59.9% recovery after 5 years. Variability in Y2R by ecological subregions. |
| White et al. (2022) | LTS (1985–2017) | NBR | Wall-to-wall; 650 Mha of forested ecosystems of Canada. Recovery rates differed between fire (10.6 years, SD = 6.4 years) and harvest (6.1 years, SD = 4.6 years). Recovery rates varied by ecozone, disturbance type, pre-disturbance land cover, and latitude. Overall, 87% and 97% of recovered pixels sampled in harvests and wildfires, respectively, had achieved at least one of the benchmarks, with benchmarks of height more readily achieved than benchmarks of cover. ~4% of areas disturbed by wildfire or harvest had significant positive spatial clustering, indicative of slower spectral recovery rates; these areas were also less likely to have attained benchmarks of height and cover. Conversely, significant negative spatial clustering was identified for 0.94% of areas recovering from harvest and 1.93% of areas recovering from wildfire, indicative of spectral recovery that was more rapid than the ecozonal baseline. |
| White et al. (2023) | LTS (1985–2017) | NBR | Plots that experienced rapid spectral recovery were associated with a transition from conifer to broadleaf or were broadleaf pre-fire. Plots that experienced a decrease in stem density took significantly longer to spectrally recover than plots that experienced no change in stem density. Plots that had not yet spectrally recovered by the end of the time series were associated with higher elevations, drier sites, greater pre-fire basal area, and had the greatest change magnitude. Knowledge of pre-fire condition is important for characterizing and interpreting measures of post-fire spectral recovery for forest management applications. |
The use of LTS data has allowed for a more detailed examination of the behaviour of different spectral indices for forest recovery assessments. Pickell et al. (2016) reported that spectral recovery rates varied by spectral index, with NDVI and Tasseled Cap Greenness (TCG; Crist 1985) having more rapid recovery rates than NBR. Pickell et al. (2016) defined recovery as 80% of the mean spectral value of the 2-years prior to disturbance, with the assumption made that it may not be reasonable to expect forests to return to exactly the same pre-disturbance condition, either as a function of changes in tree species composition or forest structure that may be common post-disturbance. The results of Pickell et al. (2016) confirmed that different indices characterize different components of forest recovery, with NDVI and TCG capturing the initial flush of herbaceous vegetation, whereas NBR and the near-infrared band were influenced by increasing canopy complexity and changes in forest structure associated with the re-establishment of trees. Similar results were presented in the work of Frazier et al. (2017) using TCG as well as Tasseled Cap indices of brightness (TCB), and wetness (TCW), wherein TCG was considered a more appropriate measure of short-term recovery (e.g., ≤5 years post-disturbance), and TCW was more appropriate for long-term recovery (>5 years post-disturbance). NBR has been widely used (Tables 2 and 3) as it takes advantage of the different spectral responses that vegetation and bare soil have in the near-infrared and shortwave-infrared wavelengths.
The use of both long- and short-term metrics has been recommended as a useful strategy for recovery assessments (Kennedy et al. 2012; Chu et al. 2014) and has been demonstrated over large areas (White et al. 2017). The question of whether short-term recovery is indicative of long-term recovery outcomes is key and one that merits further investigation. For example, White et al. (2022) reported that locations with low levels of recovery at 5 years post-disturbance also had longer long-term recovery times, with the effect being greater for wildfire than for harvest. Although widely used in earlier studies of forest recovery (Table 1), research has demonstrated that the NDVI has limited utility as a measure of post-disturbance forest recovery, particularly if the definition of recovery includes the re-establishment of trees at a site (Schroeder et al. 2011; Buma 2012; Pickell et al. 2016). The selection of spectral index is therefore critically important for assessments of recovery and the selection of an appropriate spectral index should be governed by the definition of recovery being applied.
Some studies have proposed new spectral indices or have used different metrics to characterize recovery. Chu et al. (2016, 2017; Table 3) proposed two new indices for forest recovery assessment that are appropriate for short-term (i.e., <10 years since fire; fractional vegetation cover or FVC) and long-term (i.e., >10 years since fire forest recovery index or FRI) assessments of forest recovery. Other studies have transformed spectral indices into recovery indicators. For example, White et al. (2017) and Hird et al. (2021) use the Years to Recovery or Y2R metric, which measures the number of years it takes for a pixel to return to 80% of its pre-disturbance NBR value. White et al. (2017) also used short-term indicators of recovery developed by Kennedy et al. (2012), such as the ΔNBRregrowth index, which is the absolute measure of NBR at 5 years post disturbance, and the Recovery Indicator (RI), which scales the ΔNBRregrowth indicator by the magnitude of the disturbance. Hermosilla et al. (2019) used the RI to assess the impact of multiple disturbances on short-term recovery rates, with recovery rates in similar areas with only a single disturbance serving as the reference. The authors reported that recovery was 24% greater for fires that burned previously harvested areas compared to areas with only a single harvest, and that short-term recovery was 39% slower when harvesting followed wildfire (i.e. salvage harvesting) compared to a single wildfire event.
| Table 3. Summary of studies that have investigated the use of Landsat data (30 m) to characterize post-disturbance recovery in Eurasian boreal forests following the opening of the Landsat archive in 2008. For a complete list of spectral index acronyms, see Table 1. | |||
| Study | Data | Spectral index | Key findings |
| Potapov et al. (2015) | LTS (1985–2012) | NDVI, NDWI | Wall-to-wall, Eastern Europe: 59 539 images from 527 Landsat scenes representing 600 million ha. No atmospheric correction; used MODIS to generate normalized anisotropy-adjusted reflectance values. Recovery defined as canopy cover ≥ 49% by 2000 and 2012. More than 60% of the total area of forest loss that occurred prior to 2007 had recovered by 2012, and this rate was more than 85% for pre-1988 loss areas. Recovery could not be assessed annually due to data gaps and low tree canopy cover model stability in data poor years and regions. |
| Chu et al. (2016) | LTS (1995–2014) WorldView-2 panchromatic (2010) Ground plots | FRI, FVC | Post-wildfire forest recovery in larch forests for a single fire, 28 000 ha. Used unburned control areas as reference. WorldView-2 images used to sample pure vegetation and bare soil conditions for FRI and FVC calculation. Forest Recovery Index (FRI; considered a long-term measure of recovery) can be used for regrowth assessment after 10 years post-fire, which overlaps with marked increase in larch sapling stem volume; FRI returns to pre-fire condition after 30–47 years, depending on burn severity. Fractional Vegetation Cover (FVC) more suitable for assessing short-term recovery (i.e. within 10 YSF); increases rapidly within 5 YSF (associated with herbaceous vegetation). Mean recovery rates: FVC = 6 years; FRI = 20 years.Faster short-term recovery observed in areas with higher burn severity. Fourteen 50×50 m field plots at different burn severities; field data acquired at 11–18 YSF; used for qualitative assessment only. |
| Chu et al. (2017) | LTS (1998–2014) | FRI, FVC | Builds on work of Chu et al. (2016) and attempts to identify drivers of post-fire recovery using pre-fire land cover, burn severity, pre-fire forest condition, distance to water body, elevation, solar insolation, slope, soil moisture. Only 51% of variation in FVC recovery rates were explained by the identified drivers; burn severity (classes) most important predictor of recovery rate, followed by elevation and distance to water. Only 41% of FRI explained by these predictors (burn severity, distance to water, and pre-fire NDVI as primary drivers). |
| White et al. (2018) | LTS (1985–2012) ALS | NBR | Finland, post-harvest; validation of spectral recovery (Y2R) with ALS; 55% of pixels recovered within 10 years post-harvest. 89% of spectrally recovered pixels had achieved benchmarks of both height and cover measured from ALS data. Rapid recovery associated with taller trees at time of ALS measurement than slow recovery. |
| White et al. (2019) | LTS (1985–2012) Ground plots | NBR | Finland, post-harvest; validation of spectral recovery (Y2R) with 284 field plots (radius = 9 m). Mean height, dominant species, and the percentage of deciduous stems in the plot were most important factors influencing spectral recovery rates. Variability in stand establishment made it challenging to accurately discriminate among recovery rates within 10 years post-harvest. |
| Shvetsov et al. (2019) | LTS (1998–2017) | NBR | Post-fire recovery in southern Siberia; Sample-based: 97 samples sites, each 2–4 ha in size. Fire frequency, fire severity, and surface temperature anomalies explain 58% of the variation in recovery rates; recovery rate measured as slope of linear fit between NBR (dependent) and time since disturbance (independent). At least 7 NBR values used to fit the model.Strong positive correlation (R = 0.71) observed between field-measured log-transformed seedling density and NBR slope. Faster recovery in more severely burned areas. |
| Hislop et al. (2020) | MODIS (MCD64A1) 2001–2018 LTS (1991–2019) | NBR | Sample-based, post-fire recovery in boreal and temperate forests in Australia, Canada, Chile, China, Russia, USA and Mediterranean. MODIS used to map burns and guide selection of Landsat scene samples; LTS used to assess recovery. Strata defined by country, biome, and year and 500 Landsat pixels selected at random per stratum. dNBR used as continuous measure of magnitude/severity. Short-term recovery at 5 years post-disturbance; Recovery Indicator (RI) after Kennedy et al. (2012). Boreal forests had only recovered an average of ~60% of their pre-fire NBR value at 5 years post-fire. |
| Senf and Seidl (2021) | LTS (1991–2018) Chrono-sequence | NDVI, EVI, SAVI, mSAVI, NDMI, NBR, NBR-2 | Wall-to-wall; 36 million disturbance patches (not discriminated by disturbance type). Chronosequence approach; recovery defined relative to pre-disturbance canopy cover (average canopy cover based on 5 years pre-disturbance). All spectral indices were used in a random forest regression model to estimate canopy cover. Recovery to pre-disturbance canopy cover for Europe achieved within 30 years; 18–23 years for Nordic countries (boreal).Recovery was > 10 times faster than disturbance on 69% of the forest area. A statistical model was used to extrapolate beyond the time series (i.e. for pixels not recovered within 28 year LTS). |
| Nolè et al. (2022) | MODIS (MCD43A4) (2002–2020) | NBR, NDVI | Pan-European assessment at 500 m spatial resolution of short-term (5 year) post-fire recovery using the NBR-derived Relative Recovery Indicator (RRI) and NDVI. RRI was scaled to disturbance magnitude. Variability across forest classes and bioregions. Severity assessed using the Relativized Burn Ratio (RBR); highest severity fires were located in the boreal region. NDVI = recovery within 2.5 years; higher variability in boreal. More rapid NDVI recovery with greater fire severity. Faster recovery rates for broadleaf and mixedwood forest types compared to conifer in boreal. RRI indicated recovery was incomplete at 5 years. |
Other studies have pursued different approaches. Madoui et al. (2012) used a chronosequence approach and generalized 48 land cover classes generated for four years of Landsat data (1985, 1995, 2000, 2005) into four post-disturbance development classes (stand initiation, early regeneration, stem exclusion, and coniferous forest) in order to measure revegetation rate. Senf and Seidl (2019) likewise followed a different approach in their pan-European assessment of forest resilience, similar to earlier works of Amiro et al. (2000) or Hicke et al. (2003), both of whom used NPP for recovery assessments. Rather than assessing recovery as a function of trends in a particular spectral index, Senf and Seidl (2019) used LTS data to model canopy cover and measured the time it took (in years) for canopy cover to return to pre-disturbance cover (determined as the 5-year pre-disturbance average). To model canopy cover, the authors used a suite of 7 different spectral indices (Table 3). Potapov et al. (2012) also used canopy cover as their indicator of recovery, but used an absolute threshold (≥49%) to indicate recovery.
As noted previously, the automated attribution of disturbance to a causal agent has been an important innovation for the assessment of recovery over large areas. As per earlier research (Table 1), most of the studies listed in Tables 2 and 3 have focused on post-fire recovery; however, a few studies have not discriminated by disturbance type (Frazier et al. 2015; Pickell et al. 2016; Senf and Seidl 2021), or have focused on post-harvest recovery exclusively (White et al. 2018; White et al. 2019b; Hird et al. 2021). Only three studies to date have focused on both harvest and wildfire, characterizing the spatial and temporal differences in recovery rates between these two disturbance types (Madoui et al. 2015; White et al. 2017; White et al. 2022). Generally, harvested areas have been found to recover more rapidly than areas impacted by wildfire: trees are typically harvested on the most productive sites and regeneration is mandated post-harvest, whereas wildfires are indiscriminate and will burn both forest and non-forest vegetation on all site types (Madoui et al. 2015; White et al. 2017; White et al. 2022). For example, White et al. (2022) reported that the mean Y2R for harvested area was 6.1 years (σ = 4.6 years), compared to a mean Y2R of 10.6 years (σ = 6.4 years) for wildfire areas. Differences between post-fire and post-harvest recovery rates have also been confirmed with ground plot observations in Canadian boreal forests (Bartels et al. 2016).
Insights on differences in forest recovery rates between wildfire and harvests have program and policy implications. For example, the Canadian Carbon Budget Model (CBM-CFS3) previously assumed that all burned areas immediately started to regrow from age 0on a pre-disturbance yield curve. Using the Y2R metric and data from White et al. (2017, 2022) a post-fire regeneration delay is now applied to 25% of the area burned annually within each analysis unit, which are defined by the intersection of ecozonal and jurisdictional boundaries (Environment and Climate Change Canada 2023a). The delay was derived using the 75th quantile of the Y2R metric within each analysis unit, and ranged from 5 to 19 years (mean = 14 years, standard deviation = 3 years; Environment and Climate Change Canada 2023b).
Time since disturbance is often one of the key predictors of recovery (Bartels et al. 2016) and although Landsat time series capture increasingly longer periods, they do only represent a snapshot in time. Thus if an area has not recovered by the end of the time series (depending on how recovery is defined), it does not mean that the area will not eventually recover, rather that the area has not recovered yet. Several studies have established the importance of time since disturbance in the interpretation of spectral recovery metrics. For example, White et al. (2017) demonstrated that when considering all harvesting and wildfires that occurred between 1985 and 2012, 92.5% of areas impacted by harvest and 68.4% of areas impacted by wildfire had spectrally recovered by the end of the time series in 2017. In contrast, when considering only those disturbances that occurred prior to 1990, 98.4% of areas impacted by harvesting and 86.3% of areas impacted by wildfire had spectrally recovered. Likewise, Potapov et al. (2012) indicated that more than 60% of the total area of forest loss prior to 2007 had recovered by 2012 (Table 3) compared to 85% of the total area of forest loss prior to 1988.
Spectral change magnitude, often considered as a proxy for disturbance severity (Key and Benson 2006), has frequently been considered in recovery assessments (Tables 1–3). However, change magnitude is not analogous to burn severity, with the latter relating more to the ecological consequences of the fire (Whitman et al. 2018) than the absolute change in a spectral index. Johnstone and Chapin (2006) reported strong, positive effects of burn severity on seed germination, net seedling establishment, and growth of transplanted seedlings. Higher burn severity had significant positive effects for density and biomass of trembling aspen, but had negative effects for black spruce, suggesting that increased burn severity can shift successional trajectories from self-replacement of conifers towards a mixedwood state (Johnstone and Kasischke 2005).
Reported results regarding the impact of change magnitude or burn severity on post-fire recovery have not been consistent. Earlier work, which focused on the use of NDVI as the spectral index of recovery, found that the greater the burn severity, the more rapid the post-fire recovery (Epting and Verbyla 2005, Jin et al. 2012). More recent studies, which have focused on longer-term recovery using indices such as the NBR, have indicated that sites with the greatest change magnitude take longer to spectrally recover (White et al. 2017, 2022). However, Chu et al. (2016) also reported faster short-term recovery in areas with higher burn severity, noting that this rapid recovery was driven primarily by the establishment of herbaceous vegetation and broadleaf trees. Chu et al. (2017) found that burn severity was the most important predictor of short-term recovery rates (Table 3). The short-term metric used by Chu et al. (2016, 2017) is the Fractional Vegetation Cover (FVC) index, which is derived from the NDVI. The choice of spectral index may explain why some studies have reported more rapid recovery associated with higher burn severity, whereas others have not. However, using the NBR in Siberian boreal forests, Shvetsov et al. (2019) also reported more rapid recovery in more severely burned areas. This contrasts with the findings of White et al. (2022, 2023), who also used NBR in Canadian boreal forests, and reported that plots that recovered rapidly (i.e., within 1–5 years) had the lowest median change magnitude, while those plots that were not yet recovered by the end of the time series had the highest median change magnitude. This discrepancy in results may be attributed in part to differences in the nature of the fires in these two regions as noted earlier (i.e., ground fires versus crown fires, Cuevez-Gonzalez 2009), as well as methodologies used to define severity. Shvetsov et al. (2019) used a dNBR (i.e. change magnitude) threshold of 0.4 to indicate high (>0.4) and low/moderate (≤0.4) severity classes, whereas White et al. considered dNBR as a continuous variable and did not generate severity classes. Thresholds used to define low, moderate, and high burn severity classes are highly variable (Lentile et al. 2006) and often require local field data for calibration (Hall et al. 2008; French et al. 2008). Given these differences in how severity has been defined in various studies, it is challenging to characterize the impact that severity has had on recovery trajectories in different regions of the boreal.
Pre-disturbance forest composition also influences post-disturbance recovery (Bartels et al. 2016). Forests that are dominated by coniferous species pre-harvest have longer spectral recovery times when compared to broadleaf or mixedwood forest types (Tables 2 and 3). For example, White et al. (2022) reported that coniferous-dominated forests have the longest median Y2R overall (9 years) whereas broadleaf-dominated forests have the shortest median Y2R (3 years). In a post-fire assessment of recovery using ground plot data, White et al. (2023) also observed that plots that were coniferous-dominated pre-fire had significantly longer median recovery rates (Y2R = 14 years) compared to broadleaf- (Y2R = 8 years) and mixedwood-dominated (Y2R = 7 years) plots. Pre-disturbance composition, combined with burn severity, will influence the regeneration potential of remnant species (seeds versus vegetative reproduction), the availability of in situ propagules, and proximity to seed source, among others (Bartels et al. 2016). The first 10 years post-fire, wherein recruitment rates are the highest and beyond which new establishment is rare, are critical for regeneration success and for determining long-term forest composition (Johnstone et al. 2010).
Almost all studies listed in Tables 1, 2, and 3 highlight the variability in the spectral recovery response – both spatially and temporally. One of the key advantages of using the LTS 30 m data to generate spatially explicit estimates of recovery is the capacity to fully characterize the spatial and temporal variability in post-disturbance recovery. These data facilitate the establishment of baselines for the benefit of monitoring programs (Potapov et al. 2015; White et al. 2022). For example, with consistent observations on an annual time step, LTS enable retrospective assessments of recovery, with the capacity to monitor the long-term impacts of disturbances that have occurred prior to or since 1985 (White et al. 2017). With these data it is possible to establish temporal baselines that are regionally specific and that articulate expectations for recovery that are relevant to the local ecological context and to the definition of recovery being applied (White et al. 2022). Frazier et al. (2018) reported that relative rates of short-term recovery (i.e. at 5 years) increased by an average of 12% for the period 1986–2011 in the Taiga Shield ecozones, whereas there was no similar trend in the Boreal Shield ecozones. Spatial statistics can also be used to identify and characterize spatial hotspots of recovery, wherein spatial clusters of significantly faster or slower recovery times can be mapped and interrogated. For example, White et al. (2022) reported that 3.5% of disturbed areas in Canada’s forested ecosystems had spatial clusters of significantly slower-than-expected recovery relative to an ecozone-specific baseline.
Validation of spectral measures of recovery has also been a focus of research. Field plot measurements are critical for improving our understanding regarding the relationship between measures of spectral recovery and the manifestations of forest structure on the ground (Bartels et al. 2016). Several studies have integrated field plot data into their recovery assessments (Chu et al. 2016; White et al. 2019b; Shvetsov et al. 2019; White et al. 2023). Chu et al. (2016) reported that the increase in FRI after 10 years post-fire in Siberian forests corresponded to a significant increase in larch sapling stem volume. White et al. (2019b) investigated post-harvest recovery in boreal forests of southern Finland, reporting that the driest, least productive sites (xeric) had an average recovery time (Y2R = 9.2 years) that was significantly longer than the most productive sites (heath; Y2R = 6.1 years). White et al. (2019b) also reported that those field plots that had a greater proportion of deciduous stems had more rapid recovery than plots with fewer deciduous stems. A common indicator of post-fire regeneration success is post-fire stem density (Coop et al. 2020). Shvetsov et al. (2019) found a non-linear relationship between field measured seedling density and NBR slope (slope of post-fire NBR trend), with a strong positive correlation (r = 0.71) between log-transformed seedling density and NBR slope. In other words, the rate of NBR spectral recovery increased with increasing post-fire stem density. Similarly, White et al. (2023) reported that field plots that experienced a reduction in stem density relative to pre-fire stem density (which represented 37% of analyzed plots) had spectral recovery rates that were significantly longer (Y2R = 17 years) than plots that did not experience a decrease in stem density (Y2R = 8 years) post-fire (White et al. 2023).
Another important source of validation data for spectral recovery assessments is ALS data. Although the cost and frequency with which ALS data are acquired may limit their utility as a continuous forest recovery monitoring tool in most areas of the boreal, ALS data have emerged as an important source of validation data for measures of spectral recovery, particularly for definitions of recovery that relate to the return of trees. ALS data have enabled investigations of whether or not pixels that are determined to be spectrally recovered have achieved structural targets that are commensurate with the definition of recovery that is being applied. For example, White et al. (2018) used ALS data to assess whether spectrally recovered pixels had achieved benchmarks of cover (>10%) and height (>5 m) post-harvest in intensively managed forests of southern Finland: overall, 89% of spectrally recovered pixels had achieved benchmarks of both height and cover. In a similar assessment that considered both wildfire and harvest in Canadian forests, 57% of spectrally recovered pixels had achieved benchmarks of both height and cover, with height benchmarks more commonly achieved for wildfire (White et al. 2022), likely as a function of residual trees that are left behind after fires (Bolton et al. 2015, 2017). It is important to note that although spectral indices may return to pre-disturbance values once canopies reach crown closure (or sooner), large differences in vertical structure may remain, highlighting the utility of considering both height and cover ALS metrics for recovery assessments (Magnussen and Wulder 2012). ALS data have also been used to examine the aforementioned spatial recovery hotspots: significant positive spatial clusters of Y2R with recovery rates that were slower than their ecozonal baseline were less likely to have achieved benchmarks of cover and height (as measured by the ALS data), particularly in harvested areas (White et al. 2022).
5 Airborne laser scanning data for boreal forest recovery assessments
In addition to serving as a valuable source of validation data for spectral assessments of post-disturbance forest recovery, ALS data have also enabled new insights on the nature of recovery in the boreal by leveraging a chronosequence of post-disturbance forest structures (Table 4). Bolton et al. (2015) developed a 25-year chronosequence of post-fire structural development for dense (>50% canopy cover) and open (20–50% canopy cover) forest structures. LTS data were used to map fire patches (1985–2010), and the ALS data from 2010 were used to characterize vertical forest structure. The authors found no significant difference in canopy cover or height within the first 10 years post-fire, but did observe significant differences at 20–25 years. However, canopy cover and height were significantly lower for patches at 20–25 years post fire compared to unburned patches, suggesting that the stem exclusion phase had not yet been reached. Canopy cover and height were, on average, 20% and 50% lower, respectively, than was observed in similar unburned patches. Critically, the work of Bolton et al. (2015) highlights that ALS metrics, particularly height metrics, are sensitive to residual structures that remain 10-years post-fire. This underscores the importance of using metrics of both height and cover to assess recovery and indicates that pre-disturbance forest structure, as well as pre-disturbance composition are important for assessing recovery. The study of Magnussen and Wulder (2012) developed statistical methods to differentiate regenerating and residual canopy using a single date of ALS data and a chronosequence approach; however, such approaches rely on expectations for growth that may not be possible to quantify with certainty in all regions of the boreal. As large-area acquisitions of ALS data continue to expand and in some cases are repeated in certain regions of the boreal (e.g., Finland, Québec), further opportunities to study detailed structural recovery will become increasingly possible.
| Table 4. Summary of studies that have used ALS data independently or have integrated LTS and ALS data to characterize boreal post-disturbance forest recovery. For a complete list of spectral index acronyms, see Table 1. | |||
| Study | Data | Spectral index | Key findings |
| Magnussen and Wulder 2012 | Airborne laser scanning data (2010) | N/A | 163 historic fires from Canadian National Large Fire Database. Incomplete fire consumption means that canopy heights could be a mixture of residual tree heights and recovering heights. Chronosequence approach, to identify regenerating canopy: mean annual height growth had to be less than a specified value (derived from unassociated plot data).Developed a least-squares polynomial between post-fire recovered canopy heights and years since fire. Based on expectation for growth. Statistically separated post-fire recovered canopy heights from pre-fire canopy heights. |
| Bolton et al. 2015 | LTS (1985–2010) Airborne laser scanning data (2010) | NBR | Post-fire; sample-based; 600 burned patches > 13 000 ha. Chronosequence of ALS-derived canopy height and cover. Pre-disturbance cover influenced post-fire structure.Canopy cover and height were significantly greater at 20–25 years post-fire for stands that were denser pre-fire. ALS metrics sensitive to residual canopy structures in the first 10 years post-fire. |
| Bolton et al. 2017 | LTS (1985–201) Airborne laser scanning data (2010) MODIS GPP (2000–2015) | N/A | Post-fire; 417 burned patches (1985–2009). 25-year chronosequence of canopy height & cover from ALS. Post-fire canopy cover related to GPP but only after 16–25 YSF (mean = 16.2–21.7%, SD = 16.0–17.1%), and correlations to GPP were stronger (r = 0.63–0.71, P < 0.0). Variability in height remained low at 16–25 YSF (mean = 4.9–5.0 m, SD = 0.9–1.1 m) and weakly related to GPP (r = 0.16–0.21). |
6 Future research priorities
Boreal forests are generally underrepresented in LTS recovery research (Fig. 1), perhaps as a function of slower growth rates and longer recovery times in the boreal. Beyond the boreal biome however, there is a significant body of research on the use of LTS and ALS for assessing post-disturbance forest recovery in temperate, mediterranean, and tropical forests that can be drawn upon to inform work in the boreal. Based on the synthesis provided herein, several topics emerge that merit further investigation in a boreal context. First and foremost, given the relatively short time span available from LTS for characterizing recovery in a boreal forest context (currently 38 years), the question of whether short-term spectral recovery (i.e., within 5- or 10-years post disturbance) is indicative of long-term recovery outcomes is key. Early indications of recovery could be useful for planning interventions or improving our understanding of the consequences of disturbances. Such an experiment would require ALS or field plot data for calibration and validation. Likewise, discrepancies regarding the influence of change magnitude or disturbance severity on post-disturbance recovery rates also requires further investigation in a boreal context. For example, is the influence of change magnitude on recovery rates determined by the choice of spectral index (i.e., NDVI versus NBR or others), or by the application of burn severity classes versus the characterization of the disturbance as a continuum? Alternatively, is the impact of change magnitude on post-disturbance recovery rates modulated by forest type, as has been found in other forest environments (Hislop et al. 2019)?
Much research has focused on post-fire recovery, highlighting the need for further investigations regarding long-term recovery trends following harvesting in different boreal forest environments. Likewise, additional investigations that link field plot measurements to measures of spectral recovery are needed, particularly to better understand the strengths and weakness of different spectral indices for the assessment of short- and long-term recovery. Open datasets, such as that of Baltzer et al. (2021) contribute greatly to these types of studies. The integration of ALS and LTS data for boreal forest recovery assessments remains an underexploited source of information for those applications where forest recovery is defined by the return of trees. Given the unprecedented extent of wildfires in North American boreal forests in 2023, the impact of recovery rates on the likelihood of reburn or reburn severity also merits further investigation (Weber et al. 2022), as does the impact of multiple disturbances on long-term recovery (Hermosilla et al. 2019). Finally, earlier research (Table 1) raised some interesting questions that should be revisited with newly available data sources such as LTS and ALS. Examples include differences in recovery rates as a function of disturbance time (i.e., fires in the early spring versus late summer fires; Kasischke and French 1997), the impact of ground versus crown fires on spectral recovery rates (Cuevez-Gonzalez 2009), and the use of productivity as a measure of recovery (Amiro et al. 2000; Hicke et al. 2003).
7 Conclusion
Innovations in data policies, curated data archives, and increased computational capacity have enabled disturbance detection at an annual or sub-annual time step, as well as the automated attribution of changes to a causal agent. These same innovations have also enabled the unprecedented capacity to characterize post-disturbance forest recovery, particularly following stand replacing disturbances, in a manner that is synoptic, spatially-explicit, and spatially detailed. Several insights regarding the nature of post-disturbance recovery in boreal forests have emerged from the review of past and current research presented herein. First and foremost, definitions of recovery must be clear and measurable to enable quantitative and objective assessments of recovery. Moreover, indices that are used to assess recovery must align with the definition, whether those indices be spectral (e.g., NBR), structural (e.g., canopy cover), or derived (e.g., NPP). Disturbance type, magnitude, time since disturbance, and pre-disturbance conditions are all critical for interpreting spectral indicators of post-disturbance forest recovery – factors that have also been reported for studies conducted in other forest biomes. Spectral recovery metrics derived from LTS data are spatially explicit and temporally exhaustive, and can serve as an important monitoring tool when augmented by ALS and field plot data. Virtually all studies reviewed herein have highlighted the spatial variability inherent in spectral recovery rates; the capacity to map this spatial variability at a 30 m spatial resolution and analyze spatial patterns provides useful information for forest science, planning, and management. Importantly, Landsat time series data have enabled retrospective analysis, establishment of recovery baselines, and identification of spatial hotspots that have significantly slower or faster recovery times relative to a regionally-relevant historical baseline. Finally, synergistic uses of LTS and ALS data have yet to be fully exploited to provide insights on relations between spectral and structural measures of recovery. Opportunities for further research on post-disturbance recovery in the boreal are numerous, with a foundation of innovative studies to build upon. Forest monitoring efforts in the boreal would greatly benefit from an increased research emphasis in this biome.
Acknowledgements
This review was undertaken to inform a keynote presentation given at the 20th International Boreal Forest Research Conference (IBFRA), August 28–31, 2023, in Helsinki, Finland.
Funding
The author sincerely thanks the organizing committee of the 20th International Boreal Forest Research Conference (IBFRA) for the invitation to participate in the conference and for the funds to support travel.
References
Amiro BD, Chen JM, Liu J (2000) Net primary productivity following forest fire for Canadian ecoregions. Can J Forest Res 30: 939−947. https://doi.org/10.1139/x00-025.
Amiro BD, Barr AG, Barr JG, Black TA, Bracho R, Brown M, Chen J, Clark KL, Davis KJ, Desai A R, Dore S, Engel V, Fuentes JD, Goldstein AH, Goulden ML, Kolb TE, Lavigne MB, Law BE, Margolis HA, Martin T, McCaughey JH, Misson L, Montes-Helu M, Noormets A, Randerson JT, Starr G, Xiao J (2010) Ecosystem carbon dioxide fluxes after disturbance in forests of North America. J Geophys Res Biogeosci 115, article id G00K02. https://doi.org/10.1029/2010JG001390.
Anderson-Teixeira KJ, Miller AD, Mohan JE, Hudiburg TW, Duval BD, DeLucia EH (2013) Altered dynamics of forest recovery under a changing climate. Glob Change Biol 19: 2001–2021. https://doi.org/10.1111/gcb.12194.
Baltzer JL, Day NJ, Walker XJ, Greene D, Mack MC, Alexander HD, Arseneault D, Barnes J, Bergeron Y, Boucher Y, Bourgeau-Chavez LL, Brown CD, Carrière S, Howard BK, Gauthier S, Parisien MA, Reid KA, Rogers BM, Roland C, Sirois L, Stehn S, Thompson DK, Turetsky MR, Whitman E, Johnstone JF (2021) ABoVE: synthesis of post-fire regeneration across boreal North America, Version 1 (2021–08-31) ORNL DAAC, Oak Ridge, Tennessee, USA. https://doi.org/10.3334/ORNLDAAC/1955.
Banskota A, Kayastha N, Falkowski MJ, Wulder MA, Froese RE, White JC (2014) Forest monitoring using Landsat time series data: a review. Can J Remote Sens 40: 362–384. https://doi.org/10.1080/07038992.2014.987376.
Bartels SF, Chen HYH, Wulder MA, White JC (2016) Trends in post-disturbance recovery rates of Canada’s forests following wildfire and harvest. For Ecol Manag 361: 194–207. https://doi.org/10.1016/j.foreco.2015.11.015.
Bolton DK, Coops NC, Wulder MA (2015) Characterizing residual structure and forest recovery following high-severity fire in the western boreal of Canada using Landsat time-series and airborne LiDAR data. Remote Sens Env 163: 48–60. https://doi.org/10.1016/j.rse.2015.03.004.
Bolton DK, Coops NC, Hermosilla T, Wulder MA, White JC (2017) Assessing variability in post-fire forest structure along gradients of productivity in the Canadian boreal using multi-source remote sensing. J Biogeogr 44: 1294–1305. https://doi.org/10.1111/jbi.12947.
Brand DG, Leckie DG, Cloney EE (1991) Forest regeneration surveys: design, data collection, and analysis. For Chron 67: 649–657. https://doi.org/10.5558/tfc67649-6.
Buma B (2012) Evaluating the utility and seasonality of NDVI values for assessing post-disturbance recovery in a subalpine forest. Environ Monit Assess 184: 3849–3860. https://doi.org/10.1007/s10661-011-2228-y.
Chu T, Guo X (2014) Remote sensing techniques in monitoring post-fire effects and patterns of forest recovery in boreal forest regions: a review. Remote Sens 6: 470–520. https://doi.org/10.3390/rs6010470.
Chu T, Guo X, Takeda K (2016) Remote sensing approach to detect post-fire vegetation regrowth in Siberian boreal larch forest. Ecol Indic 62: 32–46. https://doi.org/10.1016/j.ecolind.2015.11.026.
Chu T, Guo X, Takeda K (2017) Effects of burn severity and environmental conditions on post-fire regeneration in Siberian larch forest. Forests 8, article id 76. https://doi.org/10.3390/f8030076.
Coop JD, Parks SA, Stevens-Rumann CS, Crausbay SD, Higuera PE, Hurteau MD, Tepley A, Whitman E, Assal T, Collins BM, Davis KT, Dobrowski S, Falk DA, Fornwalt PJ, Fulé PZ, Harvey BJ, Kane VR, Littlefield CE, Margolis EQ, North M, Parisien MA, Prichard S, Rodman KC (2020) Wildfire driven forest conversion in western North American landscapes. BioScience 70: 659–673. https://doi.org/10.1093/biosci/biaa061.
Coops NC, Shang C, Wulder MA, White JC, Hermosilla T (2020) Change in forest condition: Characterizing non-stand replacing disturbances using time series satellite imagery. For Ecol Manag 474, article id 1178370. https://doi.org/10.1016/j.foreco.2020.118370.
Cuevez-Gonzalez GF, Baltzer H, Riano D (2009) Analysing forest recovery after wildfire disturbance in boreal Siberia using remotely sensed vegetation indices. Glob Change Biol 15: 561–577. https://doi.org/10.1111/j.1365-2486.2008.01784.x.
Curtis PG, Slay CM, Harris NL, Tyukavina A, Hansen MC (2018) Classifying drivers of global forest loss. Science 361: 1108–1111. https://doi.org/10.1126/science.aau3445.
Dale VH, Joyce LA, McNulty S, Neilson RP, Ayres MP, Flannigan MD, Hanson PJ, Irland LC, Lugo, AE, Peterson CJ, Simberloff D, Swanson FJ, Stocks BJ, Wotton BM (2001) Climate change and forest disturbances: climate change can affect forests by altering the frequency, intensity, duration, and timing of fire, drought, introduced species, insect and pathogen outbreaks, hurricanes, windstorms, ice storms, or landslides. BioScience 51: 723–734. https://doi.org/10.1641/0006-3568(2001)051[0723:CCAFD]2.0.CO;2.
Dwyer JL, Roy DP, Sauer B, Jenkerson CB, Zhang HK, Lymburner L (2018) Analysis ready data: enabling analysis of the Landsat archive. Remote Sens 10, article id 1363. https://doi.org/10.3390/rs10091363.
Epting J, Verbyla D (2005) Landscape-level interactions of pre-fire vegetation, burn severity, and postfire vegetation over a 16-year period in interior Alaska. Can J Forest Res 35: 1367–1377. https://doi.org/10.1139/x05-060.
Environment and Climate Change Canada (2023a) National Inventory Report 1999–2021: greenhouse gas sources and sinks in Canada, Part 1. https://publications.gc.ca/site/eng/9.506002/publication.html. Accessed 4 December 2023.
Environment and Climate Change Canada (2023b) National inventory report 1999–2021: greenhouse gas sources and sinks in Canada, Annex 3.5. Methodology for the Land Use, Land-Use Change and Forestry Sector. https://data-donnees.az.ec.gc.ca/api/file?path=/substances%2Fmonitor%2Fcanada-s-official-greenhouse-gas-inventory%2FF-Additional-NIR-Annexes%2FEN_Annex3.5_Methodologies_LULUCF.pdf. Accessed 4 December 2023.
FAO (2017) Voluntary guidelines on national forest monitoring. Rome, FAO. https://www.fao.org/3/i6767e/i6767e.pdf. Accessed 4 December 2023
Franklin JF, SpiesTA,Van Pelt R, Carey AB, Thornburgh DA, Berg DR, Lindenmayer DB, Harmon ME, Keeton WS, Shaw DC, Bible K, Chen J (2002) Disturbances and structural development of natural forest ecosystems with silvicultural implications, using Douglas-fir forests as an example. For Ecol Manag 155: 399–423. https://doi.org/10.1016/S0378-1127(01)00575-8.
Frazier RJ, Coops NC,Wulder MA (2015) Boreal shield forest disturbance and recovery trends using Landsat time series. Remote Sens Environ 170: 317–327. https://doi.org/10.1016/j.rse.2015.09.0150034-4257.
Frazier RJ, Coops NC, Wulder MA, Hermosilla T, White JC (2018) Analyzing spatial and temporal variability in short-term rates of post-fire vegetation return from Landsat time series. Remote Sens Environ 205: 32–45. https://doi.org/10.1016/j.rse.2017.11.007.
French NHF, Kasischke ES, Hall RJ, Murphy KA, Verbyla DL, Hoy EE, Allen JL (2008) Using Landsat data to assess fire and burn severity in the North American boreal forest region: an overview and summary of results. Int J Wildland Fire 17: 443–462. https://doi.org/10.1071/WF08007.
Frolking S, Palace MW, Clark DB, Chambers JQ, Shugart HH, Hurtt GC (2009) Forest disturbance and recovery: a general review in the context of spaceborne remote sensing of impacts on aboveground biomass and canopy structure. J Geophys Res Biogeosci 114, article id G00E02. https://doi.org/10.1029/2008JG000911.
Galipeau C, Kneeshaw D, Bergeron Y, Goetz S, Fiske GJ, Bunn AG (2006) Using satellite time-series data sets to analyze fire disturbance and forest recovery across Canada. Remote Sens Env 101: 352–365. https://doi.org/10.1016/j.rse.2006.01.01.
Gerard F, Plummer S, Wadsworth R, Ferreruela A, Iliffe L, Balzter H, Wyatt B (2003) Forest fire scar detection in the boreal forest with multitemporal SPOT-VEGETATION data. IEEE Trans Geosci Remote Sens 41: 2575–2585. https://doi.org/10.1109/TGRS.2003.819190.
Griffiths P, van der Linden S, Kuemmerle T, Hostert P (2013) A pixel-based Landsat compositing algorithm for large area land cover mapping. IEEE J Sel Top Appl Earth Obs Remote Sens 6: 2088–2101. https://doi.org/10.1109/JSTARS.2012.2228167.
Guindon L, Bernier P, Gauthier S, Stinson G, Villemaire P, Beaudoin A (2018) Missing forest cover gains in boreal forests explained. Ecosphere 9, article id e02094. https://doi.org/10.1002/ecs2.2094.
Hall RJ, Freeburn JT, de Groot WJ, Pritchard JM, Lynham TJ, Landry R (2008) Remote sensing of burn severity: experience from western Canada boreal fires. Int J Wildland Fire 17: 476–489. https://doi.org/10.1071/WF08013.
Hermosilla T, Wulder MA, White JC, Coops NC, Hobart GW, Campbell LB (2016) Mass data processing of time series Landsat imagery: pixels to data products for forest monitoring. Int J Digit Earth 9: 1035–1054. https://doi.org/10.1080/17538947.2016.1187673.
Hermosilla T, Wulder MA, White JC, Coops NC (2019) Prevalence of multiple forest disturbances and impact on vegetation regrowth from interannual Landsat time series (1985–2015). Remote Sens Env 233, article id 111403. https://doi.org/10.1016/j.rse.2019.111403.
Hicke JA, Asner GP, Kasischke ES, French NHF, Randerson JT, Collatz GJ, Stocks BJ, Tucker CJ, Los, SO, Field CB (2003) Postfire response of North American boreal forest net primary productivity analyzed with satellite observations. Glob Change Biol 9: 1145−1157. https://doi.org/10.1046/j.1365-2486.2003.00658.x.
Hird J, Kariyeva J, McDermid GJ (2021) Satellite time series and Google Earth Engine democratize the process of forest-recovery monitoring over large areas. Remote Sens 13, article id 4745. https://doi.org/10.3390/rs13234745.
Hislop S, Jones S, Soto-Berelov M, Skidmore A, Haywood A, Nguyen TH (2019) High fire disturbance in forests leads to longer recovery, but varies by forest type. Remote Sens Ecol Conserv 5: 376–388. https://doi.org/10.1002/rse2.113.
Huete A, Didan K, Miura T, Rodriguez EP, Gao X, Ferreira LG (2002) Overview of the radiometric and biophysical performance of the MODIS vegetation indices. Remote Sens Env 83: 195–213. https://doi.org/10.1016/S0034-4257(02)00096-2.
Jin Y, Randerson JT, Goetz SJ, Beck PSA, Loranty MM, Goulden ML (2012) The influence of burn severity on postfire vegetation recovery and albedo change during early succession in North American boreal forests. J Geophys Res Biogeosci 117, article id G01036. https://doi.org/10.1029/2011JG001886.
Kasischke ES, French NHF (1997) Constraints on using AVHRR composite index imagery to study patterns of vegetation cover in boreal forests. Int J Remote Sens 18: 2403–2426. https://doi.org/10.1080/014311697217684.
Kearney SP, Coops NC, Stenhouse GB, Nielsen SE, Hermosilla T, White JC, Wulder MA (2019) Grizzly bear selection of recently harvested forests is dependent on forest recovery rate and landscape composition. For Ecol Manag 449, article id 117459. https://doi.org/10.1016/j.foreco.2019.117459.
Kennedy RE, Yang Z, Cohen WB, Pfaff E, Braaten J, Nelson P (2012) Spatial and temporal patterns of forest disturbance and regrowth within the area of the northwest forest plan. Remote Sens Env 122: 117–133. https://doi.org/10.1016/j.rse.2011.09.024.
Key CH, Benson NC (2006) Landscape assessment: sampling and analysis methods. In: Lutes DC, Keane RE, Caratti JF, Key CH, Benson NC, Sutherland S, Gangi LJ (eds) FIREMON: Fire effects monitoring and inventory system. Gen. Tech. Rep. RMRS-GTR-164-CD, pp LA1–LA51, Rocky Mountain Research Station, United States Forest Service, US Department of Agriculture, Fort Collins Colorado, USA. https://www.fs.usda.gov/rm/pubs_series/rmrs/gtr/rmrs_gtr164/rmrs_gtr164_13_land_assess.pdf. Accessed 4 December 2023
Lentile LB, Holden ZA, Smith AMS, Falkowski MJ, Hudak AT, Morgan P, Lewis SA, Gessler PE, Benson NC (2006) Remote sensing techniques to assess active fire characteristics and post-fire effects. Int J Wildland Fire 15: 319–345. https://doi.org/10.1071/WF05097.
Madoui A, Gauthier S, Leduc A, Bergeron Y, Valeria O (2015) Monitoring forest recovery following wildfire and harvest in boreal forests using satellite imagery. Forests 6: 4105–4134. https://doi.org/10.3390/f6114105.
Magnussen S, Wulder MA (2012) Post-fire canopy height recovery in Canada’s boreal forests using Airborne Laser Scanner (ALS). Remote Sens 4: 1600–1616. https://doi.org/10.3390/rs4061600.
Markham BL, Helder DL (2012) Forty-year calibrated record of earth-reflected radiance from Landsat: a review. Remote Sens Env 122: 30–40. https://doi.org/10.1016/j.rse.2011.06.026.
McKenna PB, Lechner AM, Phinn S, Erksine PD (2020) Remote sensing of mine site rehabilitation for ecological outcomes: a global systematic review. Remote Sens 12, article id 3535. https://doi.org/10.3390/rs12213535.
Nolè A, Rita A, Spatola MF, Borghetti M (2022) Biogeographic variability in wildfire severity and post-fire vegetation recovery across the European forests via remote sensing-derived spectral metrics. Sci Total Environ 823, article id 153807. https://doi.org/10.1016/j.scitotenv.2022.153807.
Oliver CD, Larson BC (1996) Forest stand dynamics. Wiley, New York.
Päivinen R, Lund G, Poso S, Zawiła-Niedźwiecki T (1994) IUFRO International Guidelines for Forest Monitoring. A report of IUFRO Working Party 4.02.02. IUFRO World Series Report 5. Vienna, Austria, International Union of Forestry Research Organizations. https://doi.org/10.13140/RG.2.1.4136.4568.
Pickell PD, Hermosilla T, Frazier RJ, Coops NC, Wulder MA (2016) Forest recovery trends derived from Landsat time series for North American boreal forests. Int J Remote Sens 37: 138–149. https://doi.org/10.1080/2150704X.2015.1126375.
Potapov PV, Turbanova SA, Tyukavina A, Krlyov AM, McCarty JL, Radeloff VC, Hansen MC (2014) Eastern Europe’s forest cover dynamics from 1985 to 2012 quantified from the full Landsat archive. Remote Sens Env 159: 28–43. https://doi.org/10.1016/j.rse.2014.11.027.
Pugh TAM, Lindeskog M, Smith B, Poulter B, Arneth A, Haverd V, Calle L (2019) Role of forest regrowth in global carbon sink dynamics. Proc Natl Acad Sci 116: 4382–4387. https://doi.org/10.1073/pnas.1810512116.
Schroeder TA, Wulder MA, Healey SP, Moisen GG (2011) Mapping wildfire and clearcut harvest disturbances in boreal forests with landsat time series data. Remote Sens Env 115: 1421–1433. https://doi.org/10.1016/j.rse.2011.01.022.
Senf C, Seidl R (2021) Post-disturbance canopy recovery and the resilience of Europe’s forests. Glob Ecol Biogeogr 31: 25–36. https://doi.org/10.1111/geb.13406.
Shvetsov EG, Kukavskaya EA, Buryak LV, Barrett K (2019) Assessment of post-fire vegetation recovery in Southern Siberia using remote sensing observations. Environ Research Lett 14, article id 055001. https://doi.org/10.1088/1748-9326/ab083d.
Tucker CJ (1979) Red and photographic infrared linear combinations for monitoring vegetation. Remote Sens Env 8: 127–150. https://doi.org/10.1016/0034-4257(79)90013-0.
Vogelmann JE, Xian G, Homer C, Tolk B (2012) Monitoring gradual ecosystem change using Landsat time series analyses: case studies in selected forest and rangeland ecosystems. Remote Sens Env 122: 92–105. https://doi.org/10.1016/j.rse.2011.06.027.
Weber RN, Powers MD, Kennedy RE (2022) Vegetation recovery rates provide insight into reburn severity in southwestern Oregon, USA. For Ecol Manage 519, article id 120292. https://doi.org/10.1016/j.foreco.2022.120292.
White JC, Wulder MA, Hobart GW, Luther JE, Hermosilla T, Griffiths P, Coops NC, Hall RJ, Hostert P, Dyk A, Guindon L (2014) Pixel-based image compositing for large-area dense time series applications and science. Can J Remote Sens 40: 192–212. https://doi.org/10.1080/07038992.2014.945827.
White JC, Wulder MA, Hermosilla T, Coops NC, Hobart GW (2017) A nationwide annual characterization of 25 years of forest disturbance and recovery for Canada using Landsat time series. Remote Sens Env 194: 303–321. https://doi.org/10.1016/j.rse.2017.03.035.
White JC, Saarinen N, Kankare V, Wulder MA, Hermosilla T, Coops NC, Pickell PD, Holopainen M, Hyyppä J, Vastaranta M (2018) Confirmation of post-harvest spectral recovery from Landsat time series using measures of forest cover and height derived from airborne laser scanning data. Remote Sens Env 216: 262–275. https://doi.org/10.1016/j.rse.2018.07.004.
White JC, Wulder MA, Hermosilla T, Coops NC (2019a) Satellite time series can guide forest restoration. Nature 569, article id 630. https://doi.org/10.1038/d41586-019-01665-x.
White JC, Saarinen N, Wulder MA, Kankare V, Hermosilla T, Coops NC, Holopainen M, Hyyppä J, Vastaranta M (2019b) Assessing spectral measures of post-harvest forest recovery with field plot data. Int J Appl Earth Obs Geoinf 80: 102–114. https://doi.org/10.1016/j.jag.2019.04.010.
White JC, Wulder MA, Hermosilla T, Coops NC (2022) Mapping, validating, and interpreting spatio-temporal trends in post-disturbance forest recovery. Remote Sens Env 271, article id 112904. https://doi.org/10.1016/j.rse.2022.112904.
White JC, Hermosilla T, Wulder MA (2023) Pre-fire measures of boreal forest structure and composition inform interpretation of post-fire spectral recovery rates. For Ecol Manag 537, article id 120948. https://doi.org/10.1016/j.foreco.2023.120948.
Whitman E, Parisien MA, Thompson DK, Hall RJ, Skakun RS, Flannigan MD (2018) Variability and drivers of burn severity in the northwestern Canadian boreal forest. Ecosphere 9, article id e02128. https://doi.org/10.1002/ecs2.2128.
Woodcock CE, Allen R, Anderson M, Belward A, Bindschadler R, Cohen W, Gao F, Goward SN, Helder D, Helmer E, Nemani R, Oreopoulos L, Schott J, Thenkabail PS, Vermote EF, Vogelmann J, Wulder MA, Wynne R (2008) Free access to Landsat imagery. Science 320, article id 1011. https://doi.org/10.1126/science.320.5879.1011a.
Wulder MA, White JC, Loveland TR, Woodcock CE, Belward AS, Cohen WB, Fosnight EA, Shaw J, Masek JG, Roy DP (2016) The global Landsat archive: status, consolidation, and direction. Remote Sens Env 185: 271–283. https://doi.org/10.1016/j.rse.2015.11.032.
Wulder MA, Loveland TR, Roy DP, Crawford CJ, Masek JG, Woodcock CE, Allen RG, Anderson MC, Belward AS, Cohen WB, Dwyer J, Erb A, Gao F, Griffiths, P, Helder D, Hermosilla T, Hipple JD, Hostert P, Hughes MJ, Huntingon J, Johnson DM, Kennedy R, Kili A, Li X, Lymburner L, McCorkel J, Pahlevan N, Scambos TA, Schaaf C, Schott JR, Shen Y, Storey J, Vermote E, Vogelmann J, White JC, Wynne RH, Zhu Z (2019) Current status of Landsat program, science, and applications. Remote Sens Env 225: 127–147. https://doi.org/10.1016/j.rse.2019.02.015.
Wulder MA, Roy DP, Radeloff VC, Loveland TR, Anderson MC, Johnson DM, Healey S, Zhu Z, Scambos TA, Pahlevan N, Hansen M, Gorelick N, Crawford CJ, Masek JG, Hermosilla, T, White JC, Belward AS, Schaaf C, Woodcock CE, Huntington JL, Lymburner L, Hostert P, Gao F, Lyaputin A, Pekel J-F, Strobl, P, Cook BD (2022) Fifty years of Landsat science and impacts. Remote Sens Env 280, article id 113195. https://doi.org/10.1016/j.rse.2022.113195.
Zhu Z (2017) Change detection using Landsat time series: a review of frequencies, preprocessing, algorithms, and applications. ISPRS J Photogramm Remote Sens 130: 370–384. https://doi.org/10.1016/j.isprsjprs.2017.06.013.
Total of 74 references.
