Kristina Ahnlund Ulvcrona  ,
Lars Karlsson,
Ingegerd Backlund,
Urban Bergsten
,
Lars Karlsson,
Ingegerd Backlund,
Urban Bergsten
Comparison of silvicultural regimes of lodgepole pine (Pinus contorta) in Sweden 5 years after precommercial thinning
Ahnlund Ulvcrona K., Karlsson L., Backlund I., Bergsten U. (2013). Comparison of silvicultural regimes of lodgepole pine (Pinus contorta) in Sweden 5 years after precommercial thinning. Silva Fennica vol. 47 no. 3 article id 974. https://doi.org/10.14214/sf.974
Highlights
- Management regimes can serve different purposes such as biomass production, pulp and timber production or a combination of those
- 30 tons biomass or 38–45 m3 stem volume ha–1 could be derived by schematic corridor thinning (70%) at year 20
- Producing large amounts of biomass early in the rotation period does not exclude a conversion into pulp and timber production.
Abstract
Early effects (stem volume, mean diameter at breast height weighted against basal area (Dgv) (Dgv), biomass and damage frequency) of different silvicultural regimes 18-19 years after direct seeding of lodgepole pine in northern Sweden were analysed. A Conventional regime, (i) precommercial thinning (PCT) to 2200 stems ha-1, was compared to: (ii) High biomass production (15 300 stems ha-1, no PCT) with and without corridor thinning at year 20, (iii) production of Large dimension trees (PCT to 1700 stems ha-1), (iv), Combined high biomass production and production of conventional round wood (PCT to 4500 stems ha-1). PCT was done 15 yrs after direct seeding for all PCT treatments. Local biomass functions showed that the regimes aiming at High biomass production displayed ca 144-157% more biomass and 134-143% more stem volume than the Conventional and Large dimension regimes (ca 21 tons and 31 m3 ha-1). Dgv for the 1000 (9.2 cm) and 2000 (8.3 cm) largest trees ha-1 appeared unaffected by regime. By schematic corridor thinning (70% of the total area) at year 20 in the High biomass regime, 27-32 tons of biomass ha-1 and 38-45 m3 ha-1 could be derived while still having a Dgv of the 1000 largest trees ha-1 of about 8 cm. Therefore, this study indicates that it is possible to produce and harvest large amounts of biomass and stem volume early in the rotation period without excluding later pulp and timber production. This initial regime comparison should be continued over time.
Keywords
direct seeding;
forest production;
corridor thinning;
biomass harvest;
PCT
-
Ahnlund Ulvcrona,
SLU, Forest Biomaterials and Technology, Skogsmarksgränd, SE-901 83 Umeå, Sweden
E-mail
kristina.ulvcrona@slu.se
- Karlsson, SLU, Forest Biomaterials and Technology, Skogsmarksgränd, SE-901 83 Umeå, Sweden E-mail lars.karlsson@slu.se
- Backlund, SLU, Forest Biomaterials and Technology, Skogsmarksgränd, SE-901 83 Umeå, Sweden E-mail ingegerd.backlund@slu.se
- Bergsten, SLU, Forest Biomaterials and Technology, Skogsmarksgränd, SE-901 83 Umeå, Sweden E-mail urban.bergsten@slu.se
Received 22 March 2013 Accepted 4 July 2013 Published 5 September 2013
Views 228059
Available at https://doi.org/10.14214/sf.974 | Download PDF

1 Introduction
Lodgepole pine (Pinus contorta var. latifolia) was introduced on a large scale in Swedish commercial forestry during the 1970s and 1980s (Elfving et al. 2001). The main purpose was to produce pulp, since a future shortage of forest raw material was foreseen at that time (Hagner and Fahlrot 1974; Hagner 1983). The first plantations are already producing not only pulp but also timber. The total standing volume on not-protected productive forest amounts to 30.2 million cubic meters, and 6000 hectares are annually regenerated with the species (Swedish Statistical Yearbook of Forestry 2011). The Swedish experiences has been that lodgepole pine produces about 36% more stem volume than the native Scots pine (Pinus sylvestris L.) in the northern parts of the country (Elfving et al. 2001) and a shortened rotation period compared to Scots pine could thus be expected. In the southern parts of the country findings by Liziniewicz et al. (2012) did not indicate the same superiority.
Today, forest biomass is seen as a possible raw material for new bio-based concepts including materials and chemicals as well as solid, liquid and gaseous biofuels (Clark and Deswarte 2008; FitzPatrick et al. 2010; Alén 2011). Fractions like branches, needles, cones and bark are achieving more attention as feedstock for production of fuels and high value chemicals (Demirbas 2011). Thus, whole-tree biomass will become increasingly important as an assortment alongside pulp and timber. Although lodgepole pine allocates a smaller proportion of the biomass to the stem than Scots pine, it still produces more stem biomass (Norgren 1996). Moreover, several different commercially important chemicals and nutrients can be identified in biomass from lodgepole pine (Stolter et al. 2009). Therefore, lodgepole pine might be a suitable choice of species if the goal is to produce large amounts of biomass for several end uses within shorter rotations, than currently applicable in Fennoscandian forestry.
Direct seeding (compared to planting) often creates trees that have more stable root systems (cf. Rosvall 1994) and it is more cost-effective when dense stands are desired (Wennström et al. 1999). In very dense lodgepole pine stands the stand density needs to be regulated by pre-commercial thinning (PCT), in order to avoid self-thinning and growth stagnation (Johnstone 1981; Teste and Lieffers 2011). Also, some trees growing in young dense stands at exposed sites are typically susceptible to snow damage because they tend to develop short and asymmetrical crowns (Valinger et al. 1993) and low stem tapering (Päätalo 2000). However, the effects of different stand stem densities on stand development after direct seeding of lodgepole pine have not been extensively studied.
In practical forestry, management regimes are generally given as thinning guidelines. For lodgepole pine the guidelines for Scots pine are often used with an addition of 3 meter to the site index, SI (Normark 2011). According to the routines used in forestry the stands should be pre-commercially thinned to 1300–2500 stems per hectare depending on SI used (Pettersson et al. 2012), but it is becoming more common to save up to 3000 stems of sown lodgepole pine per hectare after PCT (Normark 2011). In general, stem volume and biomass levels increase with the number of stems per hectare up to a stand density of 4000–5000 stems per hectare (Sjolte-Jørgensen 1967; Harms and Langdon 1976; Pettersson 1993). According to Liziniewicz et al. (2012) stem volume production of planted lodgepole pine generally increases with stand density up to ca 5000 stems per hectare within the first 25 years of the rotation period. Backlund and Bergsten (2012) studied 30-year old direct seeded lodgepole pine stands in mid-northern Sweden, and concluded that higher stand stem densities (≥3000 stems ha–1) than conventional yielded substantially more biomass with only slight reductions in breast height diameter (DBH). The development of stem volume with respect to dominant height in direct seeded stands was becoming comparable to that in planted stands with similar spacing and SI. Depending on the future aims, different stand densities to those currently retained after tending treatments may be preferred in the management of lodgepole pine.
Furthermore, if early biomass thinning with the intention to harvest bioenergy is to be made in younger stands instead of conventional pre-commercial thinning (PCT), new techniques and technology are needed (cf. Bergström et al. 2010; Karlsson et al. 2013). Geometric thinning (e.g. corridor thinning), might be required to increase productivity at harvest (Bergström et al. 2010), and to decrease costs associated with thinning operations in young, dense stands. Typically stands subjected to corridor thinning will display rows or clusters of trees rather than the conventional approach where trees are evenly distributed in the stand. From a practical standpoint Bergström et al. (2010) suggested that 1 m could serve as an appropriate corridor width but further studies on corridor design is needed to evaluate risks of e.g. snow and wind damage (cf. Valinger et al. 1993). Groups of trees left after thinning accumulate significantly less snow than trees left more evenly distributed in the stand according to a study on lodgepole pine by Woods et al. (2006). However, it has become evident that many individual trees per ha can grow to commercial valuable sizes regardless of structure and stem density in the stand (Ulvcona 2011; Karlsson et al. 2013). Therefore, comparisons of Dgv of the 1000–2000 largest trees ha–1, representing future crop trees of a stand, can serve as a descriptive stand variable complementing the overall Dgv.
The objectives of this study were to compare young stand development (stem volume and DBH, biomass, damage frequency) of different silvicultural regimes of lodgepole pine 19–20 years after direct seeding, five years after PCT, and at the first year of biomass corridor thinning. The comparisons include different regimes with PCT and stand densities 1700 stems ha–1 – 4500 stems ha–1 compared to no PCT (15 300 stems ha–1).
2 Materials and methods
2.1 Site description
The experimental site is located in Bjärkliden, northern Sweden, 64°48´N, 19°41´E (WGS 84) in a commercial forest owned by the forest company Holmen Skog AB. The altitude varies between 310 and 340 meters, the dominating field layer is bilberry (Vaccinium myrtillus) and Site index (dominant height at 100 years of total age) defined from former stand T20. The experimental site is located on a south-southwest facing slope, approximately 20 degrees. The soil texture is moraine, a bit coarser than sandy-till (Hägglund and Lundmark 1987). The length of the growing season is about 120–150 days, defined as number of days with a minimum mean temperature of 5 °C. The mean growing season temperature sum based on a threshold temperature of 5 °C is 800–900 degree days, and the annual precipitation is 700–800 mm (Swedish Survey of Forest Soils and Vegetation 2013). The stand originates from direct seeding in July 1993 of lodgepole pine after harrowing in 1992, the provenance of the seeds is unknown. The width of the tracks was somewhat longer between pairs of tracks, (2.7 m) than within the paired tracks (2.0 m). According to the forestry register at Holmen Skog, District Norsjö, the seed dosage was 0.4 kg ha–1 and the resulting number of seedlings per hectare varied between 8000–13 500, result from inventory at the time of establishment of the field experiment.
2.2 Design of field experiment
The field experiment was established in September 2006, 14 vegetation periods after sowing, and consists of two blocks, each with seven 400 m2 plots and two plots in each block with the size of 700 m2. The first block was located in the upper part of the slope, and the second in the lower part of the slope. The size of each net plot is 20 x 20 m, and 20 x 35 m respectively, with a 2.5 m buffer zone for each plot (5 m buffer zone between net plots). PCT to the number of stems for each treatment was performed in July 2007 (year 15) on the gross plots using a motor-manual brush saw and the treatments (i.e. different number of stems ha–1) were decided by drawing lots. The treatments in the 400 m2 plots were the following; (i) Conventional, PCT to 2200 stems ha–1 (one replicate), (ii) aiming for High biomass with no PCT (two replicates), (iii) aiming for Large dimension, PCT to 1700 stems ha–1 (≥1.3 m, BH) (two replicates), and (iv) Combined treatment aiming for both high biomass and large dimensions, PCT to 4500 stems ha–1 (two replicates). Also in the two plots in each block sized 700 m2 the treatment was High biomass, in these plots two corridor thinning treatments were applied in early June 2012. No difference according to soil condition, stand density, basal area or dominant height was found between plots before establishment of field experiment. The field experiment was established by staff from the Unit for field-based forest research, Swedish University of Agricultural Sciences, Vindeln research field station according to routines for long time field experiments (Karlsson 2003).
2.3 Corridor thinning
Two different corridor treatments were applied (first week of June 2012) perpendicular to the direct seeding rows resulting in clusters of trees. In both treatments the total corridor area was about 70% of the total plot area, aiming for a tree cluster density after thinning corresponding to a stem number per hectare that is common after a first thinning in conventional management regimes. The importance of mutual support by trees and distance between tree clusters was tested by applying two different corridor widths. Thus, corridor widths were 0.7 and 1.4 m and the unthinned strips left between corridors were 0.3 and 0.6 m respectively. The width of the corridors was measured using measuring tapes and sticks, and trees that should be left were marked. The thinning was carried out manually in order to avoid machine-related damage. Strip roads (3 m wide) were located every 20 m (i.e. one strip road in the middle of each plot); however elevation gradients and ground obstacles were considered when constructing the strip roads. Levels of biomass and stem wood removed in corridor thinning were quantified and stand characteristics after thinning were described.
2.4 Stand measurements and calculations of stem volume
The inventory was done in late October and early November 2011 and all plots were measured. Not only lodgepole pine trees but also naturally regenerated trees of Scots pine, Norway spruce and birch were measured. Plots subjected to corridor thinning were re-measured before (June) and after harvest (September) in 2012. DBH (1.3 m height) was recorded (mm) for all trees within the net plots. Digital callipers were used for the inventory. The tree height of selected trees (five of the tallest trees and an additional 20–30 sample trees per plot representing all DBH-classes) were measured (dm) at the same time using a digital hypsometer (Vertex® Haglöf Sweden AB, Långsele). Height curves were constructed using Näslund`s equation (1936) based on sample trees. The heights for lodgepole pine were estimated using the constant 2. All trees in the respective plots were assigned individual heights for each species and treatment.
Mean DBH was calculated as mean diameter weighted against basal area and is referred to as Dgv. Dgv for the 1000 and 2000 largest trees, which can represent the future pulp and timber trees was also calculated and presented. During the inventory in 2011, in total 24 different damage types were recorded, depending on position and impact on the tree. The most severe damages were divided into two groups and analysed in this study. The first group consisted of leaning (obviously bent tree, probably caused by snow or/and wind, or caused by an adjacent tree leaning against the stem) and laying trees; while dead trees and broken stems (broken stem below the crown and within the crown, not broken top shoot) constituted the second group. Additional measurements (same procedures as above) were carried out after the corridor thinning.
Stem volume for lodgepole pine was estimated using functions presented by Eriksson (1973), volume function No 21. For trees with DBH < 50 mm, stem volumes were estimated using equations for tree species in northern Sweden presented by Andersson (1954). The stem volumes over bark for Scots pine, Norway spruce and birch with DBH > 50 mm were estimated using stem volume functions developed by Brandel (1990); section 5.2 equation 1. The parameters in this equation were taken from Brandel´s (1990) tables 1211, 1221 and 1231 for Scots pine, Norway spruce and birch in northern Sweden, respectively.
2.5 Biomass functions
For Scots Pine (Pinus sylvestris L.), Norway spruce (Picea abies (L.) Karst.) and birch (Betula spp.) Marklund’s (1988) functions were used to estimate tree biomass in terms of dry weight (kg). Different functions for stem, branches and needles for each species were used, see (Marklund 1988) for details. The weights for all fractions for each species were added and then converted to units of tons per hectare.
Local functions were constructed for lodgepole pine after destructive biomass harvest of 29 sample trees. Tree size varied from diameter at breast height (DBH measured at the height of 1.3 m) 3–114 mm, and sampling was done in early June and September 2012. Tree height, DBH and crown length were recorded for each tree. Six discs (5 cm thick) from the stem (from the base, 1.3 m height, 30%, 55%, 70% and 85% of tree height) were collected. The crown was divided into four strata, 25% of crown length for each stratum, and one sample branch was selected from each stratum. The sample branches were subjectively judged to represent all branches from that stratum. One dead branch was selected from below the living crown from each sample tree. All other branches were separated as dead or alive and weighed separately for each stratum. The sample branches and discs were weighed separately on a laboratory balance (6 kg maximum ± 0.5 g) and dried in ventilated oven, 85 °C. The branches were dried for 48 h and foliage were separated from branches and weighed separately. The discs were also dried in 48 h, and then further dried until their weight ceased to change on further drying. Four of the sample trees with DBH < 20 mm were collected as whole trees, and all branches were weighed and dried. Also the whole stem was weighted and dried without sample discs. For further details see Ulvcrona (2011).
Biomass functions were constructed for the stem above stump (height < 10 cm) including bark, and for the total tree including stem, bark, branches, foliage and dead branches. The functions were fitted using the MINITAB 15 software package (Minitab Statistical Software 2007). The regressions are based on the following model, Eq. 1:
![]()
where Yi is the natural logarithm of the dry weight in kg, ln (DW). β0 is the intercept, βi the coefficient for the variable xi , and xi is the variable whose impact on the dry weight is being assessed. ε are uncorrelated random error, all with E (ε1) = 0. A number of different variables were evaluated; those that were incorporated into the model were all significant at the p ≤ 0.05 level. The variables found to pass the evaluations were ln DBH (cm) and ln H (dm). To avoid multicollinearity, only one of the variables was used for each regression (Tamhane and Dunlop 2000). Regressions with significant variables (p ≤ 0.05) were evaluated further using the following tests:Plots of the residuals against individual predictor variables to check linearity.
- Plots of the residuals against fitted values to check the assumption of constant variance.
- A normal plot of the residuals to check the normality assumption; Anderson Darling´s test for normality was performed (Tamhane and Dunlop 2000).
The logarithmic transformation was applied to the data to obtain constant variance (Sabin and Stafford 1990). The regressions that were ultimately chosen satisfied all of the criteria listed above. When transforming, the results were corrected for logarithmic bias according to Finney (1941). The residuals of the functions were analysed by examining the difference between the calculated and estimated dry weight for the sampled trees.
2.6 Statistical analysis
Treatment effects on stand parameters basal area, stem volume, biomass, dominant height (the arithmetic mean height of the 100 largest trees per hectare), mean diameter, mean diameter of future crop trees and damage were evaluated by analysis of variance, using the GLM procedure in MINITAB (Minitab Statistical Software 2007), with the following model:
![]()
where μ denotes the grand mean and εij is the error term NID (0, σ2). Block effects (βj) were considered random, and treatment (αi) effects were considered fixed. Where significant differences (p ≤ 0.05) were identified Tukey’s test was used to separate treatments.
2.7 Comparisons with other field studies
The four regimes Conventional, High biomass, Large dimension, and Combined were compared to growth studies in older sown and planted lodgepole pine stands in northern Sweden (Backlund and Bergsten 2012) to discuss possible future development. The material used for comparison consisted of 16 direct seeded stands in Härjedalen and Hälsingland (62°N with an altitude of 200–400 m.a.s.l. in Hälsingland and 400–600 m.a.s.l. in Härjedalen) established in the beginning of the 1980s and planted stands at Ängomsåsen (lat. 62.4°N, alt. 105 m.a.s.l.) in Västernorrland that were planted in 1970 at five different spacings (1.1 m; 1.6 m; 2.0 m; 2.85 m and 4.0 m) on fertile grassland (Elfving1996).
3 Results
3.1 Regime comparisons
Tree species distribution based on basal area resulted in about 99% lodgepole pine for all treatments, except for the treatment High biomass which had 93% of lodgepole pine, 2% Scots pine (Pinus sylvestris), 4% Norway spruce (Picea abies) and 1% birch (Betula spp.). Other species represented were for the treatment Conventional; Scots pine (0.9%), Large dimension; Norway spruce (0.6%), and for Combined; Scots pine (0.4%), Norway spruce (0.4%) and deciduous species (willow, Salix ssp., mountain ash, Sorbus aucuparia (0.2%).
Basal area and biomass of the High biomass regime were significantly higher compared to all other regimes, and stem volumes of High biomass and Combined were significantly higher than the Conventional and Large dimension regimes (Table 1). The two regimes aiming for High biomass production displayed ca 144–157% more biomass and 134–143% more stem volume than the Conventional and Large dimension regimes (ca 21 tons and 31 m3 per ha). Dominant tree heights varied between 7.2 and 7.7 m and were not found to be influenced by management regime (Table 1). The highest Dgv of all trees was found in Large dimension and the lowest Dgv was found in High biomass but there was no statistical difference in Dgv between Conventional and Combined regimes (Table 1). The Dgv of the 1000 and 2000 largest trees ha–1 was not significantly different between regimes.
| Table 1. Regime means of basal area, stem volume, biomass, number of stems ha–1, dominant height, mean diameter at breast height weighted against basal area (Dgv), mean Dgv for the 1000 and 2000 largest lodgepole pine trees ha–1 for each treatment after inventory autumn 2011. Means with different letters are different at the 0.05 level of significance according to Tukey's multiple comparison test (no test for number of stems). | ||||||||
| Silvicultural regime | Number of stems (ha–1) | Dgv (cm) | Dgv 1000 largest trees ha–1 (cm) | Dgv 2000 largest trees ha–1 (cm) | Basal area (m2 ha–1) | Stem volume (m3 ha–1) | Biomass (ton ha–1) | Dominant height (m) |
| Conventional | 2150 | 8.0 b | 8.9 a | 8.0 a | 9.3 c | 31.5 b | 21.6 c | 7.2 a |
| High biomass | 15331 | 6.2 c | 8.8 a | 8.1 a | 21.4 a | 73.9 a | 52.8 a | 7.6 a |
| Large dimension | 1663 | 8.9 a | 9.6 a | - | 8.8 c | 30.4 b | 20.6 c | 7.5 a |
| Combined | 4481 | 7.7 b | 9.6 a | 8.7 a | 16.1 b | 63.0 a | 39.5 b | 7.7 a |
There were no significant differences between regimes in damage frequencies except for the difference in number of leaning/laying trees between Combined and Large dimension, and Conventional. The lowest values of damage (ratios of tree numbers and basal area) regarding laying and leaning trees (about 2%) were found in the unthinned High biomass, and the highest values were found in Large dimension (somewhat above 10%). Irrespective of regime, the basal area of dead trees and broken stem was only about 1% of the total basal area (Table 2).
| Table 2. Damage results of different regimes. Number of trees presented in total number of stems ha–1, as a ratio of total number of trees (%), in basal area (m2 ha–1), and as a ratio of total basal area (%). Means with different letters are different at the 0.05 level of significance according to Tukey´s multiple comparison test. | ||||
| Damage class | Number of trees (ha–1) | Ratio of total number of trees (%) | Basal area (m2 ha–1) | Ratio of total basal area (%) |
| Leaning and laying trees | ||||
| Conventional | 263 b | 12.0 a | 0.87 a | 9.3 a |
| High biomass | 319 ab | 2.1 a | 0.37 a | 1.6 a |
| Large dimension | 263 b | 15.8 a | 0.99 a | 11.3 a |
| Combined | 406 a | 9.0 a | 1.13 a | 7.0 a |
| Broken stems and dead trees | ||||
| Conventional | 38 a | 1.7 a | 0.09 a | 1.0 a |
| High biomass | 213 a | 1.3 a | 0.14 a | 0.6 a |
| Large dimension | 69 a | 4.0 a | 0.13 a | 1.4 a |
| Combined | 144 a | 3.3 a | 0.20 a | 1.3 a |
The highest number of dead trees were found in High biomass, and the diameter distribution shows that most dead trees were found in DBH-class < 50 mm (Fig. 1a). For comparison, but in a different scale, the diameter distribution for living trees in the same treatment is shown in Fig. 1b.
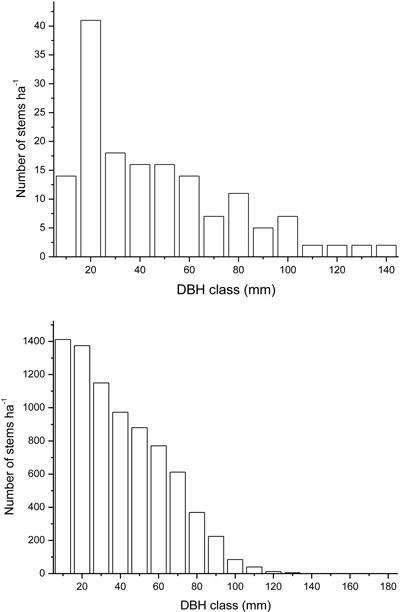
Fig. 1. a) In the top: diameter distribution of dead trees (stems ha–1) in all unthinned plots (High biomass treatment). b) Below: diameter distribution of all living trees in all unthinned plots (High biomass treatment). Different scales are used in the two diagrams.
3.2 Corridor thinning in High biomass regime
At corridor width 0.7 m, ca 27 tons of biomass and 38 m3 ha–1 of stem wood were extracted while the corresponding figures at corridor width 1.4 m were 17% and 18% higher, although differences were not significant (Table 3). At 0.7 m corridor width about 67% of the total stem number and 64% of the standing volume was harvested, whereas the figures at the treatment with 1.4 m wide corridors were 70 and 69%, respectively. The number of tree clusters ha–1 after corridor harvest, defined as a group of trees delimited to other trees by the seeding rows and the perpendicular corridors, differed statistically with corridor width (almost twice as many in 0.7 m wide corridors). Mean stem volumes after harvest were about 25 and 23 m3 ha–1 at the remaining strip widths of 0.3 and 0.6 m respectively but did not differ significantly. Dgv for all trees (Table 3) and the proportion of the main tree species (data not shown) was not altered by thinning treatments. Trees (including the 1000 and 2000 largest trees per ha) left after the schematic harvest were on average smaller although they had experienced one growing season more than those in other regimes (Table 3). Within the same thinning treatment Dgv for the largest trees in each tree cluster was comparable to the mean values of the 1000 to 2000 thickest stems ha–1 (Table 3). Dgv of the different tree clusters varied between cm classes 0–1 and 11–12 and a higher proportion of small trees appeared to be retained when applying a corridor width of 0.7 m instead of 1.4 m (Fig. 2). The arithmetic mean DBH was 35 mm for the 0.3 m wide strips and 39 mm where trees were left in 0.6 m wide strips. The difference in number of trees ha–1 that were >50 and >80 mm, respectively, was not statistically significant between the corridor thinning treatments (Table 3).
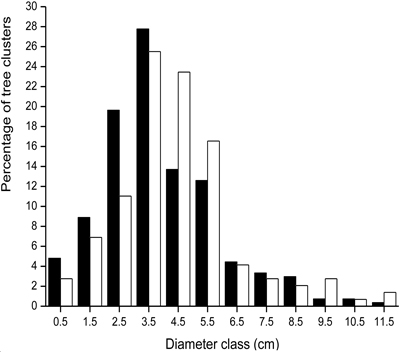
Fig. 2. Arithmetic mean diameter at breast height distribution (class-middle shown on the x axis) in the tree clusters remaining after 70% corridor thinning (black = 0.3 m wide strips left between 0.7 m wide corridors; white = 0.6 m wide strips left between 1.4 m wide corridors).
| Table 3. Stand characteristics after corridor thinning in High biomass regime, including number of trees and tree clusters, basal area, and mean diameter at breast height (1.3 m) weighted against basal area (Dgv) for all trees in autumn 2012. Number of trees ha–1 with DBH > 50 mm, and 80 mm, Dgv for the 1000 and 2000 largest trees (only lodgepole pines) per hectare, and Dgv and mean height for dominant trees within retained tree groups based on all trees left after harvest. Means with different letters are different at the 0.05 level of significance according to Tukey's multiple comparison test. View in new window/tab. |
3.3 Comparisons to other field studies and further stand development
The High biomass regime indicates a stem volume development similar to, or even slightly higher than the conventionally planted lodgepole pine stands at Ängomsåsen (density 2500 stems ha–1; Fig. 3). If the volume development continues in the same pattern the High biomass regime will reach the same volume as the dense planted stands at Ängomsåsen (3900 stems ha–1) in a few years. The stem volume development of the treatments Conventional and Large dimension is comparable to dense (≥3000 stems ha–1) sown stands in Härjedalen and Hälsingland or sparse planted stands (1230 stems ha–1) at Ängomsåsen. The Combined treatment did not differ much from Conventional and High dimension regimes in 2008, but has since then had a substantial volume increment and is not far behind the High biomass regime in stem volume development.
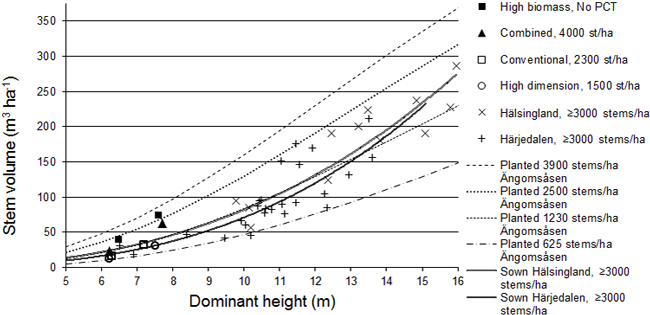
Fig. 3. Stem volume development with respect to dominant height of Bjärkliden regimes (as measured 2008 and 2011) compared to planted stands in Ängomsåsen, Sundsvall (Elfving 1996) and sown stands in Härjedalen and Hälsingland (Backlund and Bergsten 2012).
4 Discussion
4.1 Regime comparisons in general
The highest values of standing volume and tree biomass were, as expected, found in the densest regime High biomass, in accordance with findings of Varmola et al. (2000), Johnstone (2005) and Liziniewicz et al. (2012). The total biomass in the treatment High biomass was 144% greater than in the Conventional treatment regime. We did not detect any differences in dominant height between treatments in accordance with findings of Varmola et al. (2000). However, in spacing trials Elfving (1996) and Liziniewicz et al. (2012) have reported a reduction in dominant height of planted lodgepole pine at wide spacings.
As expected, the Dgv increased with decreases in stand density. However, amongst the currently 1000 and 2000 largest trees per ha there were only minor differences between regimes. Most likely these largest trees will constitute the crop trees after future biomass thinnings. Therefore it seems that the High biomass and the Combined regimes can be transferred to a conventional treatment regime where the aim is to produce pulp and timber without any major losses in stem volume. However, the Dgv development must be monitored for a longer time period than five years before such a conclusion can be made with any certainty as the differences between treatments may change over time.
The possibility to produce biomass at young age and conventional round wood dimensions later in the rotation period is presented in the Combined regime. If around 4500 stems are left after PCT instead of the conventional ca 2200 stems ha–1, substantially more stem volume and biomass can be achieved, while the mean diameter is not negatively affected at this age. This regime has potential to develop timber trees as good as the Conventional regime. Further analyses of wood quality are however needed. However, compared to the High biomass corridor thinning alternative, a PCT at age 15 entails extra cost without the immediate benefit a biomass thinning entails. Ca 1.5 cm higher Dgv is found in the Combined regime compared to the newly thinned corridor regimes. Thinning where main use of wood is for biomass of both these regimes might be the next step in a couple of years. The mean Dgv, stem volume, biomass and damage frequency at the time for energy harvest is crucial both for biomass harvest and for the possibility to later harvest good quality crop trees.
Over all, low frequencies of dead trees and trees with broken stem were found during the inventory. The highest number of dead trees in the unthinned High biomass plots is probably a result of competition for resources from larger trees. Similar results are also found in other studies (Harcombe 1987; Zeide 2010). Our results that the largest number of dead trees are found among the smallest trees are supported by other studies (Weiner and Thomas 1986; Pretzsch 2009).
Although there were no significant differences between regimes in leaning/laying trees (ratio of basal area) the future risk of snow and wind damage could differ between regimes. It is especially important to consider snow damage in lodgepole pine as previous studies have indicated that it is sensitive to snow damage (Hansson and Karlman 1997). Several studies have reported higher levels of damage caused by wind and snow with increasing stand density (Reukema 1970; Reukema 1979; Cremer et al. 1982; Oliver 1997). The overall explanation is that the Height:DBH quote tends to become higher in dense stands, i.e. decreasing DBH caused by increased competition (Cremer et al. 1982; Wonn and O´Hara 2001). Generally trees with a small DBH are considered to be more susceptible to bending caused by snow (Megahan and Steele 1987; Päätalo et al. 1999), and in studies made by Ffolliot and Thompson (1976) and Salm (1978) it was found that the stabilization effect of conifer trees on a snowpack starts at a minimum DBH of 8–10 cm. The results of this study where most leaning/laying trees occurred in the treatment Large dimension, might be a result of sensitivity to snow and wind damage in the years following PCT in combination of the late PCT. Similar results have also been reported (Teste and Lieffers 2011). Late PCT to wider spacing might result in many trees lacking mutual support from neighbouring trees (cf. Shepard 1975).
Lodgepole pine was introduced in Fennoscandian silviculture mainly for pulp production, but due to increasing competition from intercontinental pulp and paper industry, combined with a growing demand on biomass energy and biorefinery products, whole-tree biomass assortments are likely to present a larger share of total production and economic income, maybe at the expense of pulpwood (Näyhä et al. 2011). Thus, keeping a higher number of stems in a combined biomass-timber regime together with one or more biomass harvests early in the rotation period might be a good adaptation, and of economic benefit for the forest owner. If diversified goal-oriented lodgepole pine regimes are used, final harvest should be scheduled depending on whether large dimension trees or shorter rotation biomass production is the main goal, or a combination of those as in the Combined regime.
4.2 High biomass with and without corridor thinning
In thinning operations timing is an essential parameter to consider. In this experiment removal levels were evaluated by applying corridor thinning at age 20 in the large High biomass plots. However, the frequency of dead trees was still rather low in the High biomass regime indicating a possibility to postpone thinning even further in time. Overall, around 30 ton of biomass and up to 45 m3 of stem volume per hectare was derived but large volumes could likely have been obtained somewhat earlier in the rotation period. Taking risk of damage and biomass production into account, there seems to be quite a large time window in which the first thinning could be conducted. At least it seems reasonable to apply the first biomass thinning between stand ages 15 and 25 (dominant height 6–9 m), depending on overlying goals and expectations. The biomass removed in this study equals about 62–73 MWh ha–1 using values of pines with a moisture content of 50% and an ash content of 1.5% (Lehtikangas 1999). This amount of derived bioenergy would make up for a substantial economical gain for the forest owner if the thinning is made cost-effectively. Further value can be added if chemicals and nutrients such as fatty and resin acids, aromatics and sterols are being extracted and utilized in biorefinery industry for the production of e.g. fuels, cosmetics, adhesives and food additives (Clark and Deswarte 2008; Stolter et al. 2009; FitzPatrick et al. 2010; Alén 2011).
With a thinning intensity of 70% the retained stem number was considered to be sufficient in order to maintain a high biomass/volume production in the plots (Karlsson et al. 2013). Also, the number of tree clusters left after thinning shows that the aim of having conventional spacing between crop trees could be reached (if there is on average about one dominating tree per cluster, each cluster having on average 3–4 stems, cf. Table 3). However, there were surprisingly large variations in the numbers of remaining stems and tree clusters ha–1 between corridor treatments. Compared to other regimes Dgv for all trees as well as for the 1000–2000 thickest trees ha–1 were lower after harvest. It would thus be beneficial to adopt a degree of flexibility (selectivity), instead of performing the harvest in a strictly schematic sense, as in the current study, in order to manipulate the stand density and to not decrease the mean diameter of future pulp and timber trees. Moreover, there were large variation in Dgv between tree clusters and also indications of a higher proportion of small trees in plots with 0.3 m wide strips compared to where the width was 0.6 m. However, mean values of dominant trees in the remaining tree clusters reveals that relatively large trees were evenly distributed across the stand. Thus, after a thinning, where mainly dominant trees in the groups are retained, the stands may still be suitable for pulp and timber production. In the time between the first and the second thinning the dominant trees in the clusters will most likely have support from neighbouring trees which might decrease the risk of stem bending (Shepard 1975). Total stand density and canopy gap size after thinning are more important for stability than the exact pattern of thinning (Gardiner et al. 1997).
4.3 Comparisons to other field studies and further stand development
To date the High biomass regime has produced almost 53 ton of biomass ha–1 and 74 m3 ha–1 of stem volume. Further measurements at older age are required to confirm the estimated future growth development of the regime, but if it keeps developing in a similar way to comparable lodgepole pine stands in Fig. 3, the High biomass regime might reach a stem volume of about 300 m3 ha–1 at 15 m of dominant height (probably within two decades), corresponding to ca 140 tons ha–1 of dry weight of biomass. However, these assumptions are based on only two measurements over time, and further inventories are needed before drawing any conclusions. According to Backlund and Bergsten (2012) sown lodgepole pine stands seem to grow more slowly than planted stands in the beginning, but may actually grow faster than planted stands when reaching a dominant height of around 13–14 meters and above (Fig. 3), meaning that the calculated amounts of stem volume and dry weight biomass per ha can become even higher, with the caveat that the mortality of the smallest trees has to be monitored further. This indicates that high amounts of whole-tree biomass can be derived by thinning at early ages and that final felling for biomass outtake can become of interest within a short amount of time. At present such early final cutting of lodgepole pine does not interfere with current Swedish forestry legislation (Skogsvårdslag 1979:429).
Thus, there is the capacity of a goal-oriented management regime to produce a substantial amount of biomass within a relatively short time period even under the harsh northerly environment.
5 Conclusions
The different management regimes may fulfill their objectives in this field experiment, thus, which regime to choose depends largely on the overall goal. The results suggest that further analyses in similar field experiments are needed for finding a more differentiated lodgepole pine silviculture than currently implemented in Fennoscandian forestry. This study also indicates that producing large amounts of biomass early in the rotation period does not exclude a conversion into conventional pulp and timber production later on. About 30 tons of biomass ha–1 and 38–45 m3 of stem volume ha–1 was derived from dense lodgepole pine stands by applying corridor thinning at age 20 instead of conventional PCT at an earlier age.
Acknowledgements
Thanks to staff at Svartberget Experimental Field Station, Swedish University of Agricultural Sciences in Vindeln, for their skillful technical assistance in the field with establishment of field experiment, inventory in 2008 and bioenergy harvest in 2012. Thanks to Holmen Skog for providing the forest land where the experiment is established and for assistance with the pre-commercial thinning in 2007. We are grateful to Paul Smith, Vindeln Experimental Forest, Swedish University of Agricultural Sciences, for linguistic revision. This study was funded by the Swedish Energy Agency, The Swedish Forest Society Foundation (Skogssällskapet), Sveaskog, The Kempe Foundation and The Brattås Foundation.
References
Alén R. (ed.). (2011). Biorefining of forest resources. University of Jyväskylä, Laboratory of Applied Chemistry. Paper Engineers’ Association. Helsinki, Finland. 381 p.
Andersson S.O. (1954). Funktioner och tabeller för kubering av småträd. Funktionen und Tabellen zur Kubierung kleiner Bäume. Meddelanden från Statens skogsforskningsinstitut 44(12). [In Swedish].
Backlund I., Bergsten U. (2012). Biomass production of dense direct-seeded lodgepole pine (Pinus contorta) at short rotation periods. Silva Fennica 46: 609–623.
Bergström D., Bergsten U., Nordfjell T. (2010). Comparison of boom-corridor thinning and thinning from below harvesting methods in young dense Scots pine stands. Silva Fennica 44: 669–679.
Brandel G. (1990). Volume functions for individual trees: Scots pine (Pinus sylvestris), Norway spruce (Picea abies) and birch (Betula pendula & Betula pubescens). Diss. (26). Swedish University of Agricultural Sciences, Garpenberg. ISBN 91-576-4030-0.
Clark J.H., Deswarte F.E.I. (2008). Introduction to chemicals from biomass. John Wiley & Sons. 198 p. http://dx.doi.org/10.1002/9780470697474.
Cremer K.W., Borough C.J. McKinnell F.H., Carter P.R. (1982). Effects of stocking and thinning on wind damage in plantations. New Zealand Journal of Forest Science 12: 244–268.
Demirbas A. (2011). Waste management, waste resource facilities and waste conversion processes. Energy Conversion and Management 52: 1280–1287. http://dx.doi.org/10.1016/j.enconman.2010.09.025.
Elfving B. (1996). Förbands- och gallringsförsök med contorta. Mätdata från 1992–1995. Sveriges Lantbruksuniversitet, Institutionen för Skogsskötsel, Arbetsrapporter 110. [In Swedish].
Elfving B., Ericsson T., Rosvall O. (2001). The introduction of lodgepole pine for wood production in Sweden – a review. Forest Ecology and Management 141: 15–29. http://dx.doi.org/10.1016/S0378-1127(00)00485-0.
Eriksson H. (1973). Volymfunktioner för stående träd av ask, asp, klibbal och contorta-tall. Tree volume functions for ash, aspen, alder and lodgepole pine in Sweden (Fraxinus excelsior L., Populus tremula L., Alnus glutinosa (L.) Gartn., Pinus contorta Dougl. var. latifolia Engelm.). Institutionen för skogsproduktion, Skogshögskolan, Rapport 26. Stockholm. [In Swedish].
Ffolliot P.F., Thompson J.R. (1976). Snow damage in Arizona ponderosa pine stands. USDA Forest Service Research Note RM-322. 2 p.
Finney D.J. (1941). On the distribution of a variate whose logarithm is normally distributed. Journal of the Royal Statistical Society, Supp B7 7: 155–161.
FitzPatrick M., Champagne P., Cunningham M.F., Whitney R.A. (2010). A biorefinery processing perspective: treatment of lignocellulosic materials for the production of value-added products. Bioresource Technology 101: 8915–8922. http://dx.doi.org/10.1016/j.biortech.2010.06.125.
Gardiner B.A., Stacey G.R., Belcher R.E., Wood C.J. (1997). Field and wind tunnel assessments of the implications of respacing and thinning for tree stability. Forestry 70: 233–252. http://dx.doi.org/10.1093/forestry/70.3.233.
Hägglund B., Lundmark J.E. (1987). Bonitering del 1: definitioner och anvisningar. 3rd ed. Skogsstyrelsen, Jönköping. ISBN 91-85748-64-1. [In Swedish].
Hagner S. (1983). Pinus contorta: Sweden’s third conifer. Forest Ecology and Management 6: 185–199. http://dx.doi.org/10.1016/S0378-1127(83)80002-4.
Hagner S., Fahlroth S. (1974). Om contortatallen och dess odlingsförutsättningar i Norrland.Sveriges Skogsvårdsförbunds Tidskrift 4: 477–528. [In Swedish].
Hansson P., Karlman M. (1997). Survival, height and health status of 20-year-old Pinus sylvestris and Pinus contorta after different scarification treatments in a harsh boreal climate. Scandinavian Journal of Forest Research 12: 340–350. http://dx.doi.org/10.1080/02827589709355421.
Harcombe P.A. (1987). Tree life tables. Biosciences 37: 557–568. http://dx.doi.org/10.2307/1310666.
Harms W.R., Langdon O.G. (1976). Development of Loblolly pine in dense stands. Forest Science 22: 331–337.
Johnstone W.D. (1981). Precommercial thinning speeds growth and development of lodgepole pine: 25-year results. Information Report NOR-X-237. Northern Forest Research Centre, Canadian Forestry Service, Edmonton, Alberta, Canada.
Johnstone W.D. (2005). The effects of juvenile spacing on 7-year old lodgepole pine in central British Columbia. Western Journal of Applied Forestry 20: 160–166.
Karlsson K. (2003). Fältarbetsinstruktion för Skogsfakultetens beståndsbehandlingsförsök. Swedish University of Agricultural Sciences. 88 p. [In Swedish].
Karlsson L., Bergsten U., Ulvcrona T., Elfving B. (2013). Long-term effects on growth and yield of corridor thinning in young Pinus sylvestris stands. Scandinavian Journal of Forest Research 28: 28–37. http://dx.doi.org/10.1080/02827581.2012.702222.
Lehtikangas P. (1999). Lagringshandbok för trädbränslen. 2nd ed. Swedish University of Agricultural Sciences (SLU), Institutionen för Virkeslära, Uppsala. [In Swedish].
Liziniewicz M., Ekö P.M., Agestam E. (2012). Effect of spacing on 23-year-old lodgepole pine (Pinus contorta Dougl. var. latifolia) in southern Sweden. Scandinavian Journal of Forest Research 27: 361–371. http://dx.doi.org/10.1080/02827581.2011.639798.
Marklund L.G. (1988). Biomassafunktioner för tall, gran och björk i Sverige. Swedish University of Agricultural Sciences (SLU), Institutionen för Skogstaxering, Umeå, Report 45. [In Swedish].
Megahan W.F., Steele R. (1987). An approach for predicting snow damage to ponderosa pine plantations. Forest Science 33: 485–503.
Minitab Statistical Software Release 15 for Windows. (2007). Minitab Inc., UK.
Näslund M. (1936). Skogsförsöksanstaltens gallringsförsök i tallskog primärbearbetning. Meddelande från Statens Skogsförsöksanstalt 29(1). [In Swedish].
Näyhä A., Hämäläinen S., Pesonen H.L. (2011). Forest biorefineries – a serious global business opportunity. In: Alén R. (ed.). Biorefining of forest resources. University of Jyväskylä, Laboratory of Applied Chemistry. Paper Engineers’ Association. Helsinki, Finland. p. 132–150.
Norgren O. (1996). Growth analysis of Scots pine and lodgepole pine seedlings. Forest Ecology and Management 86: 15–26. http://dx.doi.org/10.1016/S0378-1127(96)03800-5.
Normark E. (2011). Holmen skog – guidelines for sustainable forest management. 4th edition. Holmen skog, Örnsköldsvik. http://www.holmen.com/Global/Holmen%20documents/Publications/Handledningar/Holmen_guidelines_for_sustainable_forest_management_2011.pdf.
Oliver W.W. (1997). Twenty-five-year growth and mortality of planted ponderosa pine repeatedly thinned to different stand densities in northern California. Western Journal of Applied Forestry 12: 122–130.
Päätalo M.L. (2000). Risk of snow damage in unmanaged and managed stands of Scots pine, Norway spruce and birch. Scandinavian Journal of Forest Research 15: 530–541. http://dx.doi.org/10.1080/028275800750173474.
Päätalo M.L., Peltola H., Kellomäki S. (1999). Modelling the risk of snow damage to forests under short-term snow loading. Forest Ecology and Management 116: 51–70. http://dx.doi.org/10.1016/S0378-1127(98)00446-0.
Pettersson N. (1993). The effect of density after precommercial thinning on volume and structure in Pinus sylvestris and Picea abies stands. Scandinavian Journal of Forest Research 8: 528–539. http://dx.doi.org/10.1080/02827589309382799.
Pettersson N., Fahlvik N., Karlsson A. (2012). Skogsskötselserien nr 6 – Röjning. Andra omarbetade upplagan. Skogsstyrelsen, Jönköping. [In Swedish].
Pretzsch H. (2009). Forest dynamics, growth and yield from measurements to model. Springer, Berlin.
Reukema D.L. (1970). Forty-year development of Douglas-fir stands planted at various spacings. USDA Forest Service Research Paper PNW-100. 21 p.
Reukema D.L. (1979). Fifty-year development of Douglas-fir stands planted at various spacings. USDA Forest Service Research Paper PNW-253. 21 p.
Rosvall O. (1994). Stability in lodgepole pine and resistance to wind and snow loads. Report 2 1994. SkogForsk (Forestry Research Institute of Sweden), Uppsala. 47 p. [In Swedish with English summary].
Sabin T.E., Stafford S.G. (1990). Assessing the need for transformation of response variables. In: Forest research lab. College of Forestry, Oregon State University. p. 30.
Salm B. (1978). Snow forces on forest plants. In: Proc. Seminar on Mountain Forests and Avalanches, Davos, Switzerland, Sept. 25–28, 1978. International Union of Forest Research Organizations. p. 157–181.
Shepard R.K. (1975). Ice storm damage to loblolly pine in northern Louisiana. Journal of Forestry 73: 420–423.
Sjolte-Jørgensen J. (1967). The influence of spacing on the growth and developmentof coniferous plantations. International Review of Forest Research 2: 43–94.
Skogsvårdslag 1979:429. (1979). Latest changed in 2011. Swedish forestry law. http://www.notisum.se/rnp/sls/lag/19790429.htm. [In Swedish].
Stolter C., Niemelä P., Ball J.P., Julkunen-Tiitto R., Vanhatalo A., Danell K., Varvikko T., Ganzhorn J.U. (2009). Comparison of plant secondary metabolites and digestibility of three different boreal coniferous trees. Basic and Applied Ecology 10: 19–26. http://dx.doi.org/10.1016/j.baae.2007.12.001.
Swedish statistical yearbook of forestry. (2011). Swedish Forest Agency, Jönköping.
Swedish survey of forest soils and vegetation. (2013). [Internet site]. Department of Soil and Environment, Swedish University of Agricultural Sciences (SLU). http://www-markinfo.slu.se. [Cited 1 Mar 2013].
Tamhane A.C., Dunlop D.D. (2000). Statistics and data analysis. Prentice-Hall, Inc.
Teste F.P., Lieffers V.J., (2011). Snow damage in lodgepole pine stands brought into thinning and fertilization regimes. Forest Ecology and Management 261: 2096–2104. http://dx.doi.org/10.1016/j.foreco.2011.03.003.
Ulvcrona K.A. (2011). Effects of silvicultural treatments in young Scots pine-dominated stands on the potential for early biofuel harvest. Doctoral thesis 2011:79. Faculty of Forest Science, Swedish University of Agricultural Sciences, Umeå. 64 p.
Valinger E., Lundqvist L., Bondesson L. (1993). Assessing the risk of snow and wind damage from tree physical characteristics. Forestry 66: 249–260. http://dx.doi.org/10.1093/forestry/66.3.249.
Varmola M., Salminen H., Rikala R., Kerkelä M. (2000). Survival and early development of lodgepole pine. Scandinavian Journal of Forest Research 15: 410–423. http://dx.doi.org/10.1080/028275800750172619.
Weiner J., Thomas S.C. (1986). Size variability and competition in plant monocultures. Oikos 47: 211–222. http://dx.doi.org/10.2307/3566048.
Wennström U., Bergsten U., Nilsson J.E. (1999). Mechanized microsite preparation and direct seeding of Pinus sylvestris in boreal forests – a way to create desired spacing at low cost. New Forests 18: 179–198. http://dx.doi.org/10.1023/A:1006506431344.
Wonn H.T., O’Hara K.L. (2001). Height:diameter ratios and stability relationships for four northern rocky mountain tree species. Western Journal of Applied Forestry 16(2): 87–94.
Woods S.W., Ahl R., Sappington J., McCaughey W. (2006). Snow accumulation in thinned lodgepole pine stands, Montana, USA. Forest Ecology and Management 235: 202–211. http://dx.doi.org/10.1016/j.foreco.2006.08.013.
Zeide B. (2010). Comparison of self-thinning models: an exercise in reasoning. Trees 24: 1117–1126. http://dx.doi.org/10.1007/s00468-010-0484-z.
Total of 61 references
